1Q 2021 Key Business and Operational Updates - 21 April 2021
←
→
Page content transcription
If your browser does not render page correctly, please read the page content below
1Q 2021
Key Business and
Operational Updates
21 April 2021

Outline
                                                                                                                                                                                               Constituent of:
        ▪ Financial & Portfolio Highlights                                                                                                                                     5
                                                                                                                                                                                                 FTSE ST Large &
                                                                                                                                                                                                  Mid Cap Index
        ▪ Market Review                                                                                                                                                      13

        ▪ Additional Information                                                                                                                                             18                  FTSE EPRA Nareit
                                                                                                                                                                                               Global Developed Index
IMPORTANT NOTICE: The past performance of Keppel REIT is not necessarily indicative of its future performance. Certain statements made in this presentation may not be based on
historical information or facts and may be “forward-looking” statements due to a number of risks, uncertainties and assumptions. Representative examples of these factors include
(without limitation) general industry and economic conditions, interest rate trends, cost of capital and capital availability, competition from similar developments or shifts in expected
levels of property rental income, changes in operating expenses, including employee wages, benefits and training, property expenses and governmental and public policy changes, and
the continued availability of financing in the amounts and terms necessary to support future business.
                                                                                                                                                                                                     GPR 250
Prospective investors and unitholders of Keppel REIT (“Unitholders”) are cautioned not to place undue reliance on these forward-looking statements, which are based on the current                 Index Series
view of Keppel REIT Management Limited, as manager of Keppel REIT (the “Manager”) on future events. No representation or warranty, express or implied, is made as to, and no
reliance should be placed on, the fairness, accuracy, completeness or correctness of the information, or opinions contained in this presentation. None of the Manager, the trustee of
Keppel REIT or any of their respective advisors, representatives or agents shall have any responsibility or liability whatsoever (for negligence or otherwise) for any loss howsoever
arising from any use of this presentation or its contents or otherwise arising in connection with this presentation. The information set out herein may be subject to updating, completion,
revision, verification and amendment and such information may change materially. The value of units in Keppel REIT (“Units”) and the income derived from them may fall as well as rise.
Units are not obligations of, deposits in, or guaranteed by, the Manager or any of its affiliates. An investment in Units is subject to investment risks, including the possible loss of the
principal amount invested.
                                                                                                                                                                                                 MSCI Singapore
Investors have no right to request the Manager to redeem their Units while the Units are listed. It is intended that Unitholders may only deal in their Units through trading on Singapore       Small Cap Index
Exchange Securities Trading Limited (“SGX-ST”). Listing of the Units on SGX-ST does not guarantee a liquid market for the Units.

                                                                                                                                                                                                                  2
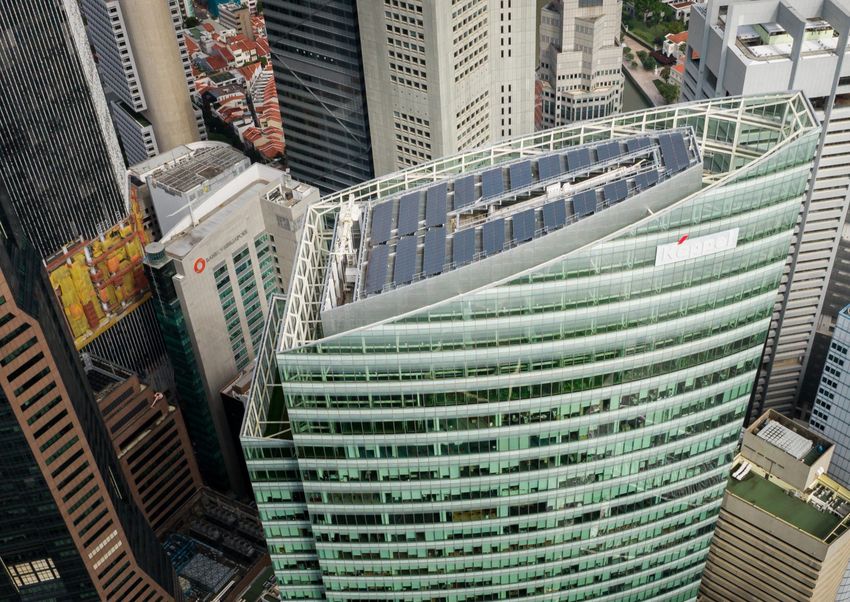
Sustainable Pan-Asian Portfolio with Income Resilience

                   $8.9b                            Singapore,                  Australia,                         ESG Awards
                                                                                 19.2%
  Grade A commercial portfolio with                   77.4%
                                                                                                                   ▪ BCA Green Mark Platinum award for
  strong committed occupancy to an                                             South                                 all Singapore assets
established and diversified tenant base                                        Korea,
                                                                               3.4%                                ▪ 5 Stars and above in the NABERS Energy
                                                                                                                     rating for most Australian assets

   Marina Bay                         One Raffles      Ocean Financial
Financial Centre                        Quay               Centre
                                                                                                                   ESG Benchmarking
                                                                                                                   ▪ ISS ESG corporate rating – Prime status
                                                                                                                   ▪ Global Real Estate Sustainability
                                                                                                                     Benchmark (GRESB) – Green Star status

                                                                                                                   ESG Indices
                                                                                                                   ▪ iEdge SG ESG Transparency Index
                                                                                                                   ▪ iEdge SG ESG Leaders Index

                    Note: Information as of 31 Mar 2021 and assuming the inclusion of Keppel Bay Tower in Singapore which was announced on 23 Dec 2020   3
                    and targeted for acquisition completion in 2Q 2021. Excluding Keppel Bay Tower, assets under management was $8.3b.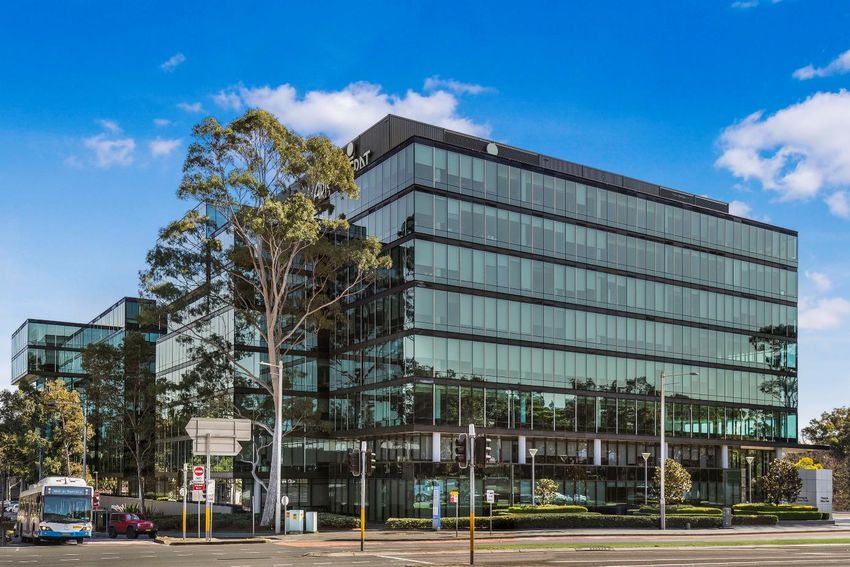
Key Highlights

  $51.6m                                              96.5%
  1Q 2021 distributable income                        High portfolio committed occupancy
  from operations(1)                                  as at 31 Mar 2021
  Up 22.0% y-o-y

  $270.0m                                             6.7 years
  Gross proceeds raised from the                      Long portfolio weighted average lease
  private placement(2) that was                       expiry (WALE) as at 31 Mar 2021
  approximately 4.6 times covered                     Top 10 tenants’ WALE was 11.8 years

                                                                                                                                     Keppel Bay Tower
  35.2%                                               Pinnacle Office Park                                                    Acquisition of Grade A office building in the
                                                                                                                               Keppel Bay waterfront precinct obtained
  Aggregate leverage as at 31 Mar 2021                Commencement of income contribution in
                                                      1Q 2021, after acquisition completion on                                  Unitholders’ approval at the EGM and
  Low all-in interest rate of 2.01% p.a.
                                                      31 Dec 2020                                                              is targeted to be completed in 2Q 2021

                  (1)   Includes advanced distribution of $32.2m (0.94 cents per Unit) for the period from 1 Jan 2021 to 28 Feb 2021 that was paid to eligible Unitholders on 31 Mar
                        2021, in connection with the private placement launched on 18 Feb 2021. Distribution for the period from 1 Mar 2021 to 30 Jun 2021, as well as any             4
                        distribution of capital gains for 1H 2021 will be disclosed at the 1H 2021 results announcement.
                  (2)   238.9m new Units were issued on 1 Mar 2021 pursuant to the private placement that was launched on 18 Feb 2021.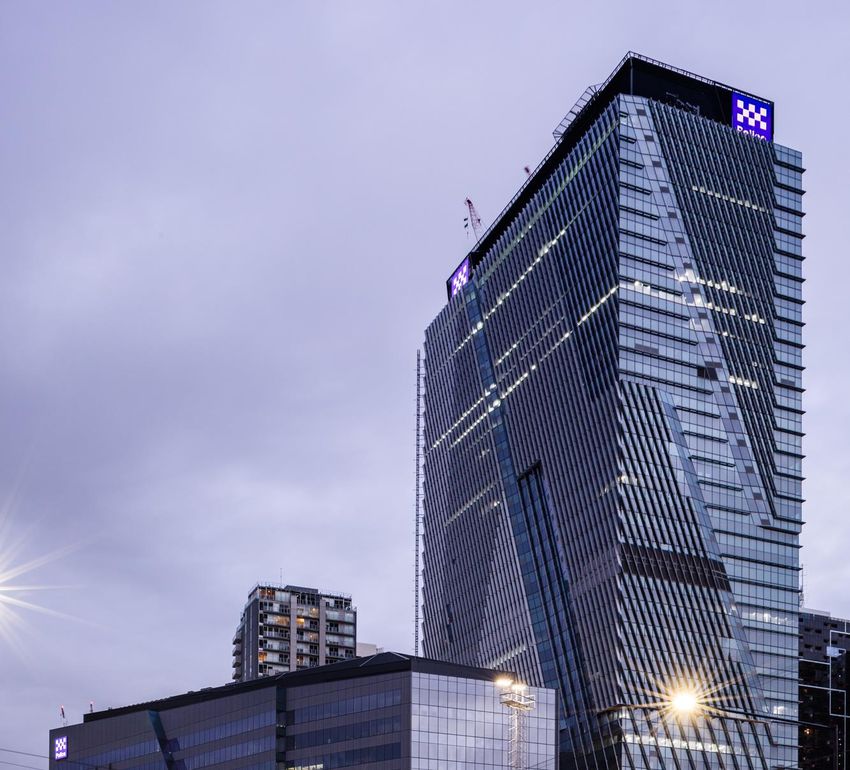
Financial &
Portfolio
Highlights

Pinnacle Office Park,
Sydney

                        5
Financial Performance
Achieved year-on-year growth in distributable income from operations due mainly to:
▪ Contributions from Victoria Police Centre and Pinnacle Office Park, higher one-off income as well as lower borrowing costs
▪ Offset by the impact of slightly lower portfolio occupancy

Distributable Income ($m)                                                                                                              1Q 2021                1Q 2020                     +/(-)
       Distributable Income
         from Operations                    Property Income(1)                                                                           $51.1m                 $38.7m               +32.0%
              +22.0%
                         51.6
      47.3
      5.0                                   Net Property Income (NPI)                                                                    $40.7m                $30.2m                +34.8%
                                             Less: Attributable to Non-controlling Interests                                             ($4.3m)               ($4.3m)                     -
                                            NPI Attributable to Unitholders                                                              $36.4m                $25.9m                +40.5%
                           51.6
      42.3
                                            Share of Results of Associates(2)                                                            $24.9m                 $19.0m               +31.1%

                                            Share of Results of Joint Ventures(3)                                                          $7.7m                  $6.9m              +11.6%
    1Q 2020              1Q 2021
                                            Distributable Income from Operations                                                      $51.6m(4)                 $42.3m               +22.0%
        From operations
        Capital gains distribution
                                            Capital Gains Distribution                                                                     N.a.(5)                $5.0m                  N.m.

 N.m. = Not meaningful
 (1) Property income relates to income from directly-held properties including Ocean Financial Centre, 50% interest in 275 George Street, 50% interest in 8 Exhibition Street office building
      and 100% interest in the three adjacent retail units, T Tower, Victoria Police Centre after it achieved practical completion on 9 Jul 2020, and Pinnacle Office Park after it was acquired
      on 31 Dec 2020.
 (2) Share of results of associates relates to Keppel REIT’s one-third interests in One Raffles Quay and Marina Bay Financial Centre.
 (3) Share of results of joint ventures relates to Keppel REIT’s 50% interests in 8 Chifley Square and David Malcolm Justice Centre.
 (4) Includes advanced distribution of $32.2m (0.94 cents per Unit) for the period from 1 Jan 2021 to 28 Feb 2021 that was paid to eligible Unitholders on 31 Mar 2021, in connection with         6
      the private placement launched on 18 Feb 2021. Distribution for the period from 1 Mar 2021 to 30 Jun 2021 will be disclosed at the 1H 2021 results announcement.
 (5) Any distribution of capital gains for 1H 2021 will be disclosed at the 1H 2021 results announcement.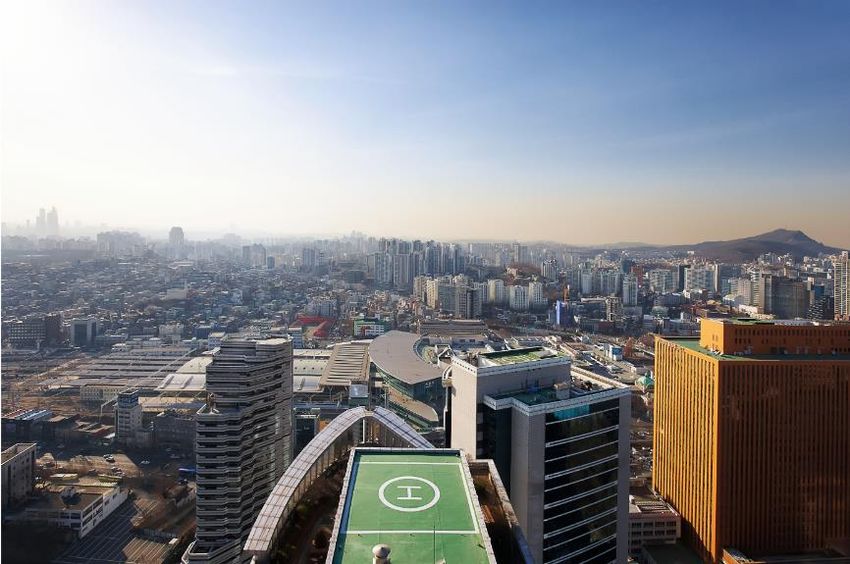
Prudent Capital Management
▪ All-in interest rate reduced year-on-year to 2.01% p.a. from 2.58% p.a.
▪ Successful private placement of 238.9m new Units to partially fund the acquisition of Keppel Bay Tower, as
  well as increase Keppel REIT’s free float and liquidity
▪ Green loans represented approximately 25% of Keppel REIT’s attributable share of total borrowings,
  including the additional A$50m green loan facility obtained in 1Q 2021
Debt Maturity Profile (As at 31 Mar 2021)                                                                                             As at 31 Mar 2021

                                                  32%                                              Adjusted NAV per Unit(2)                                                 $1.29
                                                  $200m            26%                             Interest Coverage Ratio(3)                                                3.7x
                                  21%              $75m
                                                                                                   All-in Interest Rate                                                  2.01% p.a.
                  11%                                             $775m
                  $50m            $621m           $691m
                                                                                    6%             Aggregate Leverage                                                      35.2%(4)
      4%
                  $267m                                                           $169m
    $129m (1)                                                                                      Weighted Average Term to Maturity                                      3.0 years
     2021         2022             2023            2024            2025            2026
     Bank loans                                $50m 7-year MTN at 3.15%                            Borrowings on Fixed Rates                                                 85%
                                               (Issued in Feb 2015)
                                               $200m 5-year convertible bonds at 1.9%
                                                                                                                                                                        $1,059m
     $75m 7-year MTN at 3.275%                                                                     Undrawn Credit Facilities
     (Issued in Apr 2017)                      (Issued in Apr 2019)                                                                                                ($592m committed)

                  (1)   Obtained loan facilities to refinance all outstanding loans in 2021 as at the date of announcement.
                  (2)   Excluded the distributable income for the period 1 Mar 2021 to 31 Mar 2021 to be paid in Aug 2021.
                  (3)   Computed as trailing 12 months EBITDA (excluding effects of any fair value changes of derivatives and investment properties, and foreign exchange translation),   7
                        over trailing 12 months interest expense, borrowing-related fees and distributions on hybrid securities.
                  (4)   Assuming the acquisition of Keppel Bay Tower was completed as at 31 Mar 2021, the aggregate leverage would have been 39.4%.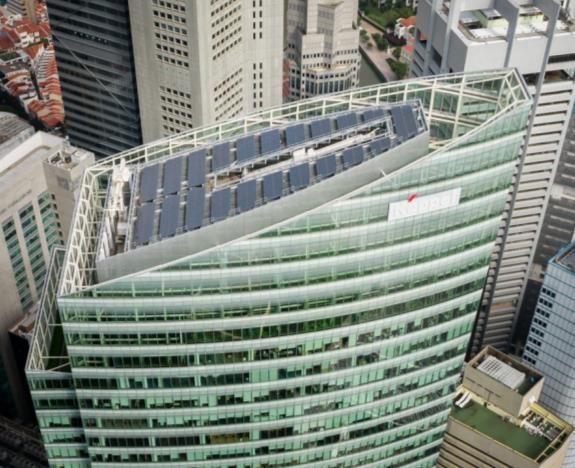
Managing the COVID-19 Situation
▪ Keppel REIT’s quality office portfolio and high-quality tenant profile continue to provide income stability
  and resilience

▪ More tenants have returned to their office premises since the Singapore Government announced the
  updated workplace safe management measures whereby working from home is no longer the default, and
  the limit on staff who can return to office has been raised from 50% to 75% with effect from 5 Apr 2021

▪ The Manager will continue to implement strict safe management measures and leverage technology at
  Keppel REIT’s properties to provide a safe and conducive work environment for building occupants

                                   (1)                         Outstanding rent deferrals
           Rental collection                                                                Tenant relief measures

           99%                                                 $1.2m                        Approx. $0.1m
           in 1Q 2021                                          as at 31 Mar 2021            granted in 1Q 2021

               (1) Rent deferrals are excluded from rental collection in 1Q 2021.                                    8
Grade A Portfolio with High Occupancy and Long WALE
                          $8.9 billion portfolio in key business districts of Singapore, Australia and South Korea
                                           enhances income diversification and long-term stability

                                                                                                            T Tower, Seoul
                                            8 Chifley Square,                                                99.4% Interest
                     Pinnacle Office
                                                 Sydney                                                     Occupancy: 98.6%
                      Park, Sydney                                               South Korea                                                    Ocean Financial
                       100% Interest           50% Interest
                                                                                     3.4%                                                           Centre
                     Occupancy: 90.0%        Occupancy: 100%
                                                                                                                                                 79.9% Interest
                                                                                                                                                Occupancy: 98.3%

  8 Exhibition Street,                                                                                                                                     Marina Bay
      Melbourne
      50% Interest                                                                                   Singapore                                          Financial Centre
                                                                                                                                                          33.3% Interest
    Occupancy: 96.0%

                                                                                                   77.4%
                                                                                                                                                         Occupancy: 97.3%

Victoria Police Centre,
                                       Australia
      Melbourne
     50% Interest
                                        19.2%
                                                                                                                                                    One Raffles Quay
   Occupancy: 100%                                                                                                                                    33.3% Interest
                                                                                                                                                     Occupancy: 94.0%
         275 George Street,                                David Malcolm
             Brisbane                                      Justice Centre,
            50% Interest                                        Perth                                                                       Keppel Bay Tower
          Occupancy: 90.6%                                   50% Interest                                                             (pending acquisition completion)
                                                           Occupancy: 100%                                                                     100% Interest
                                                                                                                                              Occupancy: 97.7%

                            Note: Information as of 31 Mar 2021 and assuming the inclusion of Keppel Bay Tower in Singapore which was announced on 23 Dec 2020           9
                            and targeted for acquisition completion in 2Q 2021. Excluding Keppel Bay Tower, assets under management was $8.3b.
1Q 2021 Leasing Update
                                                                                                                                New leasing demand and expansions from:
                                             Leases Committed                        Leases Committed
 Total Leases Committed                                                                                                 Banking, insurance and financial services        38.8%
                                              by Geography(1)                            by Type(1)
  ~309,800 sf                         Singapore,
                                                                                Renewal,
                                                                                                                        Manufacturing and distribution                   32.7%

 (Attributable ~146,800 sf)                                                      46.7%                                  Legal                                            10.8%
                                        98.6%
                                                                                                                        Energy, natural resources, shipping and marine    9.5%
     Retention Rate                                                                                         New,        Technology, media and telecommunications          6.2%
            44%                                                  Australia,
                                                                  1.4%
                                                                                                            53.3%
                                                                                                                        Government agency                                 1.7%

                                                                                                                        Retail and F&B                                    0.3%

Lease Expiries and Rent Reviews(1)                                                                                         ▪ Average signing rent for Singapore
                                                                                                                             office leases concluded in 1Q 2021
  Expiring Leases
                                                                                                      36.9%                  was $10.64(2) psf pm
  Rent Review Leases
                                                                                                                           ▪ Average expiring rents(3) of
                    16.4%
                                         12.5%               12.1%                                            13.6%          Singapore office leases (psf pm):
                                                                                 10.5%
  8.1%
         5.3%                                                                                                                $9.98 in 2021, $10.27 in 2022 and
                                                 0.2%                0.3%                  1.2%
                                                                                                                             $10.96 in 2023
     2021               2022                 2023                2024                 2025          2026 and beyond

                    (1) Based on committed attributable area.
                    (2) Based on a weighted average calculation. Simple average signing rent was $10.94 psf pm.                                                     10
                    (3) Weighted average based on attributable NLA of office lease expiries and reviews in Singapore.
Established and Diversified Tenant Base
▪ Keppel REIT has a diversified tenant ▪ Top 10 tenants take up 42.2% of NLA
base of 354(1) tenants, many of which are and contribute 37.3% of gross rent
established blue-chip corporations
Top 10 Tenants
Tenant Business Sector
State of Victoria 10.4%
Banking, insurance and financial services 32.0% DBS 5.5%
Government agency 16.3%
Technology, media and telecommunications 15.8% Aristocrat Technologies 4.5%
Legal 7.4% Government of
GOWA
Western Australia 4.4%
Energy, natural resources, shipping and marine 6.5% Victoria Police Centre
Real estate and property services 4.9% Standard Chartered 3.6% 8 Exhibition Street
Accounting and consultancy services 4.8% Marina Bay
Ernst & Young 3.4% Financial Centre
Services 4.6%
Pinnacle Office Park
Manufacturing and distribution 4.2% BNP Paribas 3.4%
David Malcolm
Retail and food & beverage 2.8% Telstra 2.8% Justice Centre
Others 0.7% One Raffles Quay
Drew & Napier 2.1%
Total 100% Ocean Financial Centre
ANZ 2.1% 275 George Street
Note: All data as at 31 Mar 2021 and based on portfolio committed NLA.
(1) Tenants with multiple leases were accounted as one tenant. 11Operating in the New Environment
Wellness Flexibility Technology
1m
Strong hygiene, air quality Incorporation of flexibility into office Robust IT infrastructure and smart
and safe management design and work arrangement building technology to support tenant
measures to enhance to facilitate collaboration and requirements, enhance workplace safety
well-being and safety increase resilience and optimise energy consumption
Keppel REIT will continue to optimise the portfolio and
calibrate its leasing strategy to meet tenants’ evolving
business needs
▪ Build a robust portfolio with strong operational excellence
which would be well sought after by tenants in view of health,
environmental and business continuity considerations
▪ Proactive tenant engagement to develop mutually beneficial
Ocean Financial Centre (pictured):
Singapore’s first commercial building to achieve the WELL Health-Safety
lease arrangements, as well as position Keppel REIT for the
rating by the International WELL Building Institute next leasing cycle
12Market
Review
T Tower,
Seoul
13Singapore Office Market
▪ Average core CBD Grade A office rents remained stable at $10.40 psf pm in 1Q 2021 while average
occupancy in core CBD increased slightly to 93.9%
Grade A Rent and Core CBD Occupancy Demand and Supply
2.1 1.9 1.7
1.3
94.8% 95.8% 93.8% 94.8% 95.8% 93.8% 93.9% 0.8 0.8 0.9 1.0
$15 100% 0.7 0.8 0.8
0.4 0.4 0.3
0.02 0.2
$12 $11.55 80%
$10.40 $10.80 $10.40 $10.40 2015 2016 2017 2018 2019 2020 2021 2022 2023 2024
$9.10 $9.40 (1) (1) (2)
Net Supply Net Demand Forecast Supply
$9 60%
Key Upcoming Supply in CBD(2) sf
$6 40%
Afro-Asia i-Mark 140,000
2021
CapitaSpring 635,000
$3 20%
Guoco Midtown 650,000
2022
Hub Synergy Point Redevelopment 131,200
$0 0%
Dec 2015 Dec 2016 Dec 2017 Dec 2018 Dec 2019 Dec 2020 Mar 2021 2023 Central Boulevard Towers 1,258,000
Average Grade A Rent ($ psf pm)
Keppel Towers Redevelopment 522,800
2024
Core CBD Average Occupancy (%) Shaw Towers Redevelopment 435,600
(1) Based on URA data on historical net demand and supply of office space in Downtown Core
Source: CBRE, 1Q 2021. and Rest of Central Area. Supply is calculated as net change of stock over the year and
may include office stock removed from market due to demolitions or change of use.
(2) Based on CBRE data on CBD Core and CBD Fringe.
14Australia Office Market
94.9% 96.0% 95.2% 94.0% 97.0% 98.2%
91.8% 91.3% 87.5% 87.5% 100% 90.1% 92.1% 86.2% 84.8% 100%
1,200 1,045 1,200 90%
964 1,032 80% 80%
Sydney CBD 900 799
930 915
60%
Melbourne CBD 900
70%
60%
679
503 538 573 546 542 50%
600 40% 600 448 40%
406
30%
Prime Grade occupancy
300 20% Prime Grade occupancy
300 20%
10%
was stable at 87.5% 0 0% was lower at 84.8% 0 0%
4Q15 4Q16 4Q17 4Q18 4Q19 4Q20 1Q21 4Q15 4Q16 4Q17 4Q18 4Q19 4Q20 1Q21
Prime Gross Effective Rent (AUD psm/year) Prime Gross Effective Rent (AUD psm/year)
Prime Grade Occupancy (%) Prime Grade Occupancy (%)
94.3% 94.3% 93.7% 93.6% 94.7% 89.6% 92.8% 91.5% 87.7% 87.9% 100%
89.6% 88.8% 100% 86.8% 86.0%
1,200
1,200 80%
80%
Macquarie Park 900 60%
Brisbane CBD 900 60%
600 409 407 40%
600 40% 397 389 386 396 396
344 367 391 378 385
305 321 300 20%
Prime Grade occupancy
300 20% Prime Grade occupancy
0 0%
was lower at 88.8% 0 0% was higher at 87.9% 4Q15 4Q16 4Q17 4Q18 4Q19 4Q20 1Q21
4Q15 4Q16 4Q17 4Q18 4Q19 4Q20 1Q21
Prime Gross Effective Rent (AUD psm/year)
Prime Gross Effective Rent (AUD psm/year)
Prime Grade Occupancy (%)
Prime Grade Occupancy (%)
84.0% 86.5% 84.3% 84.2% 100%
77.7% 81.4%
1,200 76.5%
80%
Perth CBD 900 60%
600 491 431 435 447 453 444 445 40%
Prime Grade occupancy
300 20%
was lower at 84.2% 0 0%
4Q15 4Q16 4Q17 4Q18 4Q19 4Q20 1Q21
Prime Gross Effective Rent (AUD psm/year)
Prime Grade Occupancy (%)
Source: JLL Research, 1Q 2021. 15Seoul Office Market
▪ CBD Grade A occupancy increased to 87.2% in 1Q 2021
CBD Grade A Rent and Occupancy
200,000 90.9% 100%
87.7% 85.3% 86.9% 86.9% 87.2%
83.1%
160,000 80%
120,000 60%
95,381 95,169 97,572 98,508
91,845 92,325 91,656
80,000 40%
40,000 20%
0 0%
4Q15 4Q16 4Q17 4Q18 4Q19 4Q20 1Q21
CBD Grade A Net Effective Rent (KRW per py pm) CBD Grade A Occupancy (%)
Source: JLL Research, 1Q 2021. 16Committed to Delivering Stable Income & Sustainable Returns
Portfolio Optimisation
• Portfolio optimisation to improve yield, while maintaining exposure to
Singapore CBD Portfolio
• Hold quality assets across different markets for improved income stability Optimisation
and to provide more long-term growth opportunities
Asset Performance Asset
Performance
• Drive individual asset performance with proactive leasing and
cost management strategies
• Implement initiatives to future proof assets and enhance sustainability
Capital
Efficiency
Capital Efficiency
• Optimise capital structure to reduce borrowing costs and improve returns
• Manage debt maturities and hedging profiles to reduce risk
17Additional
Information
One Raffles Quay,
Singapore
18Portfolio Information: Singapore
Keppel Bay Tower
As at Marina Bay
Ocean Financial Centre One Raffles Quay (Pending acquisition
31 Mar 2021 Financial Centre(4)
completion)
Attributable NLA 699,959 sf 1,023,412 sf 441,392 sf 386,600 sf
Ownership 79.9% 33.3% 33.3% 100.0%
BNP Paribas, DBS Bank, Deutsche Bank, Keppel Group,
Principal
ANZ, Standard Chartered Bank, Ernst & Young, BMW Asia,
tenants(1)
Drew & Napier Barclays TikTok Mondelez International
99 years expiring
99 years expiring 99 years expiring 99 years expiring
Tenure 10 Oct 2104(5) and
13 Dec 2110 12 Jun 2100 30 Sep 2096
7 Mar 2106(6)
Purchase Price S$1,426.8m(5)
S$1,838.6m(3) S$941.5m S$657.2m
(on acquisition) S$1,248.0m(6)
S$1,665.0m(5) S$665.0m(9)
Valuation(2) S$2,066.2m S$1,240.0m
S$1,277.3m(6) S$667.3m(10)
Capitalisation 3.45%(7); 4.25%(8); 3.65%(9)
3.50% 3.45%
rates 3.63%(6) 3.60%(10)
1) On committed gross rent basis.
2) Valuation as at 31 Dec 2020 based on Keppel REIT’s interest in the respective properties, except for Keppel Bay Tower which is pending acquisition completion.
3) Based on Keppel REIT’s 79.9% of the historical purchase price.
4) Comprises Marina Bay Financial Centre (MBFC) Towers 1, 2 and 3 and Marina Bay Link Mall (MBLM).
5) Refers to MBFC Towers 1 and 2 and MBLM.
6) Refers to MBFC Tower 3.
7) Refers to MBFC Towers 1 and 2.
8) Refers to MBLM.
9) Refers to the valuation as at 30 Nov 2020, carried out by JLL (commissioned by Trustee). Takes into account rental support of up to S$3.2m for vacant units and
leases that are expiring in the 18 months post-completion. Without rental support, valuation is S$664.0m. 19
10) Refers to the valuation as at 30 Nov 2020, carried out by Cushman & Wakefield (commissioned by Manager). Takes into account rental support of up to S$3.2m
for vacant units and leases that are expiring in the 18 months post-completion. Without rental support, valuation is S$665.0m.Portfolio Information: Australia & South Korea
As at 8 Exhibition Victoria Police David Malcolm
8 Chifley Square, Pinnacle Office 275 George T Tower,
31 Mar 2021 Street(3), Centre, Justice Centre,
Sydney Park, Sydney Street, Brisbane Seoul
Melbourne Melbourne Perth
Attributable
104,055 sf 378,164 sf 244,659 sf 364,180 sf 224,537 sf 167,784 sf 226,949 sf
NLA
Ownership 50.0% 100.0% 50.0% 50.0% 50.0% 50.0% 99.4%
Aristocrat Telstra, Minister for
Corrs Chambers Ernst & Young, Hankook
Technologies, Minister for Queensland Gas Works -
Principal Westgarth, Amazon, Minister Corporation, SK
Konica Minolta, Finance - State Company, Government of
tenants(1) Quantium, for Finance - Communications,
Coles of Victoria The State of Western
QBE Insurance State of Victoria Philips Korea
Supermarkets Queensland(6) Australia
99 years
99 years expiring
Tenure Freehold Freehold Freehold Freehold expiring Freehold
5 Apr 2105
30 Aug 2114
Purchase Price A$165.0m A$306.0m A$168.8m A$347.8m A$166.0m A$165.0m KRW252.6b
(on acquisition) S$197.8m S$289.9m S$201.3m(3) S$350.1m S$209.4m S$208.1m S$292.0m
A$234.5m A$306.1m A$259.5m A$385.0m A$245.0m A$232.5m KRW260.2b
Valuation(2)
S$231.5m S$302.1m S$256.2m(3) S$380.0m S$241.8m S$229.5m S$314.3m
Capitalisation
4.63% 5.25% 5.13%(4); 4.50%(5) 4.50% 5.25% 5.38% 4.25%
rates
1) On committed gross rent basis.
2) Valuation as at 31 Dec 2020 based on Keppel REIT’s interest in the respective properties and on the exchange rates of A$1 = S$0.9871 and KRW 1,000 = S$1.208.
3) Keppel REIT owns a 50% interest in the 8 Exhibition Street office building and a 100% interest in the three adjacent retail units.
4) Refers to Keppel REIT’s 50% interest in the office building.
5) Refers to Keppel REIT’s 100% interest in the three adjacent retail units. 20
6) Refers to the Department of Housing and Public Works – The State of Queensland.Thank You
For more information, please visit:
www.keppelreit.com
Connect with us on:
Victoria Police Centre,
Melbourne
21You can also read