2014-15 Debt Management Strategy Consultations - Bank of Canada
←
→
Page content transcription
If your browser does not render page correctly, please read the page content below
October 2013

2014–15 Debt Management Strategy Consultations

Overview
The Department of Finance and the Bank of Canada are seeking the views of government securities
distributors, institutional investors and other interested parties on issues related to the design and
operation of the Government of Canada’s domestic debt program for 2014–15 and beyond. Regular
consultations with market participants are an integral and valued part of the debt management process.
All market participants are encouraged to provide input and feedback.

The fundamental objective of debt management is to raise stable and low-cost funding to meet the
needs of the Government of Canada. An associated objective is to maintain a well-functioning market in
Government of Canada securities, which helps to keep debt costs low and stable, and is generally to the
benefit of a wide array of domestic market participants.

This year’s consultations are focused on obtaining views on the functioning of Government of Canada
treasury bill and bond markets, as well as on the terms governing Government of Canada securities
auctions. The consultations exercise also seeks to obtain greater insight into retail investor demand for
and access to wholesale Government of Canada securities.

A summary of comments received from market participants will be made available on the Bank of
Canada’s website concurrently with the release of the Debt Management Strategy for 2014–15.

Context
With a well-earned reputation for responsible fiscal, economic and financial sector management,
Canada is one of only seven sovereigns bearing an uncontested AAA rating from all the major credit-
rating agencies. On 28 June 2013, the International Monetary Fund’s Currency Composition of Official
Foreign Exchange Reserves began reporting on central bank holdings denominated in Canadian dollars,
reflecting the growing importance of Canadian-dollar holdings in the world economy.

Non‐residents now hold about 28 per cent of Government of Canada marketable debt securities,
approximately double the average for the five years preceding the financial crisis. Increased demand for
Government of Canada securities by non-residents helps to diversify the investor base. At the same
time, some market participants suggest that the growing share of securities held by foreign institutional
investors, in particular, central banks and sovereign wealth funds, may be affecting the liquidity of
certain sectors of the Government of Canada securities market, since some of these investors may not
actively lend their securities in the repo market. Anecdotal evidence gathered by the Bank of Canada
suggests that large increases in foreign official Canadian-dollar holdings have coincided with the more
2014–15 Debt Management Strategy Consultations            October 2013 |   2

frequent “specials” in the Canadian debt markets. 1 More research is necessary, however, to determine
to what extent this relationship is causal and not explained by other factors.

Demand for Government of Canada securities is being affected by several other important factors.
Regulatory initiatives are increasing the need for high-quality collateral, which in Canada is reflected in
greater demand for treasury bills and short-term bonds. In addition, the federal government and a
number of provincial governments, as well as some corporations have put in place new prudential
liquidity and contingency measures that have large, stable allocations to Government of Canada
securities, especially treasury bills and short-term bonds. Structural changes, such as Canada’s new
central counterparty for the fixed-income market and, in particular, the introduction of central clearing
for blind repo trades for interdealer brokers, may also be influencing dynamics in the repo market. 2

With the government projecting to return to a balanced budget by 2015–16 and beyond, the net new
supply of Government of Canada securities will continue to decline over the medium term. For 2013–14,
the net issuance of domestic marketable bonds is planned to be approximately $87 billion, down from
$94 billion in 2012–13. The stock of treasury bills is projected to decline from $181 billion at the start of
2013–14 to about $135 billion by the end of 2014–15.

Within this context, input received during these consultations will help federal debt managers to ensure
that the debt strategy and the debt-distribution framework strike a prudent balance between costs and
risks, while remaining appropriate and responsive to changing circumstances.

Bond Program
1. To what degree is the increased frequency of bonds trading “on special” viewed as structural? How
   do you see this trend evolving, and how does this trend affect the well-functioning of Government
   of Canada bond markets? Aside from the increasing non-resident investment in Government of
   Canada securities, are there any other factors that have led to the increased frequency of bonds
   trading “on special” in the repo market?

2. In the Debt Management Strategy for 2013–14, the government announced the continuation of the
   temporary increase in the issuance of 10- and 30-year bonds and signalled that it would be assessing
   the potential benefits of issuing bonds with a maturity of 40 years or longer.

       How would you characterize the demand for long-term bonds since yields began rising in May 2013
       and how do you see it evolving?

3. What additional views do you have on the liquidity and functioning of the Government of Canada
   bond market across the various maturity sectors?

1
 A security that is “on special” is an asset that is subject to elevated demand in the repo market. This causes securities
borrowers in the repo market to compete for the asset by offering to lend cash below prevailing interest rates.
2
    In a blind repo trade, the buyer and seller remain anonymous.
2014–15 Debt Management Strategy Consultations October 2013 | 3
Treasury Bill Program
The stock of treasury bills will decline materially through to the end of 2014–15 to accommodate large
cash inflows related to asset maturities under the Insured Mortgage Purchase Program. As a result, the
size of biweekly treasury bill auctions will drop to a range of about $10 billion to $12 billion (Chart 1).
Chart 1: Stock of treasury bills and size of treasury bill biweekly auctions *
($ billions) Treasury bill bi-weekly auction size (LHS) Treasury bill stock (RHS) ($ billions)
20 220
Projection
18 200
16 180
14 160
12 140
10 120
8 100
6 80
May-07
Sep-07
May-08
Sep-08
May-09
Sep-09
May-10
Sep-10
May-11
Sep-11
May-12
Sep-12
May-13
Sep-13
May-14
Sep-14
Nov-07
Nov-08
Nov-09
Nov-10
Nov-11
Nov-12
Nov-13
Nov-14
Jul-07
Jan-08
Mar-08
Jul-08
Jan-09
Mar-09
Jul-09
Jan-10
Mar-10
Jul-10
Jan-11
Mar-11
Jul-11
Jan-12
Mar-12
Jul-12
Jan-13
Mar-13
Jul-13
Jan-14
Mar-14
Jul-14
Jan-15
Mar-15
*Projections included in the chart are for the purposes of illustration only, since they contain data and assumptions that are
subject to change. Note that the projections do not reflect the fall 2013 update of economic and fiscal projections.
4. During periods of high volatility in cash balances, as are expected until the end of 2014–15, the
ability to adjust the size of treasury bill auctions from one operation to the next can be an effective
cash-management tool for the government.
How would you characterize the market’s ability to absorb variations in the size of treasury bill
auctions? Is the amount of acceptable variation dependent on the absolute amount auctioned, the
amount coming to maturity or the amount of stock outstanding? Would the amount of acceptable
variation differ across the three treasury bill maturity terms (i.e., 3-, 6-, and 12-month terms)?
5. Cash-management bills (CMBs) are used to raise cash balances on short notice before large
payments are due, thereby reducing the cost and risk of holding large cash balances. Cash-
management bills are being issued more heavily, given the increasing volatility in cash balances. The2014–15 Debt Management Strategy Consultations October 2013 | 4
average size and term to maturity of CMBs in 2012–13 was $2.4 billion and 20 days, respectively,
while for 2013–14, they are currently $2.5 billion and 29 days.
What are your views on the increased use of CMBs?
Terms Governing Government of Canada Securities Auctions
The debt-distribution framework, which includes the rules for Government of Canada securities
auctions, is designed to ensure that the government can consistently sell its securities at the best
possible price. It is also designed to support the well‐functioning of the government securities market by
promoting the participation of dealers and investors.
The terms governing Government of Canada securities auctions (the “Terms”) must balance a variety of
interests: the government’s own interest in achieving low funding costs on a consistent basis; the
interest of securities dealers in accessing government securities and maintaining an awareness of
trading flows; and investors’ interest in having access to government securities at fair and transparent
prices. 3
Developments in global capital markets are prompting a review of the Terms to ensure that they remain
relevant and appropriate. These developments include diminishing margins on secondary trading for
dealers, changes in the regulatory landscape that may affect the capacity of financial institutions to
warehouse bond positions, greater price transparency and liquidity arising from electronic trading
platforms, and the increasing sophistication of institutional investors.
Input and feedback on the following elements of the Terms are being sought: eligibility criteria;
minimum bidding requirements; maximum bidding limits; the price range for the submission of bids at
auctions; non-competitive bidding; and reporting requirements.
Eligibility criteria
Eligibility criteria for government securities distributor (GSD) status include a demonstrated capacity to
trade in the domestic fixed-income market, the ability to submit bids and settle at auctions, membership
in the Investment Industry Regulatory Organization of Canada (IIROC), having core domestic fixed-
income market trading and sales operations for Government of Canada securities residing in Canada and
an agreement to submit weekly statistical reports on domestic fixed-income trading activities to IIROC
and the Bank of Canada.
To be designated a primary dealer (PD), an entity must, in addition to meeting all GSD eligibility
requirements, provide evidence of sufficient resources, have the desire to participate actively in market-
making for Government of Canada securities and maintain a bidding limit of at least 10 per cent.
3
The terms of participation in auctions for government securities distributors and customers, and the standard terms for
auctions of treasury bills, nominal bonds and Real Return Bonds can be found on the Bank of Canada’s website at
www.bankofcanada.ca/markets/government-securities-auctions/.2014–15 Debt Management Strategy Consultations October 2013 | 5
There are currently 11 PDs for treasury bills, 12 PDs for bonds and 7 non-PD GSDs (Box 1).
Box 1: Primary dealers and non-primary dealer government securities distributors
Primary dealers for treasury bills Primary dealers for bonds
Bank of Montreal BMO Nesbitt Burns Inc.
Canadian Imperial Bank of Commerce Casgrain & Company Limited
Desjardins Securities Inc. CIBC World Markets Inc.
Deutsche Bank Securities Limited Desjardins Securities Inc.
HSBC Bank Canada Deutsche Bank Securities Limited
Laurentian Bank Securities Inc. HSBC Securities (Canada) Inc.
Merrill Lynch Canada Inc. Merrill Lynch Canada Inc.
National Bank Financial Inc. Laurentian Bank Securities Inc.
RBC Dominion Securities Inc. National Bank Financial Inc.
Scotia Capital Inc. RBC Dominion Securities Inc.
The Toronto-Dominion Bank Scotia Capital Inc.
The Toronto-Dominion Bank
Non-primary dealer government securities distributors
Beacon Securities Limited Ocean Securities Inc
Canaccord Genuity Corp. Odlum Brown Limited
CTI Capital Securities Inc. PI Financial Corp
Morgan Stanley Canada Limited
Customers are required to obtain a unique bidder identification number (BIN) before they can bid
competitively and must submit their bids through a GSD. Under the current framework, the customer
category is not intended for entities that purchase securities at auctions for distribution (i.e., acting as a
dealer). There are approximately 100 customers with BINs, of which 34 are regular participants in
auctions.
6. What are your views on the appropriateness of eligibility requirements for GSDs, PDs and customers
for participation in securities auctions? How might changes to the residency requirements for PDs
affect the structure of the domestic fixed-income market?
Minimum bidding requirements
A GSD must submit at least one winning competitive or non-competitive bid on its own behalf or on
behalf of customers every six months. Since the minimum bid size is $100,000, a GSD needs to win only
$200,000 per year at auction to maintain its status. A PD must submit bids for at least 50 per cent of its2014–15 Debt Management Strategy Consultations October 2013 | 6
auction limit or formula calculation at no more than 10 basis points above the highest yield accepted
(cut-off rate). 4 Customer BINs may be deactivated if they have been inactive for longer than one year.
PDs are the largest and most active group of participants in the primary market for Government of
Canada securities (Table 1). There is a blurring of the lines, however, between participant categories,
with some customers being far more actively engaged in auctions than some GSDs, and, in certain cases,
than small PDs. In fact, the customer allotment of Real Return Bonds (RRBs) surpasses that of PDs.
Table 1: Share of allocations at auctions by participant and sector, 2012–13 (%)
Large Medium Small Non-PD Bank of
Sector Customers
PDs PDs PDs GSDs Canada
Treasury bills
3-month 51 18 4 1 16 9
6-month 41 11 7 2 26 13
12-month 44 11 3 5 25 13
Total 47 15 4 2 20 11
Nominal bonds
2-year 32 22 8 2 17 20
3-year 35 21 9 1 13 20
5-year 33 22 12 2 11 20
10-year 35 25 11 2 6 20
30-year 44 13 10 2 11 20
Total 34 22 10 2 13 20
Real Return Bonds 19 9 8 0 64 0
7. Minimum bidding requirements for PDs are fairly light, making the category accessible to small
participants. The primary market share of the smallest PD, for example, is less than 2 per cent.
Smaller PDs have been observed to submit frequent and regular “throwaway bids” at auctions
simply to meet their minimum bidding requirements.
What are your views on changing the minimum bidding requirements for PDs to minimum winning
requirements? What would constitute a fair minimum winning requirement for a PD? Would these
minimum winning requirements be applied to each auction or sector, and/or could they cover a
certain time period (e.g., minimum winning bids of X per cent over the previous quarter)?
8. Participation at auctions by most non-PD GSDs is generally very low. Should consideration be given
to reserving this category for those entities aspiring to become PDs? What is a reasonable time limit
4
Bids are deemed reasonable for RRB auctions if the bid yield is no more than 10 basis points above the higher of the cut-off
yield of the auction or the yield in the secondary market prior to the auction.2014–15 Debt Management Strategy Consultations October 2013 | 7
to allow an entity to build its business to the point where it could apply for full PD status? Should
certain eligibility requirements (e.g., residency) be relaxed for this trial period?
9. What challenges do Government of Canada securities dealers face in trying to achieve the level of
participation necessary to acquire or maintain GSD or PD status?
Maximum bidding limits
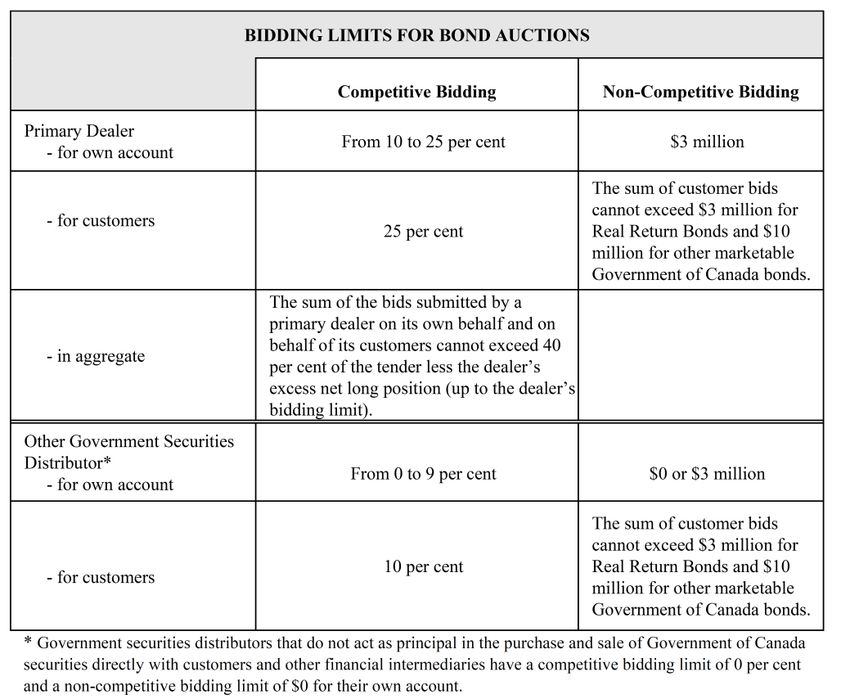
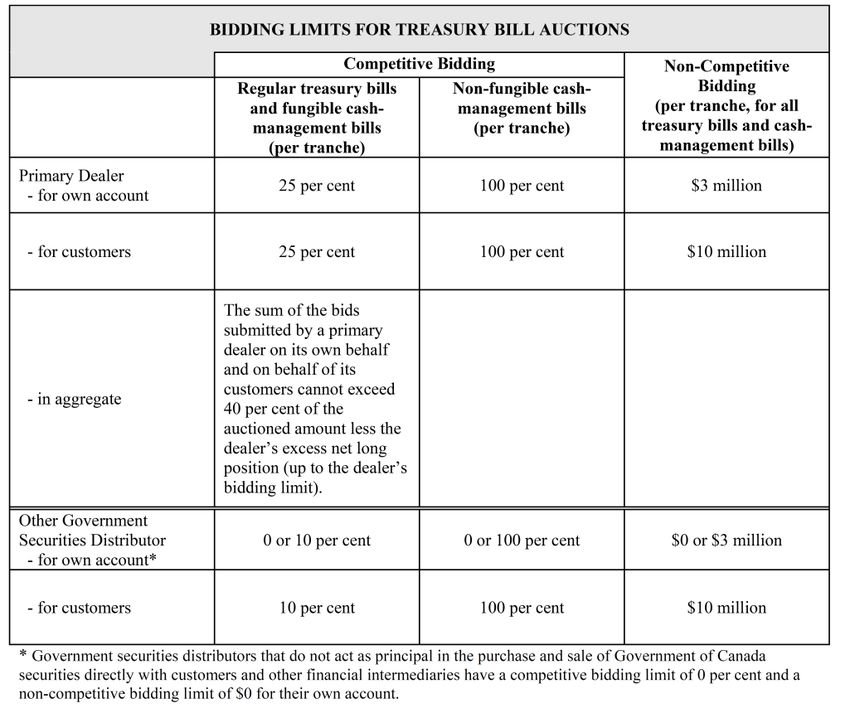
Maximum bidding limits for PDs are tiered from 10 to 25 per cent of the auctioned amount for bids on
their own account plus an additional limit of 25 per cent of the tender for bids on behalf of customers.
The sum of the bids submitted by a PD on its own behalf and on behalf of its customers cannot exceed
40 per cent of the tender less the dealer’s excess net long position (Appendix 1 and Appendix 2). As the
Terms are currently designed, customers are able to bid for more securities than non-PD GSDs.
10. How appropriate are the maximum bidding limits for PDs, non-PD GSDs and customers?
11. In what manner should maximum bidding limits differ across sectors (e.g., RRB auctions)?
Price range for submission of bids at auctions
The acceptable price range for the submission of bids at auctions has been adjusted periodically. For
example, the acceptable price range was increased from the cut-off rate plus 5 basis points to plus
10 basis points in 2005 and was temporarily increased to plus 15 basis points for treasury bills and plus
20 basis points for bonds from October 2008 to April 2010.
In 2012–13, over 90 per cent of the bids at auctions for treasury bills and nominal bonds were below the
cut-off rate plus 4 basis points, while 90 per cent of the bids for RRBs were below the cut-off rate plus 10
basis points (Chart 2).
While bids submitted during the financial crisis had a wider distribution (as indicated by the dashed
black lines in Chart 2), the price range for submission of bids at auctions in 2009 does not appear to have
been necessary, since participants were clearly able to bid successfully in auctions at well under the cut-
off rate plus 10 basis points. Low liquidity and the niche market demand for RRBs may result in some
market participants having challenges in submitting bids for these securities at auctions. Moreover, RRB
auctions are held in a single-price format, which further explains the larger bid dispersion for these
operations.
12. What are your views on the acceptable price range for the submission of bids at auctions for
treasury bills, nominal bonds and RRBs?
13. If the Terms were amended to require that PDs win a certain minimum primary market share, how
would that affect the acceptable price range?2014–15 Debt Management Strategy Consultations October 2013 | 8
Chart 2: Bid-yield dispersion around the cut-off rate (2009 versus 2012–13)
Treasury bills Nominal bonds
Distribution 2009 2012–13
50% Distribution 2009 2012–13
50%
40%
40%
30%
30%
20%
20%
10%
10%
0%
-6 -5 -4 -3 -2 -1 0 1 2 3 4 5 6 7 8 9 10 0%
Basis points from cutoff -6 -5 -4 -3 -2 -1 0 1 2 3 4 5 6 7 8 9 10
Basis points from cutoff
Real Return Bonds
Distribution 2009 2012–13
12%
10%
8%
6%
4%
2%
0%
-6 -5 -4 -3 -2 -1 0 1 2 3 4 5 6 7 8 9 10
Basis points from cutoff2014–15 Debt Management Strategy Consultations October 2013 | 9
Non-competitive bidding
The current Terms include an optional non-competitive allocation for PDs, non-PD GSDs and customers
that permit these entities to purchase securities at the average yield of the accepted bids of an auction.
For PDs and non-PD GSDs, the non-competitive bidding limit is capped at $3 million for their own
account and at $10 million for customers ($3 million for RRBs). Each customer’s non-competitive bid is
capped at $5 million ($3 million for RRBs).
Auction statistics reveal that many PDs and non-PD GSDs take full advantage of the non-competitive
bidding allocation despite having the ability (and market intelligence) to purchase the securities at lower
cost through competitive bidding, and the relatively small size of the allocation. Theoretically, non-
competitive bidding should be most useful for small customers that have limited pricing information,
since it is a risk-mitigation tool.
14. What value does your institution place on having access to a non-competitive allocation?
Reporting requirements
Auction net position reporting requirements were introduced in 1998 as one of several initiatives to
support the integrity of the Government of Canada’s debt-distribution framework. Since that time, the
net position reporting requirements have been reviewed periodically, but no material changes have
been made.
Under the current net position reporting requirements, GSDs must report their aggregate net position in
the auctioned security when submitting their own bids or bids on behalf of customers (customers must
submit their net positions either directly or through a GSD that is submitting a bid on their behalf). A
GSD or customer must resubmit its auction net position if the position changes by more than $25 million
before the auction deadline. The net position for a security includes when-issued positions, security-
specific futures contracts and other categories that are outlined in the Terms.
15. What are your views on the existing auction net position reporting framework and how could it be
improved?2014–15 Debt Management Strategy Consultations October 2013 | 10
Retail Investor Access to Government of Canada Securities
Fixed-income products in Canada are typically traded over the counter (OTC), whereas equities are
traded on public exchanges. Many financial institutions, institutional investors and wealth managers
participate in electronic marketplaces to facilitate the trading of fixed-income securities. However, for
retail investors, acquiring a position in fixed-income securities often involves buying money market and
bond mutual funds or exchange-traded funds (ETFs). Wealth managers offer another avenue for retail
investors to acquire fixed-income securities by leveraging institutional buying of fixed-income securities.
Retail investors that prefer not to pay the asset-management fees associated with mutual funds, ETFs
and wealth managers can buy and sell fixed-income securities through an online or discount brokerage
account. However, the relative opaqueness of the OTC market has led to criticism of broker
compensation, transaction fees and the cost of trading from one’s own broker account.
Changes implemented by the Canadian Securities Administrators to National Instrument 31-103
Registration Requirements, Exemptions and Ongoing Registrant Obligations 5 seek to enhance
registrants’ relationships with their clients (retail investors) through an expansion of cost and registrant
compensation disclosure, as well as the introduction of performance reporting.
16. Of those retail investors with an online or discount brokerage account, what proportion use their
account to buy fixed-income securities in general and Government of Canada securities specifically?
17. What are your views on the impact of the additional fee, commission and cost transparency
required under National Instrument 31-103 for dealer and broker activities? Will these changes help
to promote greater price transparency for retail investors?
18. What measures could the Government of Canada take to facilitate easier retail investor access to its
debt securities?
5
Available at http://www.osc.gov.on.ca/documents/en/Securities-Category3/rule_20090717_31-103_national-instrument.pdf.2014–15 Debt Management Strategy Consultations October 2013 | 11
Appendix 1
Maximum bidding limits for treasury bill auctions2014–15 Debt Management Strategy Consultations October 2013 | 12
Appendix 2
Maximum bidding limits for bond auctions2014–15 Debt Management Strategy Consultations October 2013 | 13
Appendix 3
BOND PORTFOLIO
Term to Outstanding Net of
Maturity Issuance Repurchased (CAD Repurchased
(years) Bond Sector Millions) (CAD Millions)
0.1 1.5% Nov 2013 2Y 7,954 3,546
0.3 1% Feb 2014 2Y 9,417 1,697
0.4 2% March 2014 3Y 7,992 1,608
0.5 10.25% March 2014 25Y 710 2,440
0.6 0.75% May 2014 2Y 7,974 2,893
0.7 3% June 2014 5Y 8,792 7,208
0.7 5% June 2014 10Y 7,702 3,166
0.8 2.25% Aug 2014 2Y 11,641 3,959
1.1 1% Nov 2014 2Y 9,900 0
1.2 2% Dec 2014 5Y 14,775 225
1.3 1% Feb 2015 2Y 15,600 0
1.6 1% May 2015 2Y 9,900 0
1.7 2.5% June 2015 5Y 9,000 0
1.7 4.5% June 2015 10Y 10,143 157
1.7 11.25% June 2015 25Y 457 1,893
1.8 1.5% Aug 2015 2Y 15,300 0
2.1 1% Nov 2015 2Y 9,900 0
2.2 3% Dec 2015 5Y 11,342 0
2.3 1.25% Feb 2016 3Y 8,100 0
2.7 2% June 2016 5Y 9,900 0
2.7 4% June 2016 10Y 10,157 143
2.8 1% Aug 2016 3Y 8,100 0
2.9 2.75% Sept 2016 5Y 10,500 0
3.4 1.5% March 2017 5Y 10,500 0
3.7 4% June 2017 10Y 10,343 0
3.9 1.5% Sept 2017 5Y 10,200 0
4.4 1.25% March 2018 5Y 10,200 0
4.7 4.25% June 2018 10Y 10,623 0
4.9 1.25% Sept 2018 5Y 10,200 0
5.7 3.75% June 2019 10Y 17,650 0
6.7 3.5% June 2020 10Y 13,100 0
7.5 10.5% March 2021 30Y 567 1,233
7.7 3.25% June 2021 10Y 11,500 0
7.7 9.75% June 2021 30Y 286 4,364
8.2 4.25% Dec 2021 RRB 5,175 0
8.7 2.75% June 2022 10Y 12,700 0
8.7 9.25% June 2022 30Y 206 2,344
9.7 1.5% June 2023 10Y 14,200 0
9.7 8% June 2023 30Y 2,359 5,841
10.7 2.5% June 2024 10Y 5,600 0
11.7 9% June 2025 30Y 2,303 6,597
13.2 4.25% Dec 2026 RRB 5,250 0
13.7 8% June 2027 30Y 4,430 5,170
15.7 5.75% June 2029 30Y 11,452 2,448
18.2 4% Dec 2031 RRB 5,800 0
19.7 5.75% June 2033 30Y 13,003 407
23.2 3% Dec 2036 RRB 5,850 0
23.7 5% June 2037 30Y 13,924 75
27.7 4% June 2041 30Y 15,800 0
28.2 2% Dec 2041 RRB 6,550 0
31.2 1.5% Dec 2044 RRB 7,700 0
32.2 3.5% Dec 2045 30Y 13,200 0
1 Benchmark Building to Benchmark
RRB numb ers do not include inflation adjustment
Source: Bloomb erg as of 27 Septemb er 2013You can also read