2018 SUSTAINABILITY REPORT - AES Corporation
←
→
Page content transcription
If your browser does not render page correctly, please read the page content below
2018 SUSTAINABILITY REPORT
2018 SUSTAINABILITY REPORT

                                                                                                                                    CONTENTS
                             ORGANIZATIONAL PROFILE .........................................................................4
                             MATERIAL ASPECTS HIGHLIGHTED IN THIS REPORT ....................................5
                             FINANCIAL EXCELLENCE ..............................................................................6
                             Economic Performance and Investment Return on Capital Allocation ........................................ 6
                             OPERATIONAL EXCELLENCE.........................................................................8
                             Availability, reliability and access to electricity ................................................................................ 8
                                Generation .................................................................................................................................... 9
                                Distribution ..................................................................................................................................11
                                Customer Satisfaction................................................................................................................ 13
                                Energy Storage ........................................................................................................................... 14
                             Cybersecurity ..........................................................................................................................................15
                             Disaster/Emergency Planning and Response ................................................................................... 18
                             ENVIRONMENTAL PERFORMANCE ............................................................20
                                 2018 environmental goals ......................................................................................................... 21
                             Air emissions........................................................................................................................................... 22
                                 Climate Scenario Report ............................................................................................................ 22
                                 Direct Greenhouse Gas Emissions ............................................................................................. 23
                                 Direct SO2, NOx, and Other Emissions .................................................................................... 24
                                 Indirect GHG Emissions.............................................................................................................. 25
                                 Reduction of air emissions— Energy efficiency for our customers .......................................... 25
                             ASPECT: Water ....................................................................................................................................... 26
                                 Risk Management ....................................................................................................................... 27
                                 Water Withdrawal and Discharge ............................................................................................. 27
                             ASPECT: Effluents and Byproducts .................................................................................................... 28
                                 Coal Combustion Products Generation & Recycling .............................................................. 29
                                 Spills & Environmental Incidents ..............................................................................................30
                             ASPECT: Biodiversity ............................................................................................................................. 30
                                 Protecting biodiversity and restoring habitats ......................................................................... 31
                             STAKEHOLDER ENGAGEMENT ...................................................................34
                             Stakeholders ........................................................................................................................................... 35
                             Impacts on education and living standards in our communities ................................................. 38
                             Public Safety ........................................................................................................................................... 41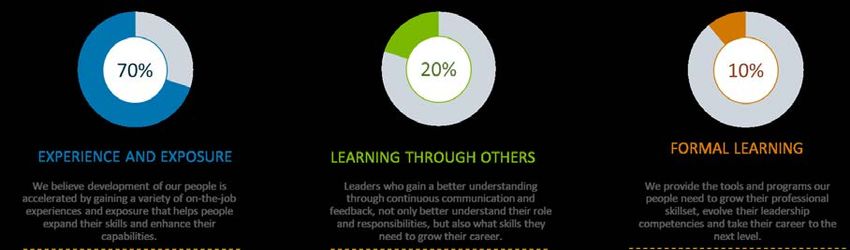
2018 SUSTAINABILITY REPORT

                             OUR PEOPLE .............................................................................................43
                                Continually Improving How We Work to Succeed and Better Serve Our People.................. 44
                             Global Talent Management................................................................................................................. 45
                                ACE Academy for Talent Development ................................................................................... 46
                                Assessments and Career Planning ............................................................................................ 46
                                Experience and Exposure .......................................................................................................... 46
                                Global Diversity and Inclusion Program ...................................................................................47
                                Rewarding Our People .............................................................................................................. 49
                                Culture and Branding ................................................................................................................ 49
                                AES Performance Excellence: Improving lives by improving the business.............................. 51
                             Occupational Health and Safety ........................................................................................................ 52
                                2018 Global Safety Goals .......................................................................................................... 53
                                Reactive Safety Performance .................................................................................................... 53
                                Proactive Safety Performance ................................................................................................... 55
                                Safety Training, Committees and Recognition .........................................................................56
                                Health and Wellness Management ...........................................................................................58
                             INDEX OF TABLES AND FIGURES ................................................................59

                                                                                                                                                                            3
                                                                                                                                                                            Page
2018 SUSTAINABILITY REPORT
ORGANIZATIONAL PROFILE
The AES Corporation (NYSE: AES) is a Fortune 200 global power company founded in 1981. The company’s
headquarters are in Arlington, Virginia, United States (US). AES is publicly traded company, incorporated in
Delaware and governed by a Board of Directors.
Our vision is to be the world's leading sustainable power company by leveraging our unique electricity platforms
and the knowledge of our people to provide the energy and infrastructure solutions our customers truly need.
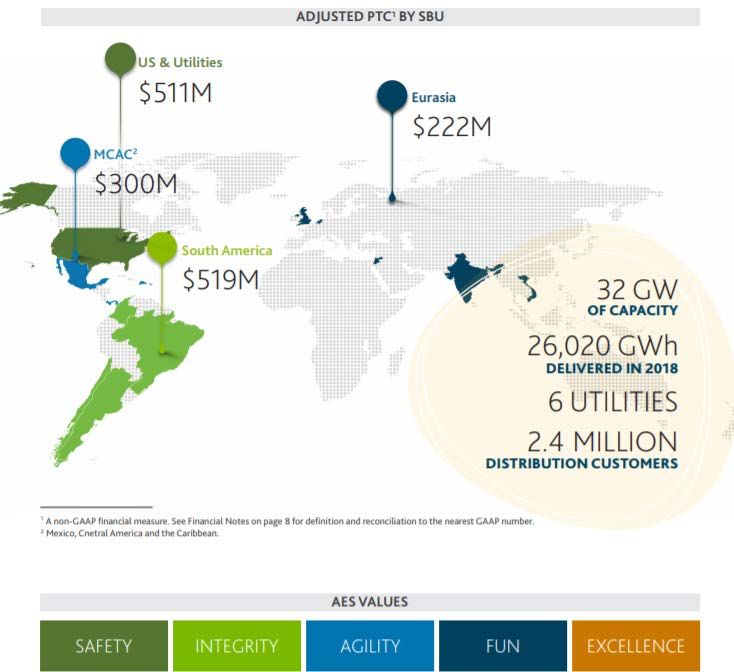
We are organized into four market-oriented strategic business units (SBUs). Within our four SBUs, we have two
lines of business. The first business line is generation, where we own and/or operate power plants to generate
and sell power to customers, such as utilities, industrial users, and other intermediaries.
The second business line is utilities, where we own and/or operate utilities to generate or purchase, distribute,
transmit and sell electricity to end-user customers in the residential, commercial, industrial and governmental
sectors within a defined service area. In certain circumstances, our utilities also generate and sell electricity on
the wholesale market. We are a leader in lithium-ion, battery-based energy storage, with approximately 400
MW in operation, under construction or in advanced development across seven countries.
Back to Table of Contents
4 Page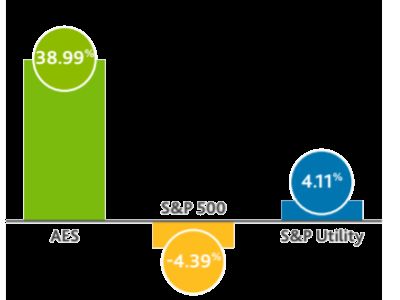
2018 SUSTAINABILITY REPORT

                             MATERIAL ASPECTS HIGHLIGHTED
                                            IN THIS REPORT
      This report is structured to present the following “material aspects” within the context of our five broad strategic
      initiatives.

      FINANCIAL EXCELLENCE
               Economic Performance
            Investment Return on Capital Allocation
      OPERATIONAL EXCELLENCE
               Availability, Reliability and Access to Electricity
               Cybersecurity
            Disaster/Emergency Planning and Response
      ENVIRONMENTAL PERFORMANCE
               Air Emissions
               Water
               Effluents and Byproducts
            Biodiversity
      STAKEHOLDER ENGAGEMENT
               Impacts on Education and Living Standards in Our Communities
            Public Safety
      OUR PEOPLE
               Global Talent Management
               Occupational Health and Safety

                                                                                                                                    Back to Table of Contents

      This is the 2018 Sustainability Report. Information contained in this report focuses on the company’s operations and
      performance in 2018. The report has been prepared in accordance with the recommendations of the Global Reporting
      Initiative Standards and includes Electric Utility Sector Disclosures. Other Specific Standard Disclosures are addressed in
      the “2018 AES Sustainability Report Supplement 2018”.
                                                                                                                                    5        Page
2018 SUSTAINABILITY REPORT
FINANCIAL EXCELLENCE
We manage our financial performance in line with our corporate strategy set by our CEO and Executive
Leadership Team and approved by our Board of Directors. We have selected the Standard and Poor's (S&P) 500
Utilities Index as our peer group index to compare our performance.
As we strive to create long-term shareholder value by providing safe and reliable electricity related services,
financial success enables us to continue to attract capital and talented people as well as to invest in new projects
and innovative solutions for our customers. Our knowledge of the markets where we operate puts us in a
position to take advantage of growth opportunities or quickly respond to changing conditions.
We operate our portfolio to generate capital for growth investments, create value for our shareholders, manage
debt repayment, and deliver shareholder dividends. We have an investment decision-making process in place to
ensure our investment opportunities align with management objectives. In alignment with this process and our
overall strategy, we are focusing our growth on platform expansions in markets where we already operate and
have a competitive advantage to realize attractive risk-adjusted returns.
Another important element of our governance and financial management is the anticipation, identification and
management of risks. The risk identification process is integrated within the company through an Enterprise Risk
Management program and risks are managed both at the corporate and SBU levels. Further details on
risk management are available on our website and also our 2018 AES Annual Report discloses information on
the different risks that could have an impact on the performance of the company.
Economic Performance and Investment Return on
Capital Allocation
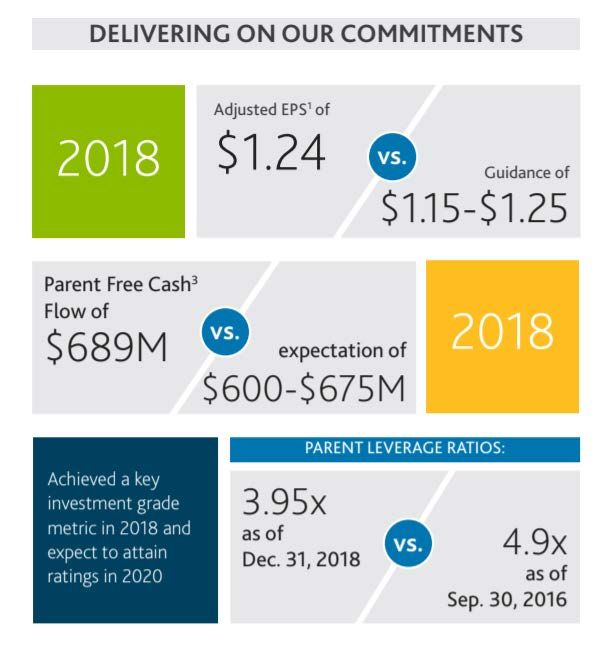
Our overarching goal is to deliver sustainable and attractive risk-adjusted total returns to our shareholders. In
2018, we delivered on all of our commitments, including achieving our financial guidance, hitting key milestones
on our strategy and positioning AES for long-term, sustainable growth. Some key accomplishments this year
included:
• Adjusted EPS of US$1.24, compared to guidance of US$1.15
to US$1.25;
• Parent Free Cash Flow of US$689 million, compared to our
expectation of US$600 to US$675 million;
Back to Table of Contents
• Total Shareholder Return (TSR) of 39%, outperforming the
S&P 500 and S&P Utilities Indexes;
• Paid down US$1 billion in Parent debt, enabling us to achieve
a key investment grade financial metric of 3.95x Parent
leverage one year early;
Total Shareholder Return
In the third quarter of 2016, we established a goal of reaching investment grade. At that time, we had US$5
6
billion in Parent debt and a Parent Debt/EBITDA coverage ratio of 4.9x. Since then, we have reduced debt by
Page2018 SUSTAINABILITY REPORT
US$1.3 billion and ended 2018 with a Parent leverage ratio of 3.95x, achieving our goal a year ahead of our
plan. We are now very well-positioned to attain investment grade ratings in 2020.
We believe this improvement in our credit profile is helping us not only to reduce or cost of debt and improve
our financial flexibility, but also to enhance our equity valuation. Over the next few years, we expect that our
credit metrics to show further improvement through growth in our current free cash flow as well as modest
additional delivering.
We continued to improve the returns from our existing portfolio and position AES for long-term, sustainable
growth. We will achieve this objective as we continue to optimize our costs, strengthen our Balance Sheet,
reduce our carbon intensity and deploy new technologies in our existing markets. Combining our current
dividend yield of 3.2%, and our 7% to 9% average annual growth in Adjusted EPS and Parent Free Cash Flow,
will yield a double-digit total return annually through 2022.
Back to Table of Contents
(1) A non-GAAP financial measure
(3) Parent Free Cash Flow (a non-GAAP financial measure) should not be construed as an alternate to Net Cash Provided by Operating Activities which is
determined in accordance with GAAP. Parent Free Cash Flow is equal to Subsidiary Distribution less cash used for interest costs, general and administrative
activities, and tax payments by the parent company. Parent Free Cash Flow is used for dividends, share repurchases, growth investments, recourse debt
repayments, and other uses by the parent company.
7 Page2018 SUSTAINABILITY REPORT
OPERATIONAL EXCELLENCE
Striving for excellence is one of our core values. We built and grew the company by applying innovation, creating
solutions to address our industry's biggest challenges, and improving the way people work and live today. As we
look to tomorrow, finding new solutions to best meet our customers' needs will be essential to accelerating a
cleaner energy future for everyone.
Our definition of operational excellence comprises not only supplying reliable, affordable electricity and
ensuring our plants are available— but also managing cybersecurity, disasters and emergencies, public safety
and environmental performance.
Our management approach includes the establishment of a uniform system of Key Performance Indicators
(KPIs) set yearly to measure how efficiently and reliably we operate our plants, meet our customers’ electricity
needs and manage collections.
KPIs for generation businesses include commercial availability, equivalent forced outage factor, equivalent
availability factor, heat rate and days sales outstanding. Similarly, KPIs for distribution businesses include
system average interruption duration, system average interruption frequency, customer satisfaction, days sales
outstanding and non-technical losses. This report covers only the KPIs that are related to the identified material
issues.
Operational performance, established by the Compensation Committee of the Board of Directors, is included
in the Performance Incentive Plan Payouts of the base salary of Executives and all AES people. Additional
information is available in our 2019 Proxy Statement.
Availability, Reliability and Access to Electricity
Guaranteeing a steady supply of electricity to our customers requires that our businesses use modern
technologies for power generation and delivery and monitoring system reliability. It also requires a deep
understanding of our service areas and customer base. Through innovative solutions and flexibility, our
businesses seek to understand, monitor and serve all our customers’ needs for power.
Our generation businesses help markets meet their existing and growing electricity demand needs, while our
utilities businesses deliver electricity to more than 2.4 million customers.
Back to Table of Contents
Our businesses ensure they operate in compliance with local applicable regulations. Because millions of people
rely on the energy our businesses provide, our people continually improve the way we work and strive to deliver
energy in the most efficient, safe, and reliable manner we can. For example, Asset management ensures we are
running our businesses as effectively and efficiently as possible. Using standards, such as ISO, helps ensure we
are performing asset management in line with industry best practices.
During 2018 our businesses in Panama, Dominican Republic, Mexico, Puerto Rico, and El Salvador were
certified in Asset Management with the ISO 55001: 2014 designation. This achievement proves the
commitment of our people to build a stronger AES and to incorporate continuous improvement in our
8
approach.
Page2018 SUSTAINABILITY REPORT
Generation
We currently own and/or operate a generation portfolio of 31,792 MW (including one integrated utility), to
generate and sell power to customers, such as utilities, industrial users, and other intermediaries. Our generation
fleet is diversified by fuel type. Most of our generation businesses sell electricity under medium- or long-term
contracts or under short-term agreements in competitive markets.
Our power generation facilities employ a broad range of fuels suited to the different markets in which we
operate, including coal, gas, fuel oil, biomass and renewable sources such as wind, solar, hydroelectric power
and energy storage. This diversified generation portfolio reduces the risks associated with dependence on any
one fuel source.
Table 1 - Energy Generated (GWH) (Equity Adjusted Values)
Energy Generated Gross Energy Net Energy 1
(GWH) (including steam)
Total 81,670,056.27 75,904,354.90
Performance drivers of our generation businesses include types of electricity sales agreements, plant reliability
and flexibility, availability of generation capacity to meet contracted sales, fuel costs, seasonality, weather
variations and economic activity, fixed-cost management, and competition.
Table 2 – Commercial Availability by Energy Source, 2015-2018
Commercial Availability 2015 2016 2017 2018
(CA) 2
AES Total 89.85% 94.35% 94.66% 93.62%
Coal 85.13% 92.56% 92.74% 92.33%
Gas 94.15% 94.1% 95.47 92.41%
Hydro 99.41% 99.85% 98.13 99.93%
Wind 3 95.12% 92.79% 90.19 92.32%
Back to Table of Contents
In terms of 2018 performance, table above shows the consolidated performance of our generation portfolio in
terms of commercial availability. AES Dominicana owns a Liquefied Natural Gas terminal and international dock
that transports the LNG to the AES Los Mina (DPP) facility. During 2018, there were no significant or material
gas leakages.
To meet growing demand, our businesses can develop and construct new generation facilities. For our
1 Refers to our own energy generated, adjusted by ownership. Does no include heat and energy used for self-consumption.
9 Page
2 Commercial Availability: Actual variable margin, as a percentage of potential variable margin if the unit had been available at full capacity during outages.
3 Commercial Availability of a wind farm is determined using a different methodology, that is why it is not included in the AES total.2018 SUSTAINABILITY REPORT
generation businesses, our priority for development is platform expansion opportunities, where we can add on
to our existing facilities in our key platform markets where we have a competitive advantage. We make the
decision to invest in new projects by evaluating the project returns and financial profile against a fair risk
adjusted return for the investment and against alternative uses of capital, including corporate debt repayment
and share buybacks.
In 2018 we signed 1,946 MW of renewables under long-term Power Purchase Agreements (PPAs) and expect to
sign an additional 2,000 to 3,000 MW per year through 2022. We have 4,440 MW of capacity under
construction and expected to come on-line through 2021. Our primary projects under construction include: the
1,320 MW OPGC 2 project in India, the 1,384 MW Southland repowering in Southern California and the 531
MW Alto Maipo project in Chile.
The future growth across our markets will be heavily weighted towards lower carbon emissions generation.
Growth in renewables not only provides an opportunity for direct investment in wind and solar generation but
creates a market for energy storage.
During the year we completed 1.3 GWof new projects, including 254 MW of solar and energy storage mostly
in the US. At our utility, Indianapolis Power and Light (IPL) in Indiana, we completed the 671 MW Eagle Valley
combined cycle gas plant. The completion of Eagle Valley also represents the conclusion of a significant
investment program at IPL, wherein we have replaced nearly half of IPL’s coal-fired generation.
In Panama, we completed the 381 MW AES Colón combined cycle gas plant and regasification terminal, and
made the first shipment of LNG in Central America’s history. The LNG storage tank is expected to come
online in 2019, with approximately 60% of the terminal’s capacity still available to be contracted. We
expect that the entry of low-cost U.S. LNG will transform the Central American energy sector, much as it has
in the Dominican Republic.
Bósforo project inauguration in El Salvador
AES El Salvador and its partner Multi-Inversiones Corporation (CMI), completed the first 30 MW phase
of the 100 MW Bosforo solar project.
The project consists of 10 plants of 10 MW each to be located in low-income rural areas. During the
second phase of the project, three more 10 MW plants will be built – two in the western part of the
country and one in the department of Usulután. In Bósforo III – the final stage of the project – four
more plants, totaling 40 MW, will be built in the central zone of El Salvador.
Bósforo is an example of our commitment to contribute to the energy sector and
environmental sustainability in the country, through the implementation of avant-garde
technologies.
We also broke ground of a solar project in Jordan. AM Solar – a joint venture of AES Jordan, Mitsui & Co. Ltd
and Nebras Power –began construction of a 52 MW (DC) solar park in East Amman. The park is designed to Back to Table of Contents
help Jordan reshape itself towards green technologies and is aligned with Jordan Electricity master plan of
2020. Up to 300 jobs will be created during the construction phase of the park. After operations begin,
renewable energy will represent 16% of the total energy produced in the country.
During 2018, AES Tietê entered into an agreement with Brazilian University Instituto Presbiteriano
Mackenzie to install distributed energy generation to increase energy efficiency around its campus. The
solution features a solar carport and energy efficiency lighting. The solar carport, a parking lot covered by
photovoltaic panels, will be the largest private carport in Brazil with 1,680 solar panels and the potential
10
to generate 63,700 kWh/month. Campus lighting will also be replaced with LED lamps saving 15,250 kWh/
Page
month.2018 SUSTAINABILITY REPORT
Table 3 - Megawatts Under Construction at the end of 2018
Location Power Plant Fuel Gross MW
Solar 47
AES Distributed Energy (AES DE)
Energy Storage 3
Riverhead (sPower) Solar 20
Basin Electric (sPower) Wind 200
San Pablo (sPower) Solar 100
US - Various
Antelope DSR3 (sPower) Solar 20
Solar 14
Kekaha (AES DE)
Energy Storage 14
Southland Repowering Gas 1,284
Na Pua Makani Wind 28
Alamitos Energy Center Energy Storage 100
El Salvador Bosforo Solar 57
Boa Hora Solar 69
Brazil
AGV Solar Solar 75
Energética Wind 100
Argentina
Vientos Nequinos Wind 80
Chile Alto Maipo Hydro 531
Mexico Mesa La Paz Wind 306
India OPGC 2 Coal 1,320
Jordan AM Solar Solar 52
We are also focusing on our “Green Blend and Extend” strategy, where we are enhancing some of our current
contracts by blending and extending existing PPAs, by adding renewable energy. We see potential opportunities
to execute this strategy across many of our markets, including Chile and Mexico. In fact, in 2018 we signed our
first two “Green Blend and Extend” contracts, for 576 MW in Chile and Mexico
Distribution
Back to Table of Contents
AES' six utility businesses distribute power to 2.4 million people in two countries (US and El Salvador). AES'
two utilities in the US also include generation capacity totaling 4,102 MW. Our utility businesses consist of IPL
(an integrated utility) and DP&L (transmission and distribution) in the US, and four utilities in El Salvador
(distribution).
In general, our utilities sell electricity directly to end-users, such as homes and businesses, and bill customers
directly. Key performance drivers for utilities include the regulated rate of return and tariff, seasonality, weather
variations, economic activity, reliability of service and competition. Revenue from utilities is classified as
regulated on the Consolidated Statements of Operations.
11 Page2018 SUSTAINABILITY REPORT
Table 4 – Length of Distribution and Transmission Lines (by SBU and Country)
Transmission Lines (Km) Distribution Lines (Km)
Business (High Voltage) (Low Voltage)
Profile by SBU
Country
Overhead Underground Overhead Underground
IPL 1,392 - 11,453 9,233
United States DPL 2,776 13 16,914 5,884
TOTAL US 4,168 13 28,367 15,117
South America Chile 1,417
MCAC El Salvador - - 38,142 97
Total AES 5,585 13 66,509 15,214
Because we understand the importance of access of energy as a cornerstone for social development, we work
with local governments and support their initiatives to provide access to energy, specially to low income
communities. For example, with our AES Rural Energy program we have reduced the number of homes without
electricity in El Salvador, improving the quality of miles of rural communities in the country. Access to energy
allows them to have new opportunities such as the possibility of creating businesses and enjoying the benefits
of energy to receive better education, health services, road safety and healthy recreation.
Families in El Salvador benefited from electric power installation
AES El Salvador, through its companies EEO and DEUSEM, executed the "Light for All"
program providing electricity service for the first time to over 900 families in the departments of
San Miguel and Usulután, providing them with new opportunities to improve their quality of life.
The project consists of the installation of metal poles, electrical wiring from the main street to
the community, and meters for each of the families. In addition, each house has been installed an
integral board, including a thermal box, an outlet and efficient light bulb.
We track the reliability of the distribution networks by the average number and duration of interruptions per
customer. The values are consolidated and reported based on ownership-adjusted EBITDA. In addition, we also
Back to Table of Contents
set targets for customer satisfaction based on the percentage of customers that are satisfied and greatly
satisfied.
The system average interruption duration index (SAIDI) represents the total minutes of interruption the average
customer experiences annually, while the system average interruption frequency index (SAIFI) represents the
average number of interruptions the average customer experiences annually. As showed in the tables, the
performance in the reliability KPIs improved overall for AES.
12 Page2018 SUSTAINABILITY REPORT
Table 5 – System Average Interruption Duration Index (SAIDI), 2015-2018
2018
Business 2015 2016 2017 2018
Target
Actual AES 2.54 2.71 2.74 1.84 2.20
AES El Salvador 14.91 17.42 15.47 13.75
Dayton Power & Light (DP&L) 1.75 1.45 1.69 1.79
IPL 0.81 1.03 0.99 1.12
Table 6 - System Average Interruption Frequency Index (SAIFI), 2015-2018
Business 2015 2016 2017 2018 2018 Target
Actual AES 1.66 1.65 1.64 1.29 1.55
AES El Salvador 5.71 6.22 5.51 4.98
Dayton Power & Light (DP&L) 0.92 0.76 0.82 0.92
IPL 0.66 0.74 0.86 0.95
Making Indianapolis Safer and More Resilient
Every year, the Edison Electric Institute (EEI) recognizes select companies with the Edison Award, our
industry’s most prestigious award. IPL, our integrated utility in Indiana, US was recognized as a finalist
for Edison Electric Institute’s 2018 EEI Awards for improving underground infrastructure to enhance
the safety and resiliency of the City of Indianapolis.
IPL partnered with Texas-based Fiber-Optic Pipeline Solutions to be the first electric utility to use a
distributed temperature sensing system to monitor external high-temperature threats in an
underground network secondary grid. View a video to know more about this innovative development.
Customer Satisfaction
Back to Table of Contents
As one of five KPIs for utility businesses AES sets annual targets for customer satisfaction. The targets and
actuals are tracked on a monthly basis in the monthly Management Performance Review meeting.
AES utilities participate in national and/or regional third-party surveys. These include CIER (Regional Energy
Integration Commission) for our El Salvadoran utilities, and Power & Associates for IPL and DP&L. The surveys’
statistically significant representative samples cover our distribution businesses complete customer base. The
results are used to calculate the overall customer satisfaction index.
The results shown in the following table represent residential retail and commercial results from all AES
13
distribution business for the past four years.
Page2018 SUSTAINABILITY REPORT
Table 7- AES Consolidated Customer Satisfaction for Distribution Businesses, 2015-2018
2015 2016 2017 2018 2018 Target
% of customer satisfaction 83.9 88.5 86.3 87.5 86.3
Our utility businesses are continuously innovating to provide the best service to its customers, diversify
communication channels, increase customer satisfaction and reduce operation costs. During the year, for
example, DP&L launched a new online Outage Map to improve the customer experience and provide timely
information. The new map was recognized by The Academy of Interactive and Visual Arts with a Silver W3
award in the Mobile Apps / Sites category for Services & Utilities. Also, DP&L residential customers started to
receive Home Energy Insight Reports in their mail. This new program is designed to help customers understand
how they use energy at home, see how they compare to similar households, and offer useful tips and strategies
to lower their usage.
We are also implementing a corporate-wide digital transformation, including becoming a strategic investor in
Simple Energy. Simple Energy provides a digital platform that allows our IPL and DP&L utilities to accelerate
energy efficiency and demand response programs, all the while, improving customer experience. Simple
Energy's digital platform serves not only AES utilities but 40 other utilities in the US with access to over 40
million end customers.
Our utilities were also recognized for their efforts. DP&L and IPL were among thirty-three U.S. utilities
designated as 2018 Utility Customer Champions, an annual honor given to gas, electric and combination
utilities that exhibit exceptional performance in brand trust, service satisfaction and product experience. These
three categories compose the "Engaged Customer Relationship" (ECR) index, which provides a holistic
measurement of the entire utility customer experience.
We have received no claims from our customers concerning violations to their privacy that incurred in significant
penalties.
Energy Storage
AES businesses are dedicated to improving the lives of customers and energy storage reduces the cost of
delivering electricity, supports renewable generation, and enables unmatched grid reliability and resiliency.
As utilities face increasing challenges integrating intermittent generation sources, there is a critical need for grid
stabilization and reliability support. Energy storage is a proven, cost competitive solution with global demand
expected to grow tenfold in five years and reaching at least 28 GW of installed capacity by 2022.
The integration of renewables and energy storage is the key to accelerating a cleaner energy future. In Hawaii, Back to Table of Contents
we are delivering two solar plus storage facilities for a total of 34 MW of solar capacity and 170 MWh of five-
hour energy storage on the island of Kaua’i. The first of these pioneering projects, Lāwa’i was completed in
December 2018 and will satisfy energy demand during peak hours in the evening, as well as the rest of the
day. The second, Kekaha, is under construction and expected to be on-line later in 2019.
In 2018 we partnered with Siemens to create Fluence, the leading global energy storage technology and services
provider. This market is expected to have rapid growth alongside the increased build out of intermittent power
resources. Fluence combines the extensive technology expertise, unique energy storage market experience, and
14
global reach of Siemens and AES to offer proven and cost-competitive energy storage systems for a rapidly
Page
transforming sector.2018 SUSTAINABILITY REPORT
During the year, Fluence delivered or was awarded 80 projects in 17 countries, with a total capacity of 766 MW.
Notably, Fluence was also named the #1 utility energy storage integrator by Navigant.
Cybersecurity
Directly aligned to our first value of safety, the mission of our global cybersecurity program is to securely enable
the business by reducing risk, improving cyber-hygiene, and protecting privacy, while promoting innovation and
the AES transformation to a digital enterprise.
This is important as the energy sector is increasingly under siege from cyber criminals, organized crime, and
hacktivists that disrupt the sector’s critical infrastructure. A successful cyberattack on one of our plant control
systems could impact generation capabilities; similarly, a breach causing loss of personal data could cause
financial and reputational impact to our customers and employees.
In 2013, AES initiated a strategy to create a Global Cybersecurity program. Over the years, this strategy has
evolved to include an operating model, governance, mandatory cybersecurity guidelines, training, awareness,
data protection, shared technologies and intelligence that we employ to guide our global program across our
diverse businesses.
Figure 1 - AES Cybersecurity program history
We regularly communicate this strategy with the corporate leadership, the Board of Directors and our global
Back to Table of Contents
cybersecurity team through biweekly cybersecurity council meetings, quarterly Chief Information Security
Officer (CISO) updates, and an annual off-site summit. Additionally, as part of our global strategy, we self-assess
compliance with our stated guidelines and cooperate with our Corporate Internal Audit function to audit
compliance. Similarly, AES businesses conduct external penetration tests to assess the sustainability of the data
system and plants.
Operating a global cybersecurity program in 15 diverse markets requires a flexible strategy to work with
different internal stakeholders across the businesses, including our regional presidents, local information
technology (IT) directors, plant managers, cybersecurity program managers, and the internal audit and
15
technology teams.
Page2018 SUSTAINABILITY REPORT
This adaptability has made our program successful. For example, while we audit our businesses against
cybersecurity guidelines, they have the discretion to deliver cyber awareness information customized to their
own people and local culture. This global view includes hosting our cybersecurity program managers and IT
directors at an annual summit, where they can be trained and network with their colleagues from around the
world.
As a result of the efforts by our Global Cybersecurity program, AES has not had a significant cybersecurity event
—including the capture of a control system, unauthorized exposure of company data, or breach of customer
records.
Awareness and Education
AES Cybersecurity Awareness Program was recognized with the coveted CSO50 award for the innovative ways
we have tied cybersecurity to our first value of safety, through interactive security exercises, user-friendly
awareness materials, and global training, all delivered across multiple languages. Over the past four years,
components of our program have been recognized by CSO50, SANS, Info Security, PhishMe and ISE for our
Cyber Ninja campaign, Community Collaboration, and Advanced Threat Mitigation.
As part of our awareness function, we design training and activities for collective use among SBUs. This way,
Cyber Program Managers in each SBU can focus on executing awareness activities without having to create and
design from scratch. Among the activities are newsletter articles, internal briefings (formal briefings and
informal gatherings), relevant film screenings, email reminders, group area reminders (such as tabletop reminder
cards), employee training and employee awards.
Conditioning AES people not to click malicious emails is critical. To that end, AES works with anti-phishing
training company Cofense to reduce employee susceptibility to phishing attempts. We administered 118,004
exercises to AES people in 2018. The result was reduced reduction of susceptibility rates from 12 percent in 2015
to 7.4 percent in 2016 to 5.9 percent in 2017 to 4.07 percent in 2018. For comparison, the susceptibility rate for
all energy sector companies is 8.2 percent.
Charter of Trust
Led by our CEO, Andrés Gluski, AES joined The Charter of Trust (CoT), a cybersecurity initiative founded
by Siemens, a key AES partner. The charter, launched at the 2018 Munich Security Conference, calls for
standards to boost the security of critical infrastructure and ensure trust in digitalization through
cybersecurity. Some of its founding signatories include Airbus, Allianz, Daimler Group and IBM. This aligns
with our core belief that cooperative digital security norms are central to the future of companies that
support critical infrastructure.
Next-Generation Technologies
The sustainability of our cybersecurity program depends on our adaptability to the changes in our business. With
regard to next generation technology, we have pushed our team and our vendors to embrace new cyber
technologies, including:
Back to Table of Contents
• Operational Technology security monitoring pilots
• Global consolidated penetration testing
• Integrated vulnerability management
Incident Response
We have labored to prepare for an incident at AES by reviewing our plans, developing relationships with
16
regulators and law enforcement, signing retainers with cyber forensic firms, and obtaining the services of a
Page
breach coach. Perhaps the most critical component of incident response is crisis management. To that end, we2018 SUSTAINABILITY REPORT
engaged an external party to design and facilitate a global cyber tabletop exercise. In this interactive session, we
assembled AES corporate leadership to respond and react to a continually escalating series of events. Inspired
by real-world experience, the incidents tested our responsiveness to cyber extortion, supply chain risk,
Operational Technology security, disinformation campaigns, ransomware, and EU General Data Protection
Regulation (GDPR) compliance. We conducted two exercises – the first with the Executive Leadership Team
led by CEO Andrés Gluski and the second with a group of Corporate Vice Presidents named in the
business continuity plan.
Intelligence and Advocacy
As we know that collective knowledge is an imperative, we actively participate in numerous utility, energy and
cybersecurity working groups, including those led by government, industry and the private sector. Some of these
working groups include: Department of Homeland Security, Federal Bureau of Investigation’s InfraGard
Program, EEI, Electricity Information Sharing & Analysis Center (E-ISAC), North American Electric Reliability
Cooperation (NERC), the Institute for Critical Infrastructure Technology (ICIT), as well as several additional
commercial partners that provide paid collaboration and intelligence services.
Additionally, we participate in a Cooperative Research and Development Agreement (CRADA) with DHS to
share and receive industry and company actionable information. At the local level, some businesses also
collaborate with local agencies, including FBI Field Offices and Global Legats, the Brazilian Policia Federal, and
the Chilean Cybercrime Investigation Metropolitan Police.
Data Protection
In the past year, we have stood up a global privacy and data protection function. Led by a cross-functional
steering committee, the Data Protection Officer, matrixed team, and external consulting support have
developed a program to help AES comply with the General Data Protection Regulation. This has included
completing strategic tasks within: Strategy and Governance, Policy Management, Cross-Border Transfers, Data
Lifecycle Management, Individual Rights Processing, Privacy by Design, Information Security, Privacy Incident
Management, Data Processor Accountability, and Training and Awareness. As a milestone, our Internal Audit
function assessed our GDPR implementation and made recommendations for improving data protection and
privacy globally at AES.
Back to Table of Contents
17 Page2018 SUSTAINABILITY REPORT
Disaster/Emergency Planning and Response
AES businesses face possible risks and scenarios that can disrupt operations and the service they provide. Safe,
fast and effective power restoration following emergency events is essential to the reliability of electric power
generation and distribution systems.
Hence, as a provider of essential services, our businesses have diverse programs in place to ensure our operations
are prepared to manage unusual disruptions. The goal is to keep our business and operations running effectively,
safely and securely.
Our management approach includes a set of emergency preparedness standards describing requirements for
the development, review and implementation of Business Continuity Plans (BCP) at each AES location. These
plans also consider local regulations and include preparedness for: operational emergencies; off-site
emergencies that will have a significant impact on operations or staff; physical security measures, including
evacuation of our employees in case of unrest; and emergencies involving nature, e.g., severe weather, floods,
earthquakes, tsunamis, etc.
Our Safety Management System and the Global Safety Standard on Emergency Preparedness describes
minimum requirements for emergency preparedness plans that address the risk associated with operational
activities, man-made emergencies, natural disasters and anticipated industry hazards. Also, the Safety Standard
require for emergency response drills and training to our people. In addition, when necessary, our businesses
establish an educational program with the local communities.
Besides the emergency preparedness standards, each business has a comprehensive playbook that includes
diverse plans such as: Business Continuity, Cybersecurity, Physical Asset and Personnel Security, Crisis
Communication, Stakeholder Management, among others.
To ensure business continuity, businesses define scenarios followed by action plans to maintain an acceptable
level of operational capability while restoring operations. Some of the procedures include monitoring of weather
systems; staging of resources prior to anticipated emergencies; mobilization to restore outages; continuous
improvement of our emergency response capabilities based on past performance; and extensive storm response
training, including detailed storm simulations.
In the United States, for example, IPL and DP&L are part of a mutual aid agreement with several utilities to assist
in bringing electricity back to customers following severe weather conditions. The same agreement enables IPL
and DP&L to request help from other utilities when severe weather impacts our ability to serve our customers
in Ohio or Indiana.
US SBU utilities recognized by Edison Electric Institute
Both DP&L and IPL received Emergency Assistance Awards for outstanding work assisting customers Back to Table of Contents
following Winter Storm Riley and Winter Storm Quinn by the Edison Electric Institute (EEI).
Winter Storms Riley and Quinn produced hurricane-force winds, more than three feet of snow, white-
out blizzard conditions, coastal flooding, and heavy rain and snow. The storms left more than 670,000
customers without power across New England.
DP&L sent line workers concentrating on New Jersey covering more than 570 miles over the course
of 11 days to help replace poles, miles of wire, and exchange transformers to restore power to
customers. IPL sent line workers to Massachusetts to help restore power to customers over the course
of 15 days.
18 Page2018 SUSTAINABILITY REPORT
Stakeholder collaboration and engagement is also an important part of our safety and recovery the plans. Our
procedures include clear and frequent communications and collaboration with customers, neighboring
communities, the media, contractors and government officials. To create awareness with key stakeholders,
businesses also can share information with surrounding communities about safety and how to act during an
emergency, bad weather conditions, or spill overs, among others.
Back to Table of Contents
19 Page2018 SUSTAINABILITY REPORT
ENVIRONMENTAL PERFORMANCE
In the pursue of our mission of improving lives by accelerating a safer and greener energy future, our businesses
are committed to developing energy solutions in an environmentally responsible manner. Through impact
evaluations, technological innovation, and implementation of appropriate environmental controls, we seek to
select not only an environmentally compliant but also an environmentally sound energy solution for each
market we serve.
We encourage our businesses to go beyond simply meeting environmental standards as regulations
requirements and to develop the right energy solutions and operating practices for the markets in which they
operate. Our environmental governance structure ensures assigning clear roles, responsibilities and
accountability for overall environmental performance and goal achievement.
The Governance Committee of the Board of Directors is the highest body that monitors environmental
compliance of AES businesses, and reviews and approves the scope of the internal environmental compliance
audit programs. In addition, SBU leaders have responsibility for complying with environmental regulation and
managing their operations to minimize environmental impact.
AES has an Environmental Policy that is the foundation of our environmental management approach. The policy
comprises four principles applicable to all of our operating businesses and construction projects and sets the
expectations for our AES people and contractors at all covered locations. Building on the Environmental
Policy all the aspects of our environmental performance are managed in accordance with our
Environmental Management System (EMS) framework
The EMS provides a framework for managing our material environmental aspects by using continuous
improvement principles. Our EMS is based on industry best practices consistent with the principles of the ISO
14001 standard and sets environmental program guidelines for each AES business. In addition, about 66 percent
of AES people work at locations that have voluntarily certified their EMS to the ISO 14001 international standard
which helps organizations to identify, prioritize and manage environmental risks, as part of its usual business
practices.
Under the EMS, each operational business and construction project is required to establish an environmental
program that allows for continuous environmental performance monitoring, environmental risk assessments
and periodic integrated environmental, health and safety audits.
The environmental programs assist each AES business in achieving environmental compliance, addressing
significant environmental impacts and striving for continuous performance improvement.
Back to Table of Contents
The EMS is comprised of thirteen environmental management and technical standards that cover topics such as
general environmental requirements and prohibitions, PCB (polychlorinated biphenyl) management, hazardous
waste and chemicals management, biodiversity protection, spill prevention and control, and contractor
environmental management. In some cases, the requirements of these standards are more stringent than local
environmental regulatory requirements.
To verify the adherence and compliance of our businesses to the AES EMS Framework and standards we have
developed an integrated Environmental Health and Safety (EHS) audit program. Each audit finding is
20
accompanied by a corrective action plan and a completion date, with the overall audit performance reported
Page
periodically to the executive leadership.2018 SUSTAINABILITY REPORT
During 2018 none of the businesses we operate paid significant fines 4 or penalties related to the environment
or ecological issues.
AES used the services of Lloyd’s Register Quality Assurance Inc. (LRQA) to verify and conduct a limited assurance
for 2013-2018 of AES businesses’:
• Air emissions data;
• Water withdrawal and discharge data; and
• Coal combustion product (CCP) generation and recycle/reuse data.
In addition to third-party verification, we use an internal AES quality assurance/quality control (QA/QC) process
to validate reporting every year.
All the data included in the environmental performance indicators covers all business where AES has operational
control.
2018 Environmental Goals
AES first established the expectation for setting of local level environmental goals in 2008 with the company-
wide implementation of our EMS framework. Since then, we made a commitment to set new annual goals
focused on identifying opportunities for improvement of our existing environmental programs and initiatives.
Our 2018 global environmental goals focused on identifying opportunities for improvement of our existing
environmental programs and initiatives:
2018 GLOBAL ENVIRONMENTAL GOALS Result
1) Unified Environmental reporting practices Goal Achieved
To identify and implement industry best practices as we maintain our EHS
Management Information Systems.
2) Develop global database of significant environmental permits. Goal Achieved
To operate our business, it is at times necessary that we apply and obtain a
construction/operating permits. One of our practices at the business level
is to comply with the requirements and renewals of these permits. The
global database allows for the ease of accessibility and renewal tracking
company wide.
Additionally, we also have in place a set of two environmental leadership KPIs, which support accomplishment Back to Table of Contents
of the annual environmental goals. These KPIs track environmental performance in areas of
environmental awareness training participation, environmental audits performance, environmental
operating events, and regulatory proceedings, fines, etc. Each business leader’s performance against these
KPIs is continually tracked using our global EHS Management Information System (EMIS), the AESOnline
System.
21 Page
4 Significance is determined by a threshold and this only refers to fines that were equal to or less than US$10,000 USD.2018 SUSTAINABILITY REPORT
Air Emissions
Combustion of fuels to generate electric power results in the release of both conventional and greenhouse gas
(GHG) emissions. Many factors influence emissions, including generation diversity and efficiency, demand for
electricity, weather, fuel availability and prices, and emission controls deployed. Depending on the fuels used to
generate power, these air emissions may consist of sulfur dioxide (SO2), nitrogen oxides (NOx), particulate
matter (PM), mercury (Hg), as well as greenhouse gases such as carbon dioxide (CO2) and trace emissions of
methane (CH4) and nitrous dioxide (N2O).
Air emissions from AES’ generation businesses comply with applicable national, local and, in some cases,
international regulatory requirements. Air emissions are tracked using continuous emission monitoring systems
(CEMS) and/or operational parameters (e.g., fuel use and appropriate emission factors). Our businesses manage
air emissions using a combination of power generation plant combustion unit and air control equipment design,
and proper operation of these two systems. The installation of air control systems is primarily dictated by locally
applicable environmental laws and regulations. Because air emissions are directly related to the amount of fuel
used, each AES business continuously monitors its power generation efficiency and takes action to improve
efficiency when necessary.
In addition to power generation, the use of light and heavy-duty vehicle fleets, as well as other equipment,
represents another source of direct emissions, which is monitored and accounted for at our businesses.
All air emissions are consolidated using an equity share approach and are voluntarily disclosed via this
Sustainability Report, the Annual Report, CDP Climate Change program and other means of communication.
Targets account for any operational variations by factoring in portfolio changes (divestitures, shutdowns,
acquisitions, growth, etc.) and are estimated to not exceed the highest annual emission rate during the
preceding three years.
AES Gener voluntarily joins an emissions monitoring system
AES Gener and other leading companies in Chile voluntarily joined the Online Monitoring System
implemented by the Chilean Environment Superintendence. The monitoring system tracks
components emitted into the atmosphere including CO2, SOX and NOX, and seeks to improve the
environmental compliance model in Chile. Chilean officials are using the data to create a state-of-the-
art environmental management model. By voluntary submitting to the monitoring system, AES Gener
is being transparent about its emissions which are well below the standard further highlighting its
commitment to the environment while helping Chile build its environmental management model.
Climate Scenario Report
In 2018 we announced that based on our renewable growth plans, we expect to reduce our carbon intensity Back to Table of Contents
(tons of CO2/MWh of generation) by 70 percent from 2016 to 2030. Furthermore, we also announced a near-
term target of reducing our carbon intensity by 50 percent from 2016 to 2022, compared to our prior goal of
25 percent over the same period.
In November 2018, we published the AES Climate Scenario Report, which includes an impact analysis of a 2°
Celsius scenario on our strategy and business, fulfilling our commitment to adopt the recommendations of
the Task Force on Climate-related Financial Disclosures (TCFD). AES was the first publicly-traded owner of
utilities and power companies based in the U.S. to disclose its portfolio’s resilience consistent with the TCFD
22
recommendations and third-party scenarios.
Page2018 SUSTAINABILITY REPORT
The report shows that AES’ portfolio is resilient against the assessed climate risks and demonstrates the
significant upside for AES in a lower carbon future.
Direct Greenhouse Gas Emissions
We follow the principles and requirements of the GHG Protocol’s Corporate Accounting and Reporting
Standard. Our GHG emissions inventory includes all GHGs covered by the Kyoto Protocol, except for PFCs and
NF3, since these are not used in our operations.
Our 2018 greenhouse gas emissions in CO2 equivalent (CO2e) result primarily from the following sources:
• Major fuel-fired power generation stationary sources (e.g., boilers, gas turbines, reciprocating engines),
used for power generation;
• Non-power generation sources, such as smaller fuel-fired sources (e.g., emergency generators, space
heating, portable equipment), vehicles, and releases of CH4, SF6 and HFC-based gases.
Complete details related to our inventory and methodology can be found on our response to CDP Climate
Change questionnaire available at CDP’s website.
Table 8 shows direct (Scope 1) GHG emissions values on an ownership-adjusted basis for 2015-2018. The CH4
value for 2016 do not match the ones reported in previous years, because it was recalculated using updated
emissions factors.
Table 8 – Direct GHG Emissions (Scope 1), 2015 – 2018
2018
Direct GHG Emissions (Scope 1) 5 2015 2016 2017 2018
target
Total Scope 1 70,339 70,457 63,497 51,878 68,922
Power Generation
CO2 70,105 69,981 63,053 51,481
6
CH4 26 210 186 153
Thousand
N 2O 208 204 210 167
MT
Other Sources
CO2 43 42 29 51
SF6, HFCs and CH4 18 19 19 27
Emissions Intensity MT / MWh 0.71 0.67 0.65 0.61 Back to Table of Contents
As noted in the table, our Scope 1 emissions stayed below the 2018 target. Also the actual Scope 1 emissions
have improved by 26 percent since 2015 due to emission reduction activities, conversion of coal units to gas,
efficiencies, retirements and portfolio changes among other factors.
23 Page
5 Equity adjusted values.
6 In 2017 there was a change in the emission factor for CH4. Values for 2015 were not recalculatedYou can also read