Young Drivers and Road Safety - Edited by Justin Healey - RBSCLIBRARY
←
→
Page content transcription
If your browser does not render page correctly, please read the page content below
Volume | 389
Young Drivers
and Road Safety

Edited by Justin Healey
Volume | 389
    Young Drivers
    and Road Safety

                                                                                Edited by Justin Healey

This e-book is subject to the terms and conditions of a non-exclusive and non-transferable SITE LICENCE AGREEMENT between
THE SPINNEY PRESS and: Rose Bay Secondary College, Dover Heights, katherine.efthimiou@det.nsw.edu.au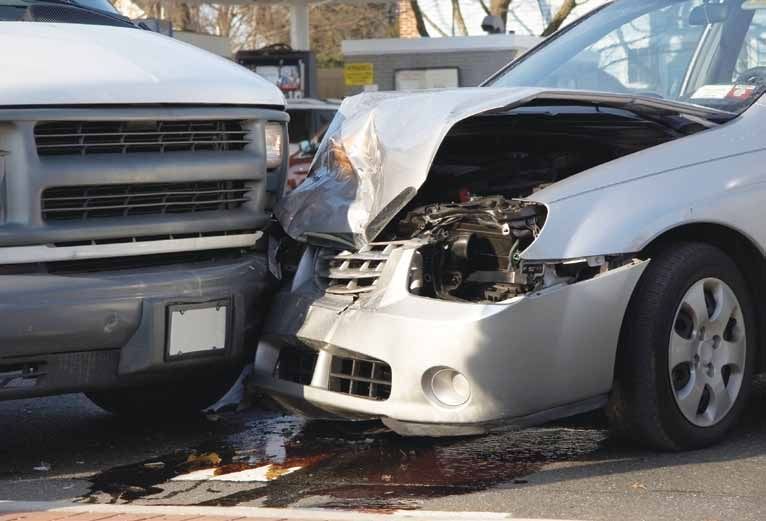
First published by

PO Box 438 Thirroul NSW 2515 Australia
www.spinneypress.com.au

© The Spinney Press 2015.

COPYRIGHT
All rights reserved. Other than for purposes of and subject to the conditions prescribed under the Australian
Copyright Act 1968 and subsequent amendments, no part of this publication may in any form or by any means
(electronic, mechanical, microcopying, photocopying, recording or otherwise) be reproduced, stored in a retrieval
system or transmitted without prior permission. Inquiries should be directed to the publisher.

REPRODUCTION AND COMMUNICATION FOR EDUCATIONAL PURPOSES
The Australian Copyright Act 1968 (the Act) allows a maximum of one chapter or 10% of the pages of this work,
whichever is the greater, to be reproduced and/or communicated by any educational institution for its educational
purposes provided that the educational institution (or the body that administers it) has given a remuneration notice
to Copyright Agency Limited (CAL) under the Act.

For details of the CAL licence for educational institutions contact:
Copyright Agency Limited, Level 15, 233 Castlereagh Street Sydney NSW 2000
Telephone: (02) 9394 7600 Fax: (02) 9394 7601 Email: info@copyright.com.au

REPRODUCTION AND COMMUNICATION FOR OTHER PURPOSES
Except as permitted under the Act (for example a fair dealing for the purposes of study, research, criticism or review)
no part of this book may be reproduced, stored in a retrieval system, communicated or transmitted in any form or
by any means without prior written permission. All inquiries should be made to the publisher at the address above.

National Library of Australia Cataloguing-in-Publication entry

Title:                 Young drivers and road safety / Justin Healey, editor.

ISBN:                  9781922084798 (ebook : pdf)

Series:                Issues in society (Balmain, N.S.W.) ; v. 389.

Notes:                 Includes bibliographical references and index.

Subjects:              Teenage automobile drivers--Australia.
                       Automobile driver education--Australia.
                       Traffic safety--Australia.

Other Authors/Contributors: Healey, Justin, editor.

Dewey Number:          629.2830835

Cover images:          Courtesy of iStockphoto.

This e-book is subject to the terms and conditions of a non-exclusive and non-transferable SITE LICENCE AGREEMENT between
THE SPINNEY PRESS and: Rose Bay Secondary College, Dover Heights, katherine.efthimiou@det.nsw.edu.au
CONTENTS

           CHAPTER 1              ROAD SAFETY RATES AND ATTITUDES
                                  National road toll down on previous year, but cycling fatalities doubled                 1
                                  Road deaths in Australia: at a glance                                                    2
                                  Nose-to-tail collisions are the number one crash on Aussie roads                         3
                                  Road safety: modelling a global phenomenon                                               5
                                  International road safety comparisons: at a glance                                       7
                                  Community attitudes to road safety                                                       9

           CHAPTER 2              YOUNG DRIVERS AND RISK BEHAVIOURS
                                  Young adult road safety – a statistical picture                                          15
                                  Accidental injury and death: young people and road traffic accidents                     21
                                  What happens to your body in a crash?                                                    23
                                  Young drivers and crash risk factors                                                     25
                                  Young Driver Index                                                                       26
                                  Young people taking risks in the driver’s seat                                           30
                                  Dangerous driving behaviours                                                             33
                                  Speeding – the biggest killer on our roads                                               35
                                  Aggressive driving                                                                       36
                                  Mobile phone use and distraction while driving                                           39
                                  Drug driving                                                                             43
                                  Alcohol and safe driving tips                                                            45
                                  Insufficient sleep boosts crash risk for young people                                    46
                                  Fatigue: tips for staying safe                                                           46
                                  Teenagers learning to drive                                                              48

                                  Exploring issues – worksheets and activities                                             51
                                  Fast facts                                                                               57
                                  Glossary                                                                                 58
                                  Web links                                                                                59
                                  Index                                                                                    60

This e-book is subject to the terms and conditions of a non-exclusive and non-transferable SITE LICENCE AGREEMENT between
THE SPINNEY PRESS and: Rose Bay Secondary College, Dover Heights, katherine.efthimiou@det.nsw.edu.au
CHAPTER 1
  INTRODUCTION
  Chapter Heading

Young Drivers and Road Safety is Volume 389 in the ‘Issues in Society’ series of educational resource
books. The aim of this series is to offer current, diverse information about important issues in our
world, from an Australian perspective.

KEY ISSUES IN THIS TOPIC
Although there has been a sustained reduction in Australia’s national road death toll over recent years, young
people are still over-represented in road fatality and injury statistics, particularly young males.
Young drivers continue to engage in a range of dangerous on-road behaviours, including drink and drug driving,
speeding, aggressive driving, driver fatigue, mobile phone use and distraction.
This book presents the latest statistics and reports on road safety rates and attitudes in Australia and examines the
risk behaviours of young drivers. The book is aimed at educating young people and learner drivers, and contains a
range of advice on how to avoid risks and increase road safety and awareness.

SOURCES OF INFORMATION
Titles in the ‘Issues in Society’ series are individual resource books which provide an overview on a specific subject
comprised of facts and opinions.
The information in this resource book is not from any single author, publication or organisation. The unique value of
the ‘Issues in Society’ series lies in its diversity of content and perspectives.
The content comes from a wide variety of sources and includes:
hh Newspaper reports and opinion pieces            hh Statistics and surveys
hh Website fact sheets                             hh Government reports
hh Magazine and journal articles                   hh Literature from special interest groups

CRITICAL EVALUATION
As the information reproduced in this book is from a number of different sources, readers should always be aware
of the origin of the text and whether or not the source is likely to be expressing a particular bias or agenda.
It is hoped that, as you read about the many aspects of the issues explored in this book, you will critically evaluate
the information presented. In some cases, it is important that you decide whether you are being presented with
facts or opinions. Does the writer give a biased or an unbiased report? If an opinion is being expressed, do you
agree with the writer?

EXPLORING ISSUES
The ‘Exploring issues’ section at the back of this book features a range of ready-to-use worksheets relating to
the articles and issues raised in this book. The activities and exercises in these worksheets are suitable for use by
students at middle secondary school level and beyond.

FURTHER RESEARCH
This title offers a useful starting point for those who need convenient access to information about the issues
involved. However, it is only a starting point. The ‘Web links’ section at the back of this book contains a list of useful
websites which you can access for more reading on the topic.

This e-book is subject to the terms and conditions of a non-exclusive and non-transferable SITE LICENCE AGREEMENT between
THE SPINNEY PRESS and: Rose Bay Secondary College, Dover Heights, katherine.efthimiou@det.nsw.edu.au

CHAPTER 1
                                                   Road safety rates and attitudes

National road toll down on previous
year, but cycling fatalities doubled
The national road toll has revealed a drop in road
fatalities for most states and territories in 2013, with
an overall lower figure than 2012. An ABC News report
by Mohamed Taha and Gillian Bennett

T
      here was a total of 1,193 deaths on the roads last
      year, a decrease of more than 8 per cent when
      compared to the previous year. New South
Wales and Victoria experienced record low figures for
road fatalities. Northern Territory, Queensland, the
Australian Capital Territory and Western Australia
recorded fewer roads deaths. However, Tasmania and
South Australia recorded slight increases.

            Victoria, NSW lead country
              with record low figures
   Victoria led the country with a 14 per cent drop
in deaths compared to 2012, the state’s lowest figures
since 1924. But the Victorian Government says they are
adamant in working towards no fatalities.

           NATIONAL ROAD TOLL FIGURES
                                         2013           2012
Tasmania                                    36             31         “The key thing is that these deaths are
Victoria                                   242            282         avoidable. There are no accidents on our
New South Wales                            339            369         roads. Drivers make poor choices. They
Australian Capital Territory                 7             12         choose to speed, they choose to drive
Queensland                                 272            280
                                                                      under the influence of alcohol and drugs.
                                                                      They choose to be distracted from the
Northern Territory                          37             48
                                                                      particular task at hand.”
South Australia                             97             94
                                                                                                   Victoria’s Acting Premier, Peter Ryan
Western Australia                          163            182

   “The key thing is that these deaths are avoidable.              when we have no road trauma in this state,” he said.
There are no accidents on our roads,” Victoria’s Acting               New South Wales also recorded its lowest figure since
Premier Peter Ryan said.                                           1924, with 339 road fatalities in 2013. Roads Minister
   “Drivers make poor choices. They choose to speed,               Duncan Gay says the figure could be improved.
they choose to drive under the influence of alcohol                   “While fewer fatalities is encouraging, that still
and drugs.                                                         means 339 people do not get to spend the new year
   “They choose to be distracted from the particular               with friends and family, and their loss will be felt by
task at hand.”                                                     everyone they knew as we start 2014,” he said.
   Victorian Police Assistant Commissioner Robert Hill
says the figures are not a reason to become complacent.                  Cycling fatalities double 2012 figure
   “This is not a success story. The success will come                 In 2013, the number of cyclist deaths on roads rose
  This e-book is subject to the terms and conditions of a non-exclusive and non-transferable SITE LICENCE AGREEMENT between
  THE SPINNEY PRESS and: Rose Bay Secondary College, Dover Heights, katherine.efthimiou@det.nsw.edu.au
Issues in Society | Volume 389                                                                  Young Drivers and Road Safety          1
He says the challenge is greater education and
                                                                          awareness.
                                                                             “It’s not as simple as saying we need car drivers to be
                                                                          more observant of cyclists. It is a two-way street,” he said.
                                                                             “We need a better education program, not only for
                                                                          car drivers but for cyclists as well.”
                          37                                                 Mr Gay says there has not previously been a serious
                                                                          policy approach to this issue.
                                          272                                “It’s been pretty laissez faire in this area in the
      163                                                                 past,” he said.
                                                                             “We need to concentrate on it and if we need to
                              97                                          legislate, that’s one of the things we need to look at.”
                                              339                            NRMA spokesman Peter Khoury says there needs to
                                                                          be a continued focus on safer roads and driving.
                                                       7                     “If we’re looking at reducing the road toll further
                                         242                              there’s no single-bullet solution,” he said.
                                                                             “We need to continue to work on safer cars, safer
                                                   36                     roads and safer drivers.”
                                                                             Mr Khoury says there has been a lack of educational
                                                                          campaigns and planning around cycle paths and roads.
                                                                             “We’ve not done nearly enough to educate all road
  “If we’re looking at reducing the road toll                             users on how to share the road safely,” he said.
further there’s no single-bullet solution. We                                “We’ve not been strategic enough on how and where
     need to continue to work on safer cars,                              we build cycle paths, we’ve not tried hard enough to
               safer roads and safer drivers.”                            separate cyclists and road users.”
                                 NRMA spokesman Peter Khoury                    © ABC 2014. Reproduced by permission of the Australian
                                                                            Broadcasting Corporation and ABC Online. All rights reserved.

    to 14, double the number from 2012.                                              Taha, M and Bennett, G (8 July 2014). National road toll for
        “That’s a number we’re quite concerned about and                             2013 down on previous year, but cycling fatalities doubled.
    we’re working on,” Mr Gay said.                                                   Retrieved from www.abc.net.au/news on 22 August 2014.

          Road deaths in Australia: at a glance
          This Bureau of Infrastructure, Transport and Regional Economics report summary presents
          annual counts and rates for fatal road crashes and fatalities. The focus is on the last ten
          years of data including calendar year 2013.
     hh Over the last decade (to 2013), national annual fatalities decreased by 25 per cent, fatalities per population decreased by
          35 per cent, and annual fatal crashes decreased by 23 per cent. The decline in fatalities was weaker during the first half of
          the decade (9 per cent) but accelerated to 17 per cent over the last five years.
     hh   All jurisdictions achieved reductions in the annual fatality rate per population over the decade. The strongest falls were
          seen in New South Wales, Victoria, Tasmania and the Australian Capital Territory. The trends are not uniform, but with the
          exception of Queensland and Tasmania, all jurisdictions have seen rates fall significantly over the last three years.
     hh   The 65 years and over age group has the highest rate of annual fatalities per population. It accounts for 14 per cent of the
          population but 23 per cent of fatalities. The 17‑25 years age group also has a significantly higher than average rate. The
          trend rate of decrease over the decade for the 17‑25 age group however is strongest among all age groups at 8.2 per cent
          per annum.
     hh   Counts of all types of fatal crash are decreasing. Single vehicle crashes (no pedestrian involved) currently account for 47
          per cent of the total. Ten years ago the proportion was 44 per cent.
     hh   Vehicle occupants (drivers or passengers) account for 64 per cent of all fatalities (down from 71 per cent ten years ago).
          Motorcyclist fatalities now account for 18 per cent of fatalities (up from 12 per cent ten years ago).
     hh   Annual counts of fatal crashes involving articulated trucks have trended down at 3.5 per cent per year. The trend for heavy
          rigid involvement is a slightly weaker decline of 2.2 per cent per year.
                                          Commonwealth of Australia, Department of Infrastructure and Regional Development 2014.
                                                                   Bureau of Infrastructure, Transport and Regional Economics (BITRE) (2014).
                                         Road Deaths Australia 2013 Statistical Summary. Retrieved from www.bitre.gov.au on 27 August 2014.

    This e-book is subject to the terms and conditions of a non-exclusive and non-transferable SITE LICENCE AGREEMENT between
    THE SPINNEY PRESS and: Rose Bay Secondary College, Dover Heights, katherine.efthimiou@det.nsw.edu.au

2    Young Drivers and Road Safety                                                                          Issues in Society | Volume 389
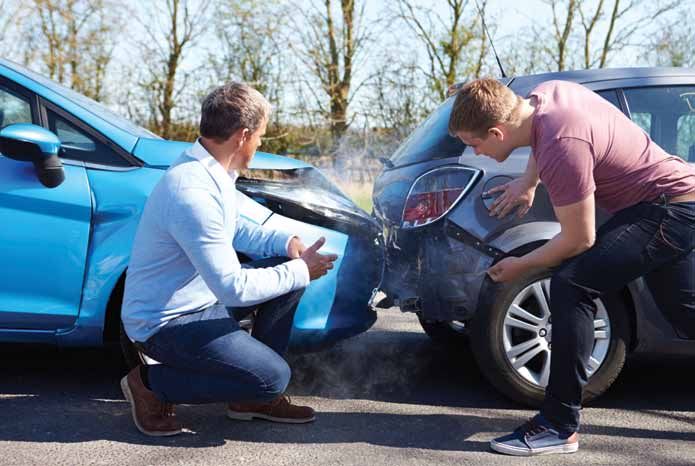
NOSE-TO-TAIL COLLISIONS ARE THE
NUMBER ONE CRASH ON AUSSIE ROADS
The latest AAMI Crash Index reveals parked car dings are on the rise. Nearly a
third of drivers blame distraction or loss of concentration for their accidents

A
       ussie drivers are finding themselves in nose-to-tail           Parked car dings however continue on an upward
       accidents more often than any other type of crash,          trend having risen from 15% in 2004 to 21.4% in this
       according to new data from leading national car             year’s Crash Index. According to AAMI spokesperson,
insurer, AAMI.                                                     Reuben Aitchison, with drivers taking to the roads for
    After studying almost 250,000 accident insurance               the holiday season that’s a worrying statistic.
claims between October 2012 and September 2013 for
the annual AAMI Crash Index, the five most common                     Aussie drivers are finding themselves in
types of accidents happening on our roads are:                        nose-to-tail accidents more often than any
                                                                      other type of crash, according to new data
#       MOST COMMON ACCIDENT TYPES                         %
                                                                      from leading national car insurer, AAMI.
1.      Nose to tail                                   27.8%
2.      Parked car dings                               21.4%           “Parked car dings are often a result of not driving
3.      Failed to give way                             20.5%       the car properly or paying attention to what’s going
                                                                   on around you. As we lead into the silly season, we
4.      Collision with a stationary object             14.7%
                                                                   urge all drivers to stay alert when behind the wheel,
5.      Collision while reversing                        11%       particularly during the Christmas period when we see
                                                                   a significant rise in the number of serious accidents and
    Previous Crash Index reports show that the incidence           minor prangs.”
of nose-to-tail collisions has remained stable for the                 AAMI’s research i has shown that alarmingly a
past decade, hovering between 27% and 29%. Failure to              third of drivers (28%) identified distraction or loss of
give way has come down steadily during this time from              concentration as a contributing factor in their crash,
23.1% in 2001 to 20.5% in the past 12 months.                      with men being the worst offenders (32%) compared to

  This e-book is subject to the terms and conditions of a non-exclusive and non-transferable SITE LICENCE AGREEMENT between
  THE SPINNEY PRESS and: Rose Bay Secondary College, Dover Heights, katherine.efthimiou@det.nsw.edu.au
Issues in Society | Volume 389                                                                  Young Drivers and Road Safety   3
AAMI’s data has also shown that almost half (46%) of
                                                                      drivers blame other drivers for the cause of their crash
                                                                      and nearly a quarter (23%) admit to being careless while
                                                                      behind the wheel.

                                                                        #      TOP 10 CONTRIBUTING FACTORS                               %
                                                                        1.     Other drivers                                          46%
                                                                        2.     Distraction/loss of concentration                      28%
                                                                        3.     Carelessness                                           23%
                                                                        4.     Bad weather                                            12%
                                                                        5.     Impatience                                             12%
                                                                        6.     Traffic congestion                                     10%
                                                                        7.     Bad roads/infrastructure                               10%
                                                                        8.     Fatigue                                                 6%
                                                                        9.     Speeding                                                6%
                                                                        10.    Animal on road                                          5%

                                                                             FOOTNOTES
                                                                      i. Newspoll Market and Social Research conducted an
                                                                         independent internet survey of 3,726 Australian drivers, 18
                                                                         years of age and older, across a full national sample in 2013.
                                                                         Data was collected in line with ISO – 20252 – Market, Social
                                                                         and Opinion Research and has been weighted with current
                                                                         ABS population demographics to ensure any extrapolation of
                                                                         results is representative of age, gender and area.

                                                                                          AAMI (2013). Nose-to-tail collisions are the number
    just under one in four women (24%).                                                  one crash on Aussie roads (Media release). Retrieved
       Mr Aitchison said: “Smart phones and technology                                         from www.aami.com.au on 1 September 2014.
    are major distractions for motorists and pose a serious
    safety issue on our roads. We know that many young
    drivers regularly read and send text messages, tweet,
    update their Facebook status and astonishingly even
    read ebooks while driving.

      A quarter of motorists have experienced an
      accident in the last five years. 71% say that
      accident was avoidable. Interestingly in the
      past five years most accidents occurred when
      vehicles were travelling at low speed (47%)
      or stationary (28%). Only 20% experienced
      accidents when travelling at high speed.
        “However, it doesn’t matter if you’re adjusting a Sat
    Nav or looking out the window, allowing yourself to be
    distracted and take your eyes off the road, even for a split
    second, is incredibly dangerous for you and everyone
    else on the road.”
        According to the AAMI Crash Index, a quarter of
    motorists have experienced an accident in the last five
    years. 71% say that accident was avoidable. Interestingly
    in the past five years most accidents occurred when
    vehicles were travelling at low speed (47%) or stationary
    (28%). Only 20% experienced accidents when travelling
    at high speed.
    This e-book is subject to the terms and conditions of a non-exclusive and non-transferable SITE LICENCE AGREEMENT between
    THE SPINNEY PRESS and: Rose Bay Secondary College, Dover Heights, katherine.efthimiou@det.nsw.edu.au

4     Young Drivers and Road Safety                                                                      Issues in Society | Volume 389
Road safety: modelling a global phenomenon
Executive summary from a Bureau of Infrastructure, Transport and Regional
Economics report which describes an approach for modelling the fatality
and injury rates for twenty-one countries around the world
Background
R
oad transport is the dom-
inant mode of transportation
around the world and a
vital link that brings people and
goods together. And yet, mobility
comes at a cost, one of which is
the exposure to the possibility of
death and injury on the road. The
statistical representations of that
risk are the fatality and injury rates
(the number of deaths and injuries
per billion vehicle kilometres
travelled).
This report describes an app-
roach for modelling the fatality and
injury rates for each of 21 countries
around the world. The models con-
structed allow an understanding of
the forces underlying the fatality and
injury rates in each of the countries
Road safety has in the past been achieved by a variety
covered, and also allow forecasts of of measures. Principal among these have been seatbelt
future trends in road safety – or its wearing, and speed and alcohol control (with lower legal
obverse, death and injury. limits and roadside testing).
Models were derived for Australia
(eight states/territories), Austria,
Belgium, Britain, Canada (ten prov- FIGURE ES1: FACTORS IN THE DECLINE
inces), the Czech Republic, Denmark, IN AUSTRALIA’S ROAD FATALITY RATE
50
Finland, France, Germany, Hungary,
45
Ireland, Israel, Japan, Korea, the
Netherlands, New Zealand, Norway, 40
Fatalities per billion safety-wgt vkt
Sweden, Switzerland and the 35
United States.
30
Patterns of road safety 25
in twenty-one countries 20
The basic finding of the research 15
is that fatality rates have trended
10
down as societies have become
motorised. Initially, the gain came 5
from adopting basic measures that 0
managed the growing traffic, things
20 5
20 5
20 7
20 9
20 1
20 3
20 5
20 7
20 9
20 1
20 3
27
29
19 5
19 5
19 7
19 9
19 1
19 3
19 5
19 7
20 9
20 1
20 3
67
19 9
19 1
19 3
19 5
19 7
19 9
19 1
19 3
0
0
1
1
1
1
1
2
2
2
6
8
8
8
9
9
9
9
9
0
0
0
6
7
7
7
7
7
8
8
20
19
19
as basic as stop signs, traffic lights,
Impact of seatbelts Impact of seatbelts + RBT Impact of seatbelts + RBT + speed cameras
lane separation – the list goes on. Impact of seatbelts + RBT + speed cameras + dummies Fatality rate
Then in the early 1970s it was the
turn of vehicle safety improvements, illustrated by Australia in Figure ES1. level of fatalities also varies with
the most important by far being Of course this is only a very the growth path of total traffic
the fitting and wearing of seatbelts. general pattern for the fatality rate. (itself dependent lately mainly on
Finally, in the 1980s onward came The 21 countries throw up a great population growth in a country).
the turn of enforcement, principally variety of patterns, depending Injury rates, while linked with
aimed at control of speed and on the timing of the principal movements in fatality rates, often
driver impairment. This pattern is determinants. The trend in the have their own sub-trends. Figure
This e-book is subject to the terms and conditions of a non-exclusive and non-transferable SITE LICENCE AGREEMENT between
THE SPINNEY PRESS and: Rose Bay Secondary College, Dover Heights, katherine.efthimiou@det.nsw.edu.au
Issues in Society | Volume 389 Young Drivers and Road Safety 5Beyond that, an understanding
of the challenges nations face in
trying to continue the downward
trends in death and injury is also
vital. As the main measures that
have been responsible for down-
ward movements in rates begin to
reach maximum effect, and traffic
continues to grow, the tendency
will be for flat to rising levels of
death and injury, unless previous
measures are ramped up and/or new
road safety measures are brought
into play.
An understanding of the trends
revealed by this report and of
the effects of the great variety of
measures in different nations, will
aid policy makers when planning
future road safety measures.
© Commonwealth of Australia,
Department of Infrastructure and
Regional Development 2014.
Although the fatality rate (a proxy for the general level Bureau of Infrastructure, Transport and
of road safety) explains a lot of the injury rate decline, Regional Economics (BITRE) (2014). Road
there is a recent independent upward movement in Safety – Modelling a Global Phenomenon
Report 141,Canberra ACT, pp. 1-3. Retrieved
the injury rate [in Australia]. from www.bitre.gov.au on 1 September 2014.
FIGURE ES2: AUSTRALIA’S ROAD
INJURY RATE VERSUS ITS FATALITY RATE
500
43
450
38
400
Fatalities per billion safety-wgt vkt
Injuries per billion injury-wgt vkt
33
350
28
300
23
250
18
200
150 13
100 8
50 3
0 -2
65
67
69
71
73
75
77
79
81
83
85
87
89
91
93
95
97
99
01
03
05
07
09
11
19
19
19
19
19
19
19
19
19
19
19
19
19
19
19
19
19
19
20
20
20
20
20
20
Injury rate Fatality rate
ES2 shows for Australia, that Conclusion
although the fatality rate (a proxy Road safety has in the past been
for the general level of road safety) achieved by a variety of measures.
explains a lot of the injury rate Principal among these have been
decline, there is a recent inde- seatbelt wearing, and speed and
pendent upward movement in the alcohol control (with lower legal
injury rate. However, the research limits and roadside testing). As these
on the 21 countries shows that rough measures will continue to apply in the
forecasts of injury rates can be made future, it is vital to establish beyond
from fatality rates. doubt their continuing importance.
This e-book is subject to the terms and conditions of a non-exclusive and non-transferable SITE LICENCE AGREEMENT between
THE SPINNEY PRESS and: Rose Bay Secondary College, Dover Heights, katherine.efthimiou@det.nsw.edu.au
6 Young Drivers and Road Safety Issues in Society | Volume 389INTERNATIONAL ROAD SAFETY
COMPARISONS: AT A GLANCE
This report summary presents tabulations of road deaths ROAD DEATHS PER 100,000
and road death rates for Organisation for Economic POPULATION – OECD NATIONS, 2012
Co-operation and Development (OECD) nations and
The number of road deaths per population is a measure of the
Australian states and territories. The rates allow for public health risk associated with road crashes.
a comparison of Australia’s road safety performance
with that of other OECD nations by accounting for TABLE 1: ROAD DEATHS PER 100,000
the differing levels of population, motorisation POPULATION – OECD NATIONS AND
and distances travelled. Courtesy of the Bureau of AUSTRALIAN STATES/TERRITORIES, 2012
Infrastructure, Transport and Regional Economics
Deaths per
•• In terms of annual deaths per 100,000 population Road Population 100,000
in 2012: Nation deaths (000s) population
Australia’s rate of 5.72 was the 16th lowest rate out Iceland 9 320 2.82
of the 33 nations with available data. The nations United Kingdom 1,802 63,705 2.83
with the two lowest rates were: Norway 145 5,019 2.89
–– Iceland 2.81 Denmark 167 5.592 2.99
–– United Kingdom 2.83 Sweden 285 9,519 2.99
B
Israel 263 7,911 3.32
etween 2003 and 2012, the annual population- Netherlands 562 16,755 3.35
standardised risk of a road crash fatality in Ireland 162 4,587 3.53
Australia declined by a total of 30.5 per cent. Mexico 4,539 117,054 3.88
Over the same period the OECD median rate fell by Japan 5,237 127,515 4.11
38.9 per cent. The rates for all Australian jurisdictions Spain 1,903 46,147 4.12
decreased by between 5 per cent (Australian Capital Switzerland 339 7,955 4.26
Territory) and 45 per cent (South Australia). Germany 3,600 81,932 4.39
Finland 255 5,414 4.71
Between 2003 and 2012, the annual population- Turkey 3,750 75,176 4.99
standardised risk of a road crash fatality in Australia 1,299 22,710 5.72
Australia declined by a total of 30.5 per cent. France 3,653 63,519 5.75
median 5.75
Over the same period the OECD median rate Canada 2,104 34,880 6.03
fell by 38.9 per cent. Hungary 605 9,920 6.10
Italy 3,653 59,540 6.14
Austria 531 8,430 6.30
Slovenia 130 2,057 6.32
Luxembourg 34 531 6.40
Slovak Republic 352 5,408 6.51
Portugal 718 10,515 6.83
Belgium 767 11,128 6.89
New Zealand 308 4,433 6.95
Czech Republic 742 10,509 7.06
Greece 984 11,090 8.87
Poland 3,571 38,534 9.27
United States 33,561 313,914 10.69
Korea 5,392 50,004 10.78
Chile 1,980 17,403 11.38
ACT 12 375 3.20
VIC 282 5,633 5.01
NSW 369 7,307 5.05
SA 94 1,656 5.68
TAS 31 512 6.05
QLD 280 4,568 6.13
WA 182 2,438 7.47
NT 49 236 20.77
This e-book is subject to the terms and conditions of a non-exclusive and non-transferable SITE LICENCE AGREEMENT between
THE SPINNEY PRESS and: Rose Bay Secondary College, Dover Heights, katherine.efthimiou@det.nsw.edu.au
Issues in Society | Volume 389 Young Drivers and Road Safety 7FIGURE 1: ROAD DEATHS PER 100,000 POPULATION
– OECD NATIONS AND AUSTRALIAN STATES/TERRITORIES, 2012
Iceland
United Kingdom
Norway
Denmark
Sweden
Israel
Netherlands
Ireland
Mexico
Japan
Spain
Switzerland
Germany
Finland
Turkey
Australia
France
median
Canada
Hungary
Italy
Austria
Slovenia
Luxembourg
Slovak Republic
Portugal
Belgium
New Zealand
Czech Republic
Greece
Poland
United States
Korea
Chile
ACT
VIC
NSW
SA
TAS
QLD
WA
NT
0 6 12 18 24
Deaths per 100,000 population, 2012
•• In terms of annual deaths per 10,000 registered •• In terms of annual deaths per 100 million vehicle-
vehicles in 2012 : kilometres-travelled in 2012:
Australia’s rate of 0.78 was the 14th lowest rate out Australia’s rate of 0.56 was the 12th lowest rate out
of the 30 nations with available data. The nations of 20 nations with available data. The nations with
with the two lowest rates were: the two lowest rates were:
–– Iceland 0.34 –– Iceland 0.29
–– Norway 0.39 –– Norway 0.33
Annual road deaths in Australia relative to Between 2003 and 2012, Australia’s rate declined by a
total of 29.0 per cent whilst the OECD median declined
vehicle ownership declined between 2003 by 43.3 per cent.
and 2012 by a total of 37.0 per cent. During For Australian jurisdictions, the reductions ranged
this period the median rate for OECD from 2 per cent (Australian Capital Territory) to 42 per
nations declined by 49.2 per cent. cent (South Australia).
Annual road deaths in Australia relative to vehicle © Commonwealth of Australia, Department of
Infrastructure and Regional Development 2014.
ownership declined between 2003 and 2012 by a total of
37.0 per cent. During this period the median rate for OECD
Bureau of Infrastructure, Transport and Regional Economics
nations declined by 49.2 per cent. Australian jurisdictions (BITRE) (2014). Statistical Report – International road safety
achieved reductions of between 13 per cent (Australian comparisons 2012, BITRE, Canberra ACT, pp. iii, 1-2. Retrieved
Capital Territory) and 49 per cent (South Australia). from www.bitre.gov.au on 1 September 2014.
This e-book is subject to the terms and conditions of a non-exclusive and non-transferable SITE LICENCE AGREEMENT between
THE SPINNEY PRESS and: Rose Bay Secondary College, Dover Heights, katherine.efthimiou@det.nsw.edu.au
8 Young Drivers and Road Safety Issues in Society | Volume 389Community attitudes to road safety
Executive summary from a report which documents the findings from a major
survey by the Department of Infrastructure and Regional Development
T
his is the twenty-third in the on a mobile (14% in 2011), and 22% alcohol (38%) or restricting what
long running Community driver fatigue (22% in 2011). For they drink (39%). The practice of
Attitudes Survey program. comparisons over time, refer to the restricting alcohol intake when
The main purpose of the research is time series data in Appendix 2 of driving (as distinct from abstaining)
to monitor attitudes to a variety of the report. is more common among males
road safety issues, evaluate specific (41%) than females (36%), a finding
road safety countermeasures, sugg- ALCOHOL AND consistent with previous years. This
est new areas for intervention and DRINK DRIVING approach to drink driving is also
identify significant differences Random breath testing (RBT) more common among those aged
between jurisdictions. Community support for RBT 25 to 59 years than either younger or
The in-scope population for the continues to be nearly universal, older drivers. Nearly four out of ten
survey is persons aged 15 years and with 96% in agreement with the (39%) provisional car licence holders
over. Interviews were conducted in random breath testing of drivers and 33% of 15 to 24 year olds indicate
October and November 2013 using (and 82% in strong agreement). that they don’t drink at any time.
Computer Assisted Telephone Thirty-three per cent of the Active drivers in Western Aust-
Interviewing (CATI) technology community feel the level of RBT has ralia and the Northern Territory
and a Random Digit Dialling (RDD) increased in the last two years. This showed a similar pattern, with
sampling frame comprising of both outcome shows a decline from the respondents being significantly
landline and mobile sample. A total 2011 result of 40%. more likely to modify their drink-
of 1,500 interviews were conducted ing behaviour when driving (85%
and the average interview length When asked to nominate the and 84% respectively) and signifi-
was 16 minutes. The response rate factor that most often leads cantly less likely to not drink at all
(completed interviews divided by all to road crashes, 31% mention (15% and 16%).
contacts, excluding those ‘away for Three per cent of active drivers
survey period’) was 65%.
speed, 18% inattention/lack said it was either very likely or fairly
A summary of the main findings of concentration, 11% drink likely that they had driven when over
from the 2013 survey, along with a driving, 8% driver distraction/ the blood alcohol limit in the last
description of emerging trends and driving while on a mobile and 12 months (down from 4% in 2011
patterns, is provided below. More 7% driver fatigue. and 2009).
detailed results are provided in the
main body of the report. More than three-quarters of the Awareness of standard
in-scope population (81%) had seen drinks and alcohol
MAIN FINDINGS police conducting random breath consumption guidelines
Factors perceived to tests in the last six months (similar Community knowledge regard-
contribute to road crashes to 2011 with 80%). In addition, 35% of ing the number of standard drinks
The Australian community the community report having been in everyday volumes of alcohol
continues to identify speed as the breath tested in the previous six is varied, with nearly two-thirds
factor which most often leads to road months, in line with the 2011 result of all respondents interviewed
crashes. When asked to nominate of 37% however a marked increase accurately identifying the number
the factor that most often leads to on results in previous years. of standard drinks in a stubby/can
road crashes, 31% mention speed, of full strength beer, yet only just
18% inattention/lack of concentra- Self-reported drink under a third correctly identified
tion, 11% drink driving, 8% driver driving behaviour the number of standard drinks in a
distraction/driving while on a The self-reported drink driving 750 ml bottle of wine.
mobile1 and 7% driver fatigue. behaviour of motorists shows that The proportion of beer drinkers
When asked to nominate up 39% of ‘active drivers’2 restrict what able to accurately identify the
to three factors that lead to road they drink when driving (38% in number of standard drinks in a
crashes, 48% of respondents included 2011), 38% don’t drink at all when stubby/can of full strength beer3 was
speed in their response (compared driving (down from 43%) and 23% similar to 2011 at 64% (compared
with 54% in 2011), 42% drink driving don’t drink at any time (up from 19%). with 66% in 2011), while the propor-
(47% in 2011), 29% inattention/lack Most (76%) ‘active drivers’ modify tion that underestimate the volume
of concentration (26% in 2011), 22% their drinking behaviour when of alcohol in a stubby/can of full
driver distraction/driving while driving, either by abstaining from strength beer, thereby being at
This e-book is subject to the terms and conditions of a non-exclusive and non-transferable SITE LICENCE AGREEMENT between
THE SPINNEY PRESS and: Rose Bay Secondary College, Dover Heights, katherine.efthimiou@det.nsw.edu.au
Issues in Society | Volume 389 Young Drivers and Road Safety 9greater risk of over-consumption, approve of such a change, while 39% pedestrian activity, such as shopping
is 12% (compared with 11% in 2011). (24% strongly disapprove, 15% some- areas. Residents of South Australia
The proportion of wine drinkers what disapprove) would disapprove. were significantly less likely to
able to correctly nominate the One in five (19%) did not care if strongly agree with this proposi-
number of standard drinks in a the blood alcohol limit was reduced, tion (53%).
750 ml bottle of wine4 is slightly indicating that more than half (58%) Respondents were also asked
up on previous results (30% in of all respondents interviewed about the promotion of speed in
2013, compared with 27% in 2011). would not disapprove of this change. television commercials for new cars.
The proportion of wine drinkers Just under half (47%) felt that there is
who underestimated the alcohol SPEED too much emphasis on speed in car
content of a bottle of wine was 55% Selected attitudes to advertisements, with 27% strongly
(61% in 2011). speed and speed regulation agreeing with this view.
The areas of greatest change
Only 44% of females have regarding attitudes to speeding Perceived acceptable
accurate knowledge of the a n d s p e e d e n fo rc e m e nt a re and actual speed tolerances
detailed below: A large proportion of the comm-
number of standard drinks
•• Fifty-four per cent of the unity (52%) supports quite strict
they can have in the first speed enforcement (nominating
community agree with the view
hour and remain under the that speeding fines are mainly speeds of 60-64 km/h as acceptable).
legal blood alcohol limit. intended to raise revenue, a result The most common views are that
that is significantly less than the only speeds of 60 km/h and below
Sixty-four per cent of males 2011 level of agreement (62%). are acceptable (31% of the in-scope
made a safe assumption regarding •• Those that agreed that “If you population), and that 65 km/h is an
the number of standard drinks they increase your driving speed by acceptable speed for someone to
can have in the first hour while 10 kilometres per hour you are drive in a 60 km/h zone in an urban
remaining under the 0.05 blood significantly more likely to be area without being booked (also 31%).
alcohol concentration (BAC) limit, involved in an accident” has shown In contrast, only 15% think speeds
with 50% correctly identifying two a decrease (70% in 2011; 66% in above 65 km/h should be tolerated.
standard drinks and a further 14% 2013). When looking at perceptions as
of the view that they can have one •• The level of agreement with the to what speed is actually permitted,
standard drink or less in the first statement that “an accident at 70 18% of the adult community think
hour. By comparison, only 44% of km/h will be a lot more severe than that zero tolerance is applied in
females have accurate knowledge of an accident at 60 km/h” declined urban 60 km/h zones. Some 18% of
the number of standard drinks they from 92% in 2011 to 89% for the people (compared with 17% in 2011)
can have in the first hour and remain current reporting period. believe that speeds greater than 65
under the legal blood alcohol limit. km/h will be tolerated without a
The published guidelines stip- The following results have speeding fine being issued, with 7%
ulate that to remain under 0.05 BAC, tended to be more stable over of those nominating speeds of 70
men should limit their consumption time regarding attitudes to speed km/h or higher.
of alcohol to two standard drinks in enforcement and speeding: In relation to rural 100 km/h
the first hour and one standard drink •• The proportion of the comm- zones, 25% of the population are of
in each hour after that, while women unity in 2013 who consider “it is the view that no speed in excess of
should consume no more than one okay to exceed the speed limit if you 100 km/h is acceptable. A further
standard drink in each hour they are are driving safely” (31%) is higher 30% supported speeds of 101-105
drinking. Seventy-one per cent of than in 2011 (28%) and closer to km/h and 4% supported speeds of
males (compared with 63% in 2011) levels reported in the late nineties 106-109 km/h. The most common
and 56% of females (compared with and early 2000s. view (held by 29% of the in-scope
40% in 2011) made a safe assumption •• Seventy-nine per cent feel that population) is that 110 km/h is an
about both parts of these guidelines. speed limits are generally set acceptable speed for someone to
at reasonable levels. This result drive in a 100 km/h zone in a rural
Support for reducing is similar to 2011 (81%) and has area without being booked, while 9%
the blood alcohol limit remained fairly steady in recent think speeds above 110 km/h should
Respondents were asked how times. be tolerated.
they feel about suggestions that When asked what speeds are
the general blood alcohol concentr- In response to a question about actually permitted in rural 100 km/h
ation (BAC) limit should be lowered the use of low speed limits, the zones, 15% believe that the limit is
from 0.05 to 0.02. Overall, 38% (23% majority of respondents (63%) strictly enforced (compared with 13%
strongly approve, 16% somewhat strongly supported limits of 40 in 2011), while 37% nominated speeds
approve) of people said they would km/h or lower on streets with high of 101 to 105 km/h, and a further
This e-book is subject to the terms and conditions of a non-exclusive and non-transferable SITE LICENCE AGREEMENT between
THE SPINNEY PRESS and: Rose Bay Secondary College, Dover Heights, katherine.efthimiou@det.nsw.edu.au
10 Young Drivers and Road Safety Issues in Society | Volume 38928% nominated speeds up to 110
km/h. The most common responses
when looking at perceived actual
speed tolerances in 100 km/h zones
in rural areas were 21% suggesting
driving at 105 km/h was permitted
and 20% suggesting driving at 110
km/h permitted.
Perceived changes
in speed enforcement
Sixty-two per cent of respon-
dents are of the view that the level
of speed limit enforcement has
increased in the last two years, 26%
feel it has stayed the same and just
5% feel the amount of speed limit
enforcement has decreased, and
there were 7% offering ‘don’t know’
as a response.
The incidence of drivers booked
for speeding in the last two years
(20%) and the last six months penalties should be made less severe reporting having ever fallen asleep
(8%) shows significant increases and 56% opt for no change to the while driving is 13% for the current
on findings in 2011 (16% and 5% current penalties. reporting period. This result is in
respectively). Just over one-third (36%) strongly line with the time series data back to
approved of the use of point-to- 2001 (with the exception of the 2004
Full motorcycle licence point speed enforcement cameras result which showed an incidence
holders recorded a higher on main roads (equating to 66% of just 10%).
incidence of being booked total approval). Strong approval was As was the case in previous years,
for speeding than any significantly lower amongst motor- the current survey suggests a degree
other licence holder type cycle licence holders (23%), residents of recidivism, in that of those who
within the last two years. of the Northern Territory (25%) and have ever fallen asleep while driving5,
frequent distance drivers (28%). 42% have done so more than once
Full motorcycle licence holders and 24% on three or more occasions.
recorded a higher incidence of being Self-reported For 12% of those who have fallen
booked for speeding than any other speeding behaviour asleep while driving, the most recent
licence holder type within the last The proportion of recent drivers episode resulted in a road accident.
two years (36%) and within the last (current drivers and those that have
six months frequent distance drivers driven in the last two years) who OTHER ISSUES
(15%) were significantly more likely report ‘always’, ‘nearly always’ or Seatbelt wearing
to be booked. ‘mostly’ driving at 10 km/h over Over 1 in 6 respondents (16%)
the speed limit (5% in 2013) has are of the view that the level of
Attitudes to speed significantly increased since 2011 enforcement of compulsory seatbelt
enforcement and (3%). However, this result is still wearing has increased over the last
speeding penalties dramatically lower than the mid two years, 50% think it is unchanged,
Overall, 36% (compared with 35% 1990s peak of 17% in 1995. There has 5% feel as though there has been a
in 2011) of the in-scope population been quite a significant increase in decrease and 29% don’t know.
support an increased amount the proportion of full motorcycle The proportion of people aged
of speed limit enforcement, 13% licence holders (17% for 2013) and 15 years and over that always wear
support a decrease (up from 12% in heavy vehicle licence holders (12% a seatbelt when travelling in the
2011) and 48% want no change (on for 2013) who ‘always’, ‘nearly always’ front seat of a car (97% in 2013) has
par with 2011 at 50%). or ‘mostly’ drive at 10 km/h over remained steady at between 95% and
A quarter of respondents (25%) the speed limit, compared to the 97% since 1993. The gap between
are in favour of making the penalties previous reporting period (4% and seatbelt wearing in the front and
for exceeding the speed limit more 2% respectively). rear seats has closed in the last few
severe. The current year result is years, from four percentage points
comparable to the 2011 result of DRIVER FATIGUE in 1993 to one percentage point for
24%. A further 13% believe speeding The incidence of drivers the current period.
This e-book is subject to the terms and conditions of a non-exclusive and non-transferable SITE LICENCE AGREEMENT between
THE SPINNEY PRESS and: Rose Bay Secondary College, Dover Heights, katherine.efthimiou@det.nsw.edu.au
Issues in Society | Volume 389 Young Drivers and Road Safety 11Mobile phone usage included a question to measure Territory to 58% in Victoria. In
CAS 23 is the sixth survey in the whether people thought that their terms of year-on-year change at the
series that asks about the use of chances of having an accident state/territory level, Tasmania is
mobile phones when driving. would increase if they were using the only state that saw a significant
Nine in ten active drivers (91%) a mobile phone while driving. change in perceptions of speed as a
have a mobile phone and 61% report Results show that the majority (82% contributing factor in road crashes
that they use a mobile phone while of respondents) believed this to be (decreasing from 62% in 2011 to 50%
driving (59% in 2011). the case, a significant decrease from for the current period).
86% in 2011. The perception of drink driving
With the exception of reading as a contributing factor in road
text messages (result virtually When asked to nominate crashes (42% nationally) ranges from
unchanged), other mobile phone up to three factors that lead a low of 35% in New South Wales
usage measures among active to road crashes, 48% of to the significantly higher results
drivers, have increased since these respondents included speed of 54% in Victoria and 70% in the
questions were last asked in 2011: in their response, 42% drink Northern Territory, where drink
•• 56% answered calls while driving, 29% inattention/ driving tends to be the dominant
driving (54% in 2011) perceived cause of road crashes.
lack of concentration, 22% The increase in the nomination
•• 35% made calls (27% in 2011)
•• 32% read text messages
driver distraction/driving of ‘inattention/lack of concentra-
(31% in 2011), and while on a mobile, and 22% tion’ as a contributing factor in road
•• 18% sent text messages driver fatigue. crashes (up from 26% to 29%) seems
(14% in 2011). mainly attributable to the significant
STATE/TERRITORY AND increases in Western Australia (up
The last five surveys have included REGIONAL COMPARISONS from 33% to 46%), while Queensland
a question measuring attitudes Factors perceived to (down from 27% to 21%) and South
in relation to the hypothetical contribute to road crashes Australia (down from 45% to 39%)
introduction of a new law banning There is a degree of variability both recorded decreases.
the use of hands-free mobile phones across the states and territories Mentions of ‘driver distraction/
while driving. This hypothetical law and across capital city/non-capital driving while on a mobile,’ which
attracted 34% community support city locations when it comes to has only been coded as a separate
(a significant decrease from 39% views about the leading causes of response since the 2011 survey, have
in 2011). There was a significantly road crashes. While at the national also increased (from 14% to 22%).
higher proportion of respondents level total mentions of speed as a The Northern Territory reported the
opposed to such a law (49%) than contributing factor in road crashes lowest result of 8% (down from 14%
there was in favour of it. remains high at 48%, this result in 2011) and Queensland reported a
The last three surveys have ranges from 40% in the Northern significant increase from last year
(25% for 2013 compared to 18%
for 2011).
The proportion of the comm-
unity mentioning ‘driver fatigue’
as a contributing factor in road
crashes remain similar to the last
survey (up from 21% to 22%). Across
all state and territories, results
ranged from 9% in Tasmania to
28% in the North Territory.
Alcohol and drink driving
Support for RBT remains
extremely high (96% nationally,
down from 98% in 2011). There were
a number of significant differences
across the states and territories
with both Tasmania and the ACT
reporting 100% support and Western
Australia only 91% support.
The perceived level of RBT
activity does, however, show some
state/territory variations. Only 25%
This e-book is subject to the terms and conditions of a non-exclusive and non-transferable SITE LICENCE AGREEMENT between
THE SPINNEY PRESS and: Rose Bay Secondary College, Dover Heights, katherine.efthimiou@det.nsw.edu.au
12 Young Drivers and Road Safety Issues in Society | Volume 389of residents from Tasmanian and booked within the last six months perceived importance of different
the ACT respondents are of the view (compared with 8% nationally). factors in contributing to road
that RBT activity has increased over crashes. For example, while 48% of
the last two years compared with In terms of attitudes to speeding the community as a whole nominate
33% nationally. Sixteen per cent of and speed limit enforcement, the speed as the factor that most often
residents of the ACT and 19% of following state/territory differences causes road crashes, 15 to 24 year olds
Tasmanians are of the view that the were noted: are more likely to nominate drink
level of RBT activity has decreased •• Residents of Western Australia driving (48%) than speed (29%).
over the last two years, compared are less likely (44%, compared
with 10% nationally. At the other with 54% overall) to be of the Alcohol and drink driving
end of the scale only 7% of Northern view that ‘fines for speeding Consistent with the results of
Territory and 8% of Victorians and are mainly intended to raise recent years, a significantly higher
South Australians residents share revenue’. There is also greater proportion of males (39%) than
this view. acceptance in Tasmania of the females (31%) report having had a
In terms of RBT visibility, link between speeding and road random breath test in the last six
Tasmanians were the least likely to crashes irrespective of whether months. This result is likely to be
report having seen RBT in operation you are driving safely (20% associated with the different driving
in the last six months (63% compared compared with 31% nationally). patterns of males and females, and is
with 81% nationally) and NSW •• There is also a signif icant supported by the fact that frequent
residents the most likely (87%). difference in the view that ‘speed distance drivers and commuters
South Australians were the limits are generally reasonable’ (both predominantly male groups)
least likely to report having been with 88% of ACT residents also report being more likely to have
personally tested in the last six concurring with the statement seen RBT in operation and to have
months (21% compared with 35% compared with 79% nationally. been personally tested.
nationally) and Victorian residents When exposure to RBT activity
the most likely (39%). There are significant gender is considered by age group, it
Sixty-four per cent of the in-scope differences in relation to appears that those aged 60 years
population made a safe assumption speeding. Males are more or over, (who tend to spend less
about the number of standard drinks time driving), are less likely to have
likely than females to have
they could have in both the first hour seen RBT activity (73% versus 81%
and subsequent hours. Differences
been booked for speeding overall) and are also less likely to
across the states/territories were in the last two years. have had their breath tested in the
evident with only 52% of Victorians previous six months (30% versus
displaying an accurate knowledge of •• Residents of Victoria are more 35% overall).
the guidelines (significantly less than likely to agree that ‘if you increase With respect to drink driving
the population) compared with 68% your driving speed by 10 km/h behaviour, females (40%) are more
of those from the ACT and 66% of you are significantly more likely likely than males (36%) to say they
Western Australian residents. to be involved in an accident’ abstain from drinking when driving.
(71% compared with 66% overall), Males are more likely to claim that,
Speed Tasmanians also shared similar when driving, they restrict how
There is some variation in views (70%). much they drink (41% compared
perceptions across the states and •• To the extent that these attitudes with 36% of females). Similarly,
territories regarding changes in may be reflected in driving 47% of 15 to 24 year olds say they
speed limit enforcement activity. behaviour, it is interesting to note don’t drink when driving, compared
The perception that there has that 8% of those who reside in with 38% overall and 33% of 15 to 24
been an increase in speed limit New South Wales report ‘always, year olds don’t drink at any time
enforcement in the last two years nearly always or mostly’ driving compared to 23% overall.
(62% nationally, similar to the last at 10 km/h over the speed limit, Seventy-one per cent of males
survey with 64%) is most common in compared with only 1% in South and 56% of females made a safe
Queensland (75%) and least common Australia, which is significantly assumption about the number of
in Tasmania (44%). lower than the national result standard drinks they can have in
In terms of state and territory (5%). both the first hour and subsequent
comparisons, Western Australians hours. A likely reason for this differ-
(26%) and Victorians (24%) are more DEMOGRAPHIC ence is the higher proportion of
likely to report having been booked COMPARISONS females who don’t drink at all when
for speeding in the last two years Factors perceived to they drive and therefore do not need
(compared with 20% nationally); contribute to road crashes to draw on an accurate knowledge of
while Western Australians residents There is some variation across the BAC guidelines to modify their
(13%) are more likely to have been the population as to the relative drinking behaviour when driving.
This e-book is subject to the terms and conditions of a non-exclusive and non-transferable SITE LICENCE AGREEMENT between
THE SPINNEY PRESS and: Rose Bay Secondary College, Dover Heights, katherine.efthimiou@det.nsw.edu.au
Issues in Society | Volume 389 Young Drivers and Road Safety 13been used.
2. Current licence holders who drive a
vehicle.
3. 1.4 or 1.5 standard drinks.
4. Between 7 and 8 standard drinks.
5. Please note this analysis is based on a
relatively small sample size of 181.
© Commonwealth of Australia 2014.
Department of Infrastructure and Regional
Development (2014). Community Attitudes to
Road Safety – 2013 Survey Report, pp. v-xiii.
Retrieved from www.infrastructure.gov.au
on 1 September 2014.
Females are also much more is okay if driving safely, and less
likely to say they definitely have not likely to think that speed limits are
driven over the blood alcohol limit in generally reasonably set.
the last 12 months than males (86% The driving behaviour of older
and 71% respectively) compared with respondents (that is, those aged 60
78% overall. years and over) is quite different to
other age groups. Forty per cent
Speed of those aged 60 years and over
There are significant gender (compared with 30% overall) report
differences in relation to speeding. never driving at 10 km/h or more
Males are more likely than females over the speed limit. There is also
to have been booked for speeding a difference in their attitudes to
in the last two years (26% for males speeding: they are much more likely
compared with 14% for females) and to support zero tolerance speed
in the last 6 months (10% for males limit enforcement and more likely
compared with 5% for females). to support an increase in penalties
Males are also less likely to for speeding.
support a zero tolerance approach to
Further information can be obtained
speed limit enforcement in 100 km/h
through the Australian Government
zones in rural areas (19% for males Department of Infrastructure and
compared with 30% for females) and Regional Development at www.
less likely to support an increase in infrastructure.gov.au
the level of speed limit enforcement
(30% compared with 42%) or an NOTES
increase in the severity of penalties 1. ‘Driver distraction/driving while
on a mobile’ has been coded as a
(20% for males compared with 30%
separate response since the 2011
for females). survey. Previously such responses
By extension males are less likely were included as part of ‘inattention/
to see the nexus between increased lack of concentration’. For time series
speed and involvement in an acci- comparisons later in this report, a
dent, more likely to think speeding composite of the two responses has
This e-book is subject to the terms and conditions of a non-exclusive and non-transferable SITE LICENCE AGREEMENT between
THE SPINNEY PRESS and: Rose Bay Secondary College, Dover Heights, katherine.efthimiou@det.nsw.edu.au
14 Young Drivers and Road Safety Issues in Society | Volume 389You can also read


