2020 ASPEN-NICHOLAS WATER FORUM - Water Affordability and Equity Briefing Document Lauren A. Patterson and Martin W. Doyle - Nicholas Institute ...
←
→
Page content transcription
If your browser does not render page correctly, please read the page content below

NICHOLAS INSTITUTE
FOR ENVIRONMENTAL POLICY SOLUTIONS

2020 ASPEN-NICHOLAS WATER FORUM
Water Affordability and Equity Briefing Document
Lauren A. Patterson and Martin W. Doyle

  Nicholas Institute for Environmental Policy Solutions   nicholasinstitute.duke.edu
2020 ASPEN-NICHOLAS WATER FORUM
Water Affordability and Equity Briefing Document

 CONTENTS
 1. Introduction                                                3
 2. Water Equity                                                4
     Water as a Public Good, a Commodity, and a Right           4
     What Is Equity?                                            7
     What Is Water Equity and Why Is It Imperative?             8
 3. Tracing Water Inequity through Time                         8
     Industrial Era (1800s)                                     8
     Environmental Paradigm (1970s)                            11
     Environmental Justice Paradigm (1980s)                    12
     Agricultural Communities                                  13
 4. Water Inequity Today                                       14
     Current Challenges                                        15
 5. Paying for Infrastructure: Questions of Affordability      20
     Utility Affordability                                     21
     Household Affordability                                   23
 6. Getting to Water Equity                                    26
     Declare a Human Right to Water                            26
     Emphasize Public Health                                   27
     Develop and Fully Fund a National Infrastructure Agenda   28
     Water Democracy: Build Trust and Empower Communities      29
     Design Multi-Benefit Solutions                            30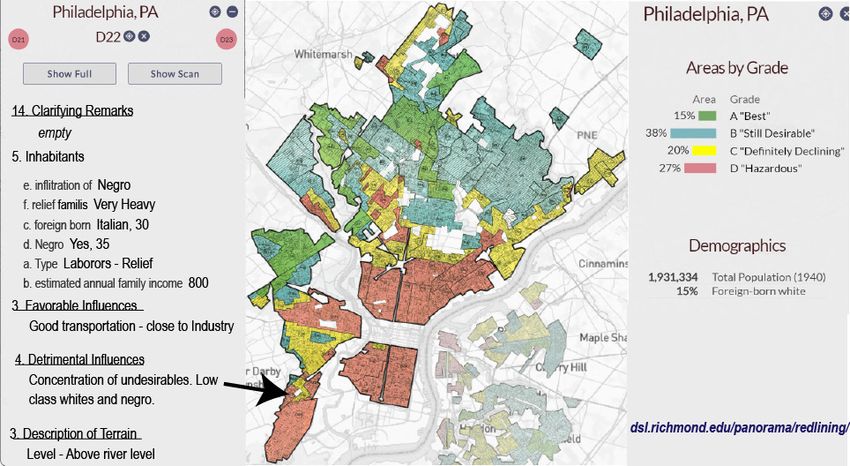
1. INTRODUCTION
    Water is essential to life—the life of a city as well as the life of a human being. Without water, a
    man dies. Without water, a community faces the same fate.
    –Leonard A. Scheele, Surgeon General (1952)
Without water, we cannot fight a global pandemic. COVID-19 is reorganizing life as we know it,
revealing deep, systemic fault lines in our society, and further exacerbating health and financial
disparities across racial, gender, and geographic lines. Water utilities are not immune to these
significant impacts from COVID-19, and this moment of disruption offers an opportunity to look
with an even closer eye at the inequalities in the sector and to envision what a better future might
look like.
Widespread impacts from COVID-19 began in the United States in March of 2020 with stay-
at-home orders kick starting a deep economic recession. The pandemic has worsened already
existing financial challenges as utilities, large and small, have responded with shutoff moratoria,
experienced changes in residential water use, and lost commercial customers, all while working
to ensure the operational resilience of the utility and trying to keep their workforces healthy.
Meanwhile, consumers are overwhelmingly experiencing greater strain to pay their bills
as unemployment has dramatically increased. The pandemic amplifies the significance of
conversations around the financial resiliency of water and wastewater services and household
affordability.
The importance of water and sanitation for public health is once again visible and may change the
trajectory of the water sector moving forward. Given that water is essential for public health, what
must be done to ensure that these life-sustaining services are affordable and accessible to all
and the utilities providing services are financially resilient? How do we reconcile the different
values as individuals and society negotiate who decides, who gets what, and who pays. In a just
society this process is inclusive, meaning all have a seat at the table.
To unpack these questions, we will explore the evolution of water services in the United States.
The construction of water and wastewater systems during the 19th and early 20th century were
significant feats. Now, most people have access to water, most tap water is drinkable, most dams
are secure, most farms can grow more with less water, and most rivers are cleaner than they were
50 years ago. Most does not mean all. There is growing evidence that an increasing number of
Americans are losing access to safe drinking water and sanitation—and others never had it at all.
Nearly two million Americans lack access to complete plumbing facilities, particularly in tribal
communities, border colonias, and rural areas.1 Within cities, those who can access water may
not be able to afford rising water service rates, resulting in water shutoffs. Shutoffs then create a
cascade of additional challenges and hardships for individuals, including possible evictions or
even removal of children from the household. While the Detroit bankruptcy and ensuing water
shutoff crisis received significant attention, loss of water services are becoming a more common
reality in many cities with declining populations including Chicago, Cleveland, Milwaukee,

1. DigDeep & U.S. Water Alliance. 2019. Closing the water access gap in the United States.

                                      Nicholas Institute for Environmental Policy Solutions, Duke University | 3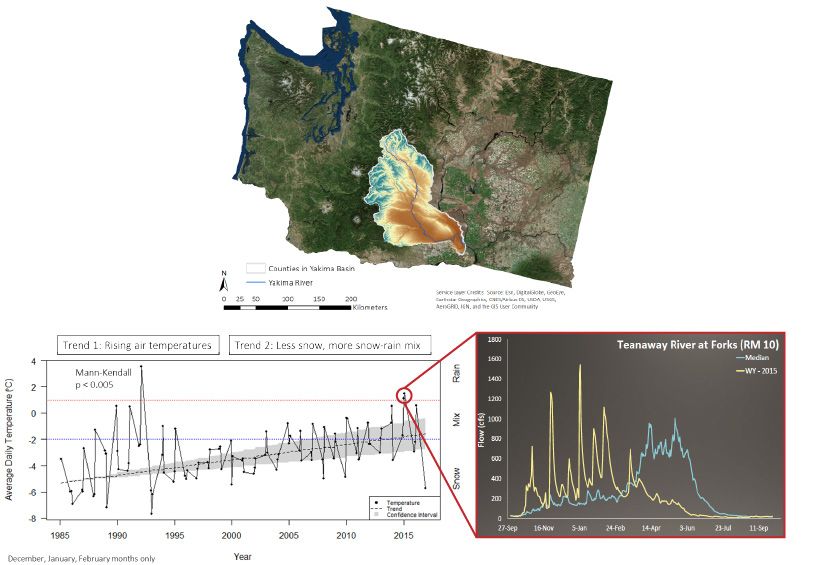
and Philadelphia.2 In these cities and beyond, affordability and accessibility challenges are
concentrated in underserved communities, which are often also exposed to chronic pollution
(e.g., Lowndes County, AL) or dependent on unsafe tap water (e.g., Flint, MI and Camden, NJ).
These challenges extend beyond water utilities. There is growing disparity in the ability of
different communities and sectors (agricultural, municipalities, and industries) to secure and/or
afford water rights (i.e., the right to divert, store, and make use of water resources). For example,
as groundwater levels in aquifers have declined, the costs to pump groundwater have increased,
resulting in some farms and communities being unable to afford to drill the now necessarily
deeper wells during recent western droughts (2011–2017 drought in CA3). In the Chesapeake
Bay, increased nutrient runoff and pollution is driving utilities such as D.C. Water and Hampton
Roads Sanitation District to invest billions in capital infrastructure to address consent decrees
from the Clean Water Act.4
Awareness of these inequalities coupled with aging infrastructure and the disproportionate
impacts of climate change on communities and sectors have brought water equity and
affordability to the forefront of many conversations about the future of water sustainability.
COVID-19, along with heightened awareness of racial disparities following the murder of George
Floyd, have further brought a magnifying lens to these issues. The 2020 virtual seminars and
2021 Aspen-Nicholas Water Forum will explore what underlying principles are essential to
address equity and affordability.

2. WATER EQUITY
     What are our priorities as a nation? What good are other rights to someone dying of cholera or
     thirst? –Rhett B. Larson (2017)

Water as a Public Good, a Commodity, and a Right
There is a long-standing debate around whether water is a public good or a commodity, and
consequently whether all people in a community should be guaranteed access to water or if
they must buy access. In reality, it is both. Water is a public good because it is essential for
life and economic prosperity. Water is also a commodity because it can be finite, excludable,
and dispersed geographically. We do not need infrastructure to access air, but most of us
need infrastructure to access water, and this infrastructure is expensive. Large-scale water
infrastructure (e.g., dams and levees) provide public goods such as navigation, flood protection,
water supply, and recreation. The benefits from large-scale infrastructure are non-excludable,
meaning the population writ large benefits (e.g., everyone downstream of a dam benefits from
flood protection). Because of these broadly distributed benefits, the federal government often
funds much of our water resources infrastructure.
In contrast, the beneficiaries of local water services infrastructure, such as drinking water and
wastewater, are more constrained, typically at the scale of a city, county, or community. These

2. Montag. 2019. Water/Color: A study of race & the water affordability crisis in America’s cities.
3. Perrone & Jasechko. 2017. Dry groundwater wells in the western United States.
4. Aspen Instute. 2019. Ensuring Water Quality.

                                       Nicholas Institute for Environmental Policy Solutions, Duke University | 4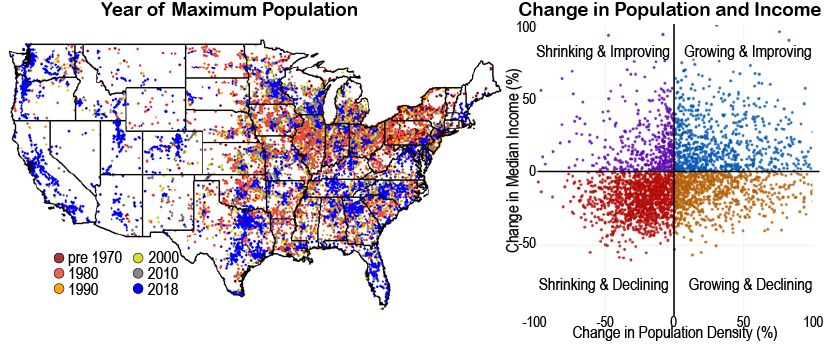
beneficiaries fund drinking water and wastewater infrastructure through water and wastewater
rates tied directly to the services provided. Since benefits and funding are localized, the
geographic, demographic, and economic differences create disparities in the cost and affordability
of water services infrastructure. Here, water services are a “local public good” because they
are provided to the community (public good), but are funded through direct payment from
customers based on usage (commodity). Households or individuals without access to public
water and sewer systems rely on bottled water (solely a commodity), private wells, and septic
systems (Fig. 1). Water as a commodity is incredibly expensive. As such, water in the U.S. can be
simultaneously a public good and a commodity.

Figure 1. Scale of Governance and Financial Capacity Influence Where Water Falls on
the Spectrum between Public Goods and Commodities

                             Nicholas Institute for Environmental Policy Solutions, Duke University | 5
The “right” to access water also varies across the U.S. In the western U.S., water is often treated
like a property right through the doctrine of prior appropriation, while the eastern U.S. treats
water more like a common pool resource available to all parties for beneficial use. Water as a
human right is becoming an increasingly popular perspective, particularly amidst the COVID
pandemic. In 2010, the United Nations formally recognized that access to safe and clean drinking
water and sanitation is a human right that is essential for the full enjoyment of life and all human
rights.5 In the U.S., water has evolved into a “constitutive commitment,” which describes statutory
rights that are held by many Americans as constitutional rights.6 To date, California is the only
state that has passed legislation formalizing the human right to water (AB 685).7
Water is also increasingly recognized as essential for our security. In 2013, the United Nations
introduced the concept of water security as “the capacity of a population to safeguard sustainable
access to adequate quantities of and acceptable quality water for sustaining livelihoods, human
well-being, and socioeconomic development, for ensuring protection against water-borne
pollution and water-related disasters, and for preserving ecosystems in a climate of peace and
political stability.”8 Water security mirrors the human right to water, but the reason for ensuring
access to safe water and sanitation is not about an inherent right, but about safeguarding the
socio-economic health of communities and nations. The response of water systems to initiate
shutoff moratoria emphasizes the critical nature of water for public health.
In the U.S., a patchwork of policies, investments, and governance structures shapes the capacity of
an individual, utility, farm, city, district, and even state to provide (or obtain) access to adequate
quantities of acceptable, quality water. While we all may have equal “rights” to water, we do not
all start on an equal playing field nor have an equal capacity to access water because of differences
in our natural, built, and sociopolitical environments (Fig. 2). This is partly why equity awareness
is rising.
5. UN. 2010. The human right to water and sanitation. https://undocs.org/A/RES/64/292
6. Murthy, S. 2016. A new constitutive commitment to water. Boston College Journal of Law and Social Justice 36(2): 159–233.
7. AB 685. 2012. The Human Right to Water.
8. UN. 2010. The human right to water and sanitation. https://undocs.org/A/RES/64/292
Nicholas Institute for Environmental Policy Solutions, Duke University | 6Figure 2. Water Examples of Equality and Equity
Note. (Top Left) Equality refers to equal opportunity to access to water. However, we do not all have equal capacity.
(Top Right) Similarly, we might have equal capacity to access water, but the quality of the water we can access is
very different, making water much more expensive in some communities. (Bottom) Equity means ensuring all have
the capacity to access safe water.
What Is Equity?
Equity can be defined as “fairness” marked by impartiality and honesty that is free from self-
interest, prejudice, or favoritism. Equity is achieved when life outcomes are not predetermined
by racial, economic or social identities. The U.S. Water Alliance, a forerunner on conversations
around water equity, defines equity as just and fair inclusion such that everyone has an
opportunity to participate and prosper,9 but what constitutes “fair”?10 Since we do not all have an
equal capacity to access water and some water is more expensive to both access and treat, some
resources must be redistributed. There are two broad theories around resource distribution: (1)
equality of resources and (2) equality of welfare.
Equality of resources holds that all stakeholders should be treated equally with resources
distributed evenly among them regardless of their starting point. In contrast, Equality of welfare,
which is about equity, holds that resources should be distributed so that all stakeholders end at
the same level of welfare (Fig. 2).
One of the frequent sticking points around fairness in equity revolves around whether someone
is at a different starting point because of bad luck or choice, and distinguishing between the
two creates heated debates. “Luck egalitarianism” is common allows resources to be given to
those who have had “bad luck”;11 i.e., resources are distributed based on needs created through
9. US Water Alliance. 2017. An Equitable Water Future: A national briefing paper.
10. Rothman. 2020. The Equality Conundrum. We all agree that inequality is bad. But what kind of equality is good?
11. Ibid.
Nicholas Institute for Environmental Policy Solutions, Duke University | 7external circumstances beyond the control of the individual. However, what constitutes a
“worthy” external circumstance is open for debate. A home flooded by a record setting hurricane
deserves help, while a 100-year home flooded by a heavy downpour due to climate change and
a combined sewer system may be labeled as a poor decision. The challenge with this approach is
that the distinction between choice (human agency) and luck (systemic structures in policy and
governance as well as disasters) is value-based and rarely recognizes the intergenerational legacy
that has led to current decisions, the majority of which are likely beyond the individual’s control.
Luck is tied to immediate circumstances while choice embeds institutionalized structures. Our
water systems are a mixture of “luck” and “choice.” So what is water equity?
What Is Water Equity and Why Is It Imperative?
The U.S. Water Alliance defines water equity as occurring when all communities:
(1) have access to safe, clean, affordable drinking water and wastewater services;
(2) are resilient in the face of floods, drought, and other climate risks;
(3) have a role in decision-making processes related to water management in their
communities;
(4) share in the economic, social, and environmental benefits of water systems.12
We have a long way to go to achieve water equity throughout the U.S. Many water systems
are deeply entangled with social and environmental injustices that have accumulated over
decades of purposeful decisions that have deprioritized or willfully ignored the needs of certain
communities along racial lines (section 3). Systemic racism has created a myriad of generational
and disparate health outcomes present today (section 4) that the COVID-19 pandemic has
garnered greater public attention. Water equity was an imperative long before the pandemic,
however, the current disruption and attention may create opportunities for significant movement
towards a more equitable water future (sections 5 and 6).
3. TRACING WATER INEQUITY THROUGH TIME
No amount of compensation money can replace a culture that has lost its roots. And while
politicians and corporate leaders have yet to come to terms with these humbling truths, the
people whose air, water, and livelihoods have been contaminated are losing their illusions fast.
–Naomi Klein (2019)
Industrial Era (1800s)
The industrial era was characterized by a predominance of market incentives and local
entrepreneurs, maximizing economic development, but largely at the expense of entire social
and ethnic groups and environmental health.13 Industrialization and cities went hand-in-hand
as industries needed infrastructure to house laborers, create energy, and supply water and
12. US Water Alliance. 2017. An Equitable Water Future: A national briefing paper.
13. Collin & Collin. 1994. Where did all the blue skies go? Sustainability and Equity: The New Paradigm. J. Env. Law and
Litigation. 9: 399–460.
Nicholas Institute for Environmental Policy Solutions, Duke University | 8sanitation. While private companies were initially a source of water infrastructure in cities, an
1849 Committee on Public Health noted that “water is so intimately connected to the health of
a city, that the municipal authorities should rank this among the most important of their public
duties….”14 Once local governments were able to take on funded debt through municipal bonds,
there was a trend towards public ownership of waterworks with most systems becoming publicly
owned by 1910.
Most major cities had established water and sewer systems by 1910, prior to the growing number
of segregation ordinances. Water services were provided throughout a city because the risk
of epidemics spread by water-borne diseases, such as cholera, was so great that a city could
not afford to not provide services to all customers, regardless of race.15 The ensuing water and
sanitation systems nearly eradicated these diseases, improving the public health and economic
outcomes of cities.
The primary impact of federal policies on the trajectory of water and sanitation systems in
cities is tied to housing policies. The U.S. population increased dramatically in the 1920s,
causing a rapid expansion of the housing market and the National Mortgage Crisis of the 1930s.
This contributed to the Great Depression and the subsequent creation of the Federal Housing
Administration (FHA) in 1934. The way the FHA was administered furthered segregation from
1934 to 1968 by guaranteeing the loans of white Americans, making homeownership possible,
while explicitly refusing to guarantee loans to African Americans or areas with high African
American populations.16 The systematic denial (directly or indirectly) of various services to
residents of specific, often racially determined, communities is known as “redlining” (Fig. 3).
In the 1940s, the GI Bill that provided mortgages to veterans with no down payments was not
explicitly discriminatory, but did nothing to stop discriminatory local policies and practices
that continued to guarantee bank loans to developers who wouldn’t sell to African Americans.17
Many state and local governments promoted the use of racially restrictive covenants in deeds
to prevent the sale of homes to African American families, while private real estate agents used
“blockbusting” to convince white families to flee communities with growing African American
populations at a premium and then resold those homes to African American families at inflated
prices.18
14. Montag. 2019. Water/Color: A Study of Race and the Water Affordability Crisis in America’s Cities.
15. Troesken, W. 2004. Water, Race, and Disease. MIT Press. 288 pp.
16. Madrigal, A.C. 2014. The racist housing policy that made your neighborhood. The Atlantic.
17. Lee, T. 2019. A vast wealth gap, driven by segregation, redlining, evictions, and exclusion, separates black and white
America. New York Times.
18. Montag. 2019. Water/Color: A Study of Race and the Water Affordability Crisis in America’s Cities.
Nicholas Institute for Environmental Policy Solutions, Duke University | 9Figure 3. Redlining Example for a Philadelphia Community
Note. Home Owner’s Loan Corporation maps assigned grades to communities that reflected their mortgage securi-
ty. Red (redlining) zones were ineligible from government insured loans. Comments often reflect racial reasons as
shown for D22 above. Interactive maps are available here: http://dsl.richmond.edu/panorama/#maps.
These government policies encouraged “white flight” to suburbs and concentrations of African
American populations in cities became poorer due to redlining policies that kept wealth outside
their boundaries.19 The ensuing disparity continues to play out today. African American incomes
are on average 61% of white incomes and African American wealth is only 5% of white wealth.20
Most middle-class families gained their wealth from home equity, homes that many were able to
purchase through FHA policies decades earlier. Since African American families were prohibited
from buying homes, buying homes with good interest rates, or buying homes in desirable
locations, they had no way to accrue this same wealth. While the 1968 FHA technically allowed
African Americans to buy homes anywhere, many homes remained unaffordable to those who
lacked the baseline wealth (even if they had a comparable income) to their white peers.
Racial segregation at the scale of neighborhoods and census tracts had implications for the
development of water and wastewater utilities after WWII. As residential segregation increased,
municipalities could more easily exclude communities of color from water and sewer services
through a practice known as “under-bounding,” whereby municipalities selectively annexed
white neighborhoods into the town’s official boundaries while ignoring African American
neighborhoods.21 For instance, Zanesville, OH did not construct municipal water lines in African
19. Ibid.
20. Economic Policy Institute. 2010. State of Working American: African Americans.
21. Montag. 2019. Water/Color: A Study of Race & the Water Affordability Crisis in America’s Cities.
Nicholas Institute for Environmental Policy Solutions, Duke University | 10American neighbors in the 1950s; Roanoke, VA did not extend water and sanitation lines to
the nearby predominantly African American town of Hollins; and in Central Valley, CA rural
Latinx communities were discouraged from incorporating and did not receive the infrastructure
funds available to neighboring towns.22 A 2018 study examined the relationships between race
and access to water and sewer services in areas bordering 75 municipalities in North Carolina.
They found the two most unserved groups were: (1) low-income African American populations
excluded from municipal services on the basis of race during the era of legal racial segregation
and (2) higher income white populations who could afford well and septic systems.23
Environmental Paradigm (1970s)
In the early 1970s, Congress passed the canon of federal water legislation to protect the quality of
our streams and lakes (Clean Water Act in 1972; CWA) and the public health of drinking water
(Safe Drinking Water Act in 1974; SDWA). These laws were passed in response to public outcry
that local and state governments were insufficiently protecting environmental welfare. In the
1960s, studies found 41% of public water systems were not meeting public health guidelines and
jeopardized the health of millions24 and major rivers were repeatedly catching fire. In response to
these events and with public support, Congress passed the CWA to protect the quality of surface
waters by regulating the discharges of pollutants and the SDWA to protect public health by
establishing and enforcing standards for drinking water quality.
Both the CWA and the SDWA included significant federal funding through grants to finance
the infrastructure needed for local governments to meet these new regulations. In 1987, the
CWA and in 1996, the SDWA, transitioned from providing grants to loans that must be
repaid, consequently placing greater financial responsibility and burden on local and state
governments and individual households. Studies have found inequities in the administration
of these regulations due to an absence of political power to access safe water supply, selective
enforcement of drinking water regulations, and the continued allowance of known non-
compliance with federal standards.25 There remain barriers for small water systems and those
serving majority low-income communities to access state and federal dollars.26 Funds are often
contingent on meeting extensive engineering and reporting requirements, and some states have
additional requirements—such as technical-managerial-financial (TMF) capacity, which creates
an impossible bind. Communities that lack resources often lack TMF, but without TMF they
cannot obtain funds. Yet, without funding TMF cannot be developed, and because there is no
TMF there are no eligible funds. The American Recovery and Reinvestment Act of 2009 set aside
money earmarked for “high priority” projects that were “shovel ready,” qualities that underserved
communities do not have the capacity to develop.27 While the federal government allows states
22. DigDeep & U.S. Water Alliance. 2019. Closing the water access gap in the United States.
23. Leker, H. & J. Gibson. 2018. Relationship between race and community water and sewer service in North Carolina.
24. Pontius. 1993. SDWA: A Look Back. Journal of the American Water Works Association 85(2).
25. Balazs, C., and I. Ray. 2014. The Drinking Water Disparities Framework: On the Origins and Persistence of Inequities in
Exposure. American Journal of Public Health 2014: 603–611.
26. Vanderwarker, A. 2012. Chapter 3: Water and Environmental Justice in A Twenty-First Century Water Policy.
27. Balazs, C. and I. Ray. 2014. The Drinking Water Disparities Framework: On the Origins and Persistence of Inequities in
Exposure. American Journal of Public Health 2014: 603–611.
Nicholas Institute for Environmental Policy Solutions, Duke University | 11to use up to 30% of capitalization grants to provide loan subsidies for low-income communities,
only a fraction of states do so.28
The allocation of CWA and SDWA funds are based on formulas that attempt to balance the
tension between distributing resources and distributing welfare. But what is “fair”? Tribal systems
are estimated to need $2.7 billion to provide water and sanitation to all homes on reservations
but are prohibited from receiving more than 1.5% of all available CWA and SDWA funding.29
This is particularly problematic when there are legal barriers inhibiting tribal capacity to generate
local revenues to finance infrastructure. All water and sanitation systems are experiencing an
increased burden to finance infrastructure. Yet tribal communities, rural regions, and low-
income areas—especially if they are communities of color—have the added burden of not having
the benefits of their initial infrastructure being financed through grants, have more difficultly
accessing low-interest capital, and have a reduced capacity to recover costs.
Environmental Justice Paradigm (1980s)
The Civil Rights movement in the 1960s created a unified voice for social justice. Social injustices
are prevalent in housing, employment, municipal services, education, and not surprisingly—
environmental protection.30 In the 1980s, the Environmental Justice movement sought to address
environmental inequities with the growing body of evidence that those suffering these injustices
were disproportionately low-income and racial minority groups. These communities are often
more likely to live near hazardous sites, where they are exposed to greater contaminants and
suffer the health and economic impacts).31 Resulting medical bills are expensive, generating
further economic disparities. Well known examples include (a) “Cancer Alley” impacts on
African American communities by petrochemical manufacturers, (b) uranium mining on Navajo
lands, (c) and pesticide exposure on predominantly Latinx farmworkers. Some environmental
inequity is intentional, some began intentionally and is now perpetuated by the inertia of the
status quo, and some began unintentionally and continues to be perpetuated.32 Yet, while
minority communities are suffering from environmental contamination, the very laws meant
to protect all Americans from environmental pollution have been used against them. Even the
National Environmental Policy Act has been invoked against minorities migrating into white
neighborhoods as a form of pollution.33
Environmental injustices start with industry being given the right to pollute before proving
harm, rather than having to prove no harm before being given the right to pollute. The negative
externalities from industrial pollution are born by the public, particularly low-income and
minority communities. Land use controls are often used to put locally unwanted land uses
in minority communities that lack the voice or political capital to advocate for “Not-In-My-
28. Vanderwarker, A. 2012. Chapter 3: Water and Environmental Justice in A Twenty-First Century Water Policy.
29. Ibid.
30. Collin, R.M. & R.W. Collin. 1993. Where did all the blue skies go? Sustainability and Equity: The New Paradigm. J. Envt.
Law and Litigation 9: 399–460.
31. Montag. 2019. Water/Color: A study of race & the water affordability crisis in America’s cities.
32. Collin, R.M. & R.W. Collin. 1993. Where did all the blue skies go? Sustainability and Equity: The New Paradigm. J. Envt.
Law and Litigation 9: 399–460.
33. Ibid.
Nicholas Institute for Environmental Policy Solutions, Duke University | 12Back-Yard.” There is also a history of putting unwanted lands uses in minority communities to
drive residents out, effectively serving as a “taking” of property.34 If all communities were given
an equal voice and political power, the rate of environmental degradation would likely slow.
However, private industries are often the needed employers for many low-income communities,
which inhibits many communities from raising concerns as they must choose between
employment and health.
Agricultural Communities
The federal government created the Bureau of Reclamation (BoR) in 1902, which subsidized the
development of irrigation projects and community water supply as populations were encouraged
to settle westward through Homestead Acts, often at the expense of tribes.35 In the 1930s, the
federal government supported the development of rural water systems through New Deal
programs for communities of less than 1,000 people. Federal support for rural water systems has
continued; however, funds have changed from grants to loans, and amounts have decreased as the
federal funding has declined in recent decades. Many of these rural systems provide services to
those who manage agricultural production.
The big dam building era from the 1930s to the 1960s treated dams as immense public goods, but
often had detrimental impacts on tribes as communities were displaced from their traditional
lands and on ecosystems that were dramatically altered. The Dalles Dam on the Columbia River,
the Elwha River Dams on the Elwha River, and the Pick-Sloan Missouri River Basin Program are
all examples of dam projects with significant impacts to tribal communities.36
Today, the BoR maintains and operates much of the publicly funded water infrastructure in the
western U.S. by directly providing irrigation water for ~25% of irrigated areas and subsidizing
irrigated water to local irrigation districts. These subsidies enabled the development of large-scale
corporate agriculture. The BoR is able to conduct interest-free projects and schedule payments
based on the ability of the farmer to repay, consequently prioritizing large farms and certain crop
types. Over time, federal subsidies have been declining, requiring farmers to pay larger portions
of the full cost of developing irrigation supplies.37 Higher prices for water are driving investments
in technical solutions to increase water efficiency, but this requires farmers to have the capacity to
afford new technology and irrigation infrastructure.
The federal subsidies of large-scale agriculture can then be juxtaposed with the low-wage labor
associated with those working on corporate farms. These communities of low-wage laborers often
have high nitrate and bacteria concentrations in their water, if they even have access to water.38
This holds true from North Carolina to California. One study found the top 20 farm subsidies
received on average over $1 million per farm, while rural development funding averaged $53 per
person. Some ask why the federal government continues to subsidize companies that, in violation
34. Ibid.
35. DigDeep & U.S. Water Alliance. 2019. Closing the water access gap in the United States.
36. Church et al. 2015. Tribal Water Rights: Exploring Dam Construction in Indian Country.
37. OECD. 2010. Agricultural Water Pricing in the U.S.
38. Vanderwarker, A. 2012. Chapter 3: Water and Environmental Justice in A Twenty-First Century Water Policy.
Nicholas Institute for Environmental Policy Solutions, Duke University | 13of federal labor laws, cannot or will not provide basic water and wastewater services for their
employees.39
In the environmental paradigm of the 1970s, the CWA applied to rural water systems to regulate
point source pollution but did not apply to agricultural communities and nonpoint source
pollution. Later amendments to the CWA included stormwater (urban nonpoint source pollution)
but only encouraged voluntary best management practices for agriculture. However, we know
that agricultural runoff is a significant contributor of nutrients and pollutants into surface and
groundwater bodies. Currently, urban communities are paying the costs of treating increasingly
polluted water. The 2017 Des Moines Water Works lawsuit was to recover treatment costs from
high levels of nitrate pollutants running off farms in upstream drainage districts. While the
lawsuit was dismissed, the question about who should pay to clean up nonpoint source waters
remains.
4. WATER INEQUITY TODAY
Children walk through [sewage] unaware of the health issues they could be tracking into
their homes. This situation is not in some Third World country, it exists in the USA … This is
America’s Dirty Secret. –Catherine Flowers (2014)
The past trajectory of historic water inequity is evident today. In California, drought led to
rapidly dropping groundwater levels that left several agricultural and rural communities without
access to water and some remain without access today. Multi-year droughts in the western U.S.
creating drastically fluctuating water prices, the negotiation of drought contingency plans, and
the proliferation of water efficient technologies (affordable to some growers) are reshaping water
markets and water rights. The lead crisis in Flint, MI raised public awareness as a city-sized
utility knowingly provided visibly contaminated water to its citizens, predominantly underserved
communities of color. Lead crises in Pittsburgh, PA, Camden, NJ, and Newark, NJ continually
highlight links between water contamination, poverty, and race. The prevalence of perchlorate
health impacts for the past 20 years has been overshadowed by growing concerns of PFOA and
PFAS in drinking water supplies that wealthy industries have left for communities to pay to clean
up. The discovery of tropical parasites in Lowndes County, AL due to inadequate sanitation and
the widespread presence of raw sewage is unfathomable to many. The occurrence of massive
water shutoffs in major cities have led to repeated outcries for the human right to water. Racism
continues to manifest as white communities get green infrastructure projects while communities
of color receive grey infrastructure, and those communities of color that do receive green
infrastructure often contribute to gentrification. A warming climate with more frequent and
intense flood events disproportionately impacts poor, minority communities and agricultural
lands. Communities facing the greatest water stress and threat to water security include
disinvested urban areas, rural areas, unincorporated areas, and Native American lands.40
39. Ibid.
40. US Water Alliance. 2017. An Equitable Water Future: A national briefing paper.
Nicholas Institute for Environmental Policy Solutions, Duke University | 14Current Challenges
Access to Water and Sewer Infrastructure
Today, more than two million Americans live without basic indoor plumbing, and many more
without sanitation.41 The majority are low-income people in rural areas, people of color, tribal
communities, and immigrants. These communities face both historic and contemporary barriers
to economic and social opportunities. Lack of access to water means already limited resources
must be spent to truck water in, buy bottled water, and treat water-borne diseases and parasites.
These household level solutions are far more costly in time and money than the resources spent
by most Americans with access to public water and wastewater services (Fig. 1).
There are small pockets of communities without complete plumbing in every state. Lack of access
can occur in high poverty census tracts within or adjacent to cities. For instance, a colonia in
Cochran, TX is a 10-minute walk from existing water mains. Many colonias were sold property,
often in floodplains or low-value land, with the promise of connection to public services by
developers who have failed to deliver. These colonias are often unincorporated areas outside the
jurisdiction of nearby utilities, but the high cost to expand lines to a few households makes it
unlikely they will be connected. In terms of sanitation, one of the most widely known examples
is in Lowndes County, AL where fewer than 20% of homes are connected to a sewer system. State
law requires those not connected to a sewer system to install septic systems that are unaffordable
for many, leading to fines, jail time, or evictions when individuals cannot afford to comply.
Water-borne illnesses, once believed to be eradicated in the United States, are reappearing in the
midst of this public health crisis.42
Disconnections and shutoffs within cities also have disproportionate effects on communities
of color, particularly Black households. It becomes increasingly expensive and complicated to
reconnect disconnected buildings as time goes by. Shutoffs also bring with them the risk of
foreclosure, family separation, and compounding issues such as depression and health impacts.
Access to Drinking Water You Trust Is Safe
Today, nearly a third of Americans drink bottled water regularly. A 2015 consumer research
report found that 60% of bottled water is consumed at home (where tap water is available) and
a 2017 Harris Poll found that 99% of people listed quality and 92% listed safety as reasons for
drinking bottled water. Voting by their wallet, many do not trust the safety and quality of water
from their tap.
African American communities are disproportionately impacted by lead contamination due to
a combination of exposure factors including living in older buildings with lead paint serviced by
older, lead pipes.43 St. Joseph, LA, a majority African American community, complained about
high lead and copper in their water for more than a decade before a state of emergency was
declared in 2016. The water system was replaced in 2017, triggering a 45% increase in water rates
for a community where 40% of individuals fall under the federal poverty line, raising questions
41. DigDeep & US Water Alliance. 2019. Closing the water access gap in the United States.
42. Ibid.
43. Packtor. 2018. Racial Gaps in Children’s Lead Levels.
Nicholas Institute for Environmental Policy Solutions, Duke University | 15about whether they could afford to continue to operate their system.44 Another study found
low-income African American and Latinx communities were more likely to have drinking water
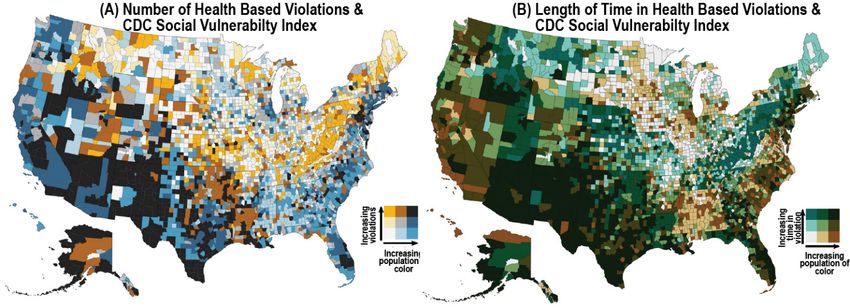
violations and they are more likely to stay in violation longer (Fig. 4).45 These examples, and
others, lead many to ask is public water safe to drink?
Figure 4. Correlation between Social Vulnerability and Safe Drinking Water Act
Compliance
Note. (A) The rate of health-based Safe Drinking Water Act violations overlaid with CDC’s racial, ethnic, and
language vulnerability index. (B) The length of time a water system stayed in violation overlaid with CDC’s racial,
ethnic, and language vulnerability index. Figures are from Watered Down Justice.
While most of the time community water systems (CWS) provide reliable and high quality
drinking water, 7–8% report at least one health-based violation annually.46 The highest
prevalence of violations were in rural and concentrated areas of the Southwest in regions with
high racial, ethnic, and language vulnerabilities (Fig. 4).47 Many have repeated violations,
indicating these systems struggle with recurring issues. The number of water quality violations
may be underreported, as smaller systems are exempt from some types of monitoring and
can receive hardship waivers to defer responding to violations due to affordability challenges.
With uncertainty around the number of violations, the question remains, is the water in rural
communities safe to drink?
Growing awareness of emerging contaminants raises questions about their prevalence in
our water and the impacts of long-term exposure to the 70,000 chemicals in commerce (and
potentially in our water). The EPA only regulates 91 contaminants, and has not added a new
contaminant in over 20 years, even when a chemical has known public health impacts and high
prevalence in water systems, such as Perchlorate.48 Similarly, PFOA and PFAS in drinking water
were brought to the attention of the federal government decades ago, but only in recent years
44. Montag. 2019. Water/Color: A Study of Race and the Water Affordability Crisis in America’s Cities.
45. Ibid.
46. Allaire et al. 2018. National trends in drinking water quality violations. PNAS 115(9): 2078–2083.
47. Fedinick, Taylor, and Roberts. 2019. Watered Down Justice.
48. Siegel, S. 2019. Troubled Water: What’s Wrong with What We Drink. Thomas Dunne Books. 352 pp.
Nicholas Institute for Environmental Policy Solutions, Duke University | 16have they made headlines as they are being found in the water supplies across the country and in
the blood of nearly all Americans.49 The presence of pharmaceuticals, from hormones to anti-
depressants to pain killers, in water supplies is another area of growing concern with unknown
public health impacts.50
Americans are choosing to pay more for bottled water, even when they have access to tap water.
Yet ironically, bottled water is less regulated than public water and often contains the same
chemicals and contaminants, but the perception is that this water is safer. As a result, millions
of Americans—often in underserved communities where there is less trust in the quality of their
water and government—are paying for both tap and bottled water. Those who least can afford
water are often paying the most for water (See Box: The Story of Toolville).
THE STORY OF TOOLEVILLE
Tooleville, CA is one of 15 unincorporated communities largely consisting of migrant laborers
in Tulare County. Tulare County governs unincorporated areas. The 1973 Tulare County
General Plan states, “These non-viable communities would, as a consequence of withholding
major public facilities such as sewer and water systems, enter a process of long term, natural
decline as residents depart for improved opportunities in nearby communities.”51 The County
Plan designated these communities as nonviable, many of which began as labor camps for
agricultural work and lack any kind of tax base or representation in the decision-making process,
and withheld resources.
As a result, Tooleville residents rely on groundwater, which has received nitrate and total
coliform violations from 2005 to 2010 due to large agricultural practices, likely from the farms
that employ them. Boil water advisories were given to address bacteria contamination, but
boiling water concentrates nitrates. There is no guidance on what a community should do when
multiple contaminants are present. Tooleville has sought to be consolidated by Exeter City,
which is located less than a half mile away, but Exeter has refused because Tooleville is too poor
to cover the costs of connection. Regulatory failures and inadequate water system responses
increase the vulnerability of already underserved communities, leaving the burden of mitigation
to individual households. Tooleville residents, whose median annual household income is
$16,000 are paying for contaminated tap water and bottled water. The legacy of social and
environmental injustices in underserved communities continues to affect their capacity to access
safe water at affordable costs.52
Exposure to, and Capacity to, Adapt to Changing Conditions
Most U.S. physical infrastructure was designed prior to widespread acceptance of climate change.
A warming climate changes the type, location, and timing of precipitation. In some places,
water variability may exceed infrastructure design (including pipes and culverts).53 Extreme
rainfall events can result in urban flooding, which disproportionately impacts underserved
communities and communities of color.54 Urban flooding that is coupled with combined sewer
49. CDC. 2020. Per-and Polyfluorinated Substances Factsheet.
50. Siegel, S. 2019. Troubled Water: What’s Wrong with What We Drink. Thomas Dunne Books. 352 pp.
51. Balazs, C. and I. Ray. 2014. The Drinking Water Disparities Framework: On the Origins and Persistence of Inequities in
Exposure. American Journal of Public Health 2014: 603–611.
52. Ibid.
53. Wright et al. 2019. U.S. Hydrologic Design Standards Insufficient Due to Large Increases in Frequency of Rainfall Extremes.
Geophysical Research Letters 46: 8144–8153.
54. Meridian Institute & American Rivers. 2018. Building a Community of Practice at the intersection of water, climate
resilience, and equity.
Nicholas Institute for Environmental Policy Solutions, Duke University | 17overflows creates public health hazards as raw sewage enters streams and floods homes. The
proximity of underserved communities to hazardous areas is the legacy of institutionalized
racism, discriminatory housing policies, and underinvestment in water infrastructure over
many decades.55 Their exposure to contaminants and public health risks from these hazardous
facilities and land uses are further exacerbated during flood events. The challenges presented by
climate change and their disproportionate impact on economically and politically marginalized
community’s highlight the importance of environmental justice.56 Intense precipitation may
also inundate water and wastewater utilities. A warmer climate also means warmer water and
the increased proliferation of biological contaminants that lead to increased treatment costs and
potentially the need for investment in new treatment technologies and capital infrastructure.
Higher costs may exceed the capacity of many smaller, lower-resourced communities.
Increased water variability in a warmer climate has significant implications for agricultural water
management as shifts in the timing and volume of snow may lower water availability in summer
months. In some areas, this is resulting in more frequent shortages and water insecurities for
junior water right holders. For instance, in the Yakima Basin, warmer winter temperatures cause
precipitation to fall as rain that flows downstream when the ground is fallowed, rather than snow
that melts and releases water during the growing season (Fig. 5). Consequently, downstream
senior water users receive their full allocation before upstream junior water users. As a result,
junior water users bear significant risks of financial losses with limited capacity to be resilient in a
warming climate under current legislation.
55. Ibid.
56. Larson, R. 2017. Water Security. Northwestern University Law Review 112(2): 139–200.
Nicholas Institute for Environmental Policy Solutions, Duke University | 18Figure 5. Effect of a Warming Climate on Precipitation and Streamflow
Note. (Top) Several irrigation districts are located in the Yakima River Basin. (Bottom Left) Warmer temperatures
in winter months means more precipitation falls as a wintery mix or rain. (Bottom Right) In the 2015WY, precipita-
tion fell as rain rather than snow, resulting in peaks in streamflow from October to February, rather than the more
steady release of snowmelt from April through July in colder years.
A warming climate challenges the long-term viability of some river basin compacts. For instance,
the Colorado River Basin is in a multi-decade drought, creating difficulties in delivering
full allocations. Interim Guidelines were developed in 2007 that further reduced allocations
to Arizona and Nevada (junior rights) and Drought Contingency Plans were authorized by
Congress in 2019 to collectively address chronic water shortages. There is also uncertainty in
how much water is available because of unused or unclaimed water rights. Twenty-two tribes
were awarded 2.9 MAF as part of Indian water right settlements, but only use half of their rights
while 13 other tribes have water right claims that have yet to be resolved. Increased use by tribes
with existing rights and future settlement claims by other tribes will likely be more controversial
in times of shortage. For instance, will Congress choose to fund the Congressionally authorized
development of the Navajo-Gallup Water Supply Project to serve Jicarilla Apache Nation, the
Navajo Nation, and the City of Gallup?57
57. Stern, C. and P. Sheikh. 2019. Management of the Colorado River: Water Allocation, Drought, and the Federal Role. CRS
Report R45546.
Nicholas Institute for Environmental Policy Solutions, Duke University | 19Have a Role in the Decision-Making Process
The immense fragmentation of governance in the U.S. at the federal, state, and local level makes
it difficult for the public to participate in water decisions. The federal government has at least
13 departments with a water-related mission. States often have separate departments managing
water quantity and quality, with further subdivisions between surface water and groundwater.
Local governments often manage water, sewer, and stormwater separately. Fragmentation
and variation in governance makes it difficult for there to be meaningful public participation,
particularly when water agencies have a culture of operating in the background. Some utilities
are moving towards better communication and public engagement. Public engagement should
be as inclusive as possible and strive to overcome barriers such as language (when meetings are
only conducted in English), property ownership (sometimes required), timing of meetings (when
only conducted during 8–5 hours), and location of meetings (when conducted in areas where
public transportation is not available). A legacy of systematically excluding and disregarding
disadvantaged communities creates significant distrust, and it can take decades for government
to regain public trust once it has been lost.58
5. PAYING FOR INFRASTRUCTURE: QUESTIONS OF AFFORDABILITY
Nothing is more useful than water: but it will purchase scarce anything; scarce anything can be
had in exchange for it. –Adam Smith (1776)
You need water to live, but you need money to live on. There are costs to pump water from its
natural environment, treat to standards, and deliver it to its final destination. There are costs
to move wastewater, treat to standards, and deliver it back into the natural environment. The
main driver of affordability challenges is the capital needed to maintain and upgrade this
infrastructure. Much of the water services infrastructure initially subsidized by the federal
government is at the end of its useful life and in need of replacement. Estimates range from $655
billion in the next 20 years to $1 trillion in the next 25 years are needed to simply restore existing
water systems, potentially tripling household bills in some communities.59 Water and sewer
services are expensive and historically underpriced. Even with rising rates, a 2018 AWWA survey
found only 21% of utilities believed they could cover the full cost of services from their customers.
Yet, the proportion of federal funding for capital infrastructure has declined from contributing
63% in 1977 to 9% in 2014.60
While there is bipartisan support in the federal government to invest in infrastructure, little has
changed. Infrastructure design and spending are tied to archaic legislation that was passed to
address different challenges, such as creating roads to connect cities, delivering telecoms, and
ending the dumping of raw sewage directly into streams.61 We also have archaic funding models
focused on funding new infrastructure and growth while many areas in the US have shrinking
populations and a declining median income (Fig. 7). Indeed, 47% of census designated places (i.e.,
58. US Water Alliance. 2017. An Equitable Water Future: A national briefing paper.
59. Montag. 2019. Water/Color: A study of race & the water affordability crisis in America’s cities.
60. US Water Alliance. 2017. An Equitable Water Future: A national briefing paper.
61. Tomer et al. 2019. To fix our infrastructure, Washington needs to start from scratch.
Nicholas Institute for Environmental Policy Solutions, Duke University | 20communities) in the U.S. have a smaller population now than in 1980, while 60% have a lower
median income after adjusting for inflation.
Figure 6. Community Population and Income Change over Time
Note. (Left) Map showing the decade of maximum population for CDPs located within a metropolitan statistical
area. (Right) Chart of changes in population and income for 3,600 CDPs from 1980 to present.
Utility Affordability
Water infrastructure reflects the history of a city. Water infrastructure in Rust Belt cities built
in the late 1800s were thick, cast iron pipes (life expectancy of 120 years). As cities grew, cast
iron pipes in the 1920s became thinner along with their life expectancy (100 years). Methods
and materials continued to change, such that pipes laid post World War II had a life expectancy
of 75 years.62 The timing to replace pipes in older cities all fall between 2000 and 2030, creating
significant cost burdens (Fig. 7). Often the cost burdens are so high that cities defer replacement.
As infrastructure fails, there are service disruptions, impediments to emergency response,
unsanitary health conditions, and environmental contamination.
After WWII, there was an explosion of small water systems in suburban areas to accommodate
the swelling Baby Boomer generation and “white flight.” These systems were often not built to
enduring standards and have to be rebuilt when consolidated.63 Rust Belt cities are plagued by
shrinking populations and declining incomes as industry and people moved elsewhere, stranding
infrastructure assets. Shrinking populations and/or declining incomes result in a smaller revenue
base for utilities to maintain the fixed costs of day-to-day operations, let alone finance replacing
infrastructure.
62. AWWA. 2001. Dawn of the Replacement Era: Reinvesting in Drinking Water Infrastructure.
63. Ibid.
Nicholas Institute for Environmental Policy Solutions, Duke University | 21Figure 7. Average Life Expectancy of Water Pipes and the Timing of Replacement64
In contrast, Sun Belt cities have experienced much of their growth in the last few decades. Rather
than replacing already built infrastructure, they are paying for new infrastructure, much of
which is sprawling and more expensive to build, maintain, and operate. The risk is two-fold
with this approach. First, capital facilities must be laid in advance of the population, creating
risk for stranded capacity should the expected population growth fail to materialize. Second,
economies and jobs may change and populations may leave. The inescapable fact is that water
infrastructure is fixed while populations are mobile.65
Built infrastructure creates the skeletal framework of American society and the age and health of
the skeleton vary geographically. As the financial burden shifts from federal to local, the capacity
to afford infrastructure varies considerably. Local systems require local wealth, but there is large
income and wealth inequality across communities. While the incomes for high-earning workers
has increased over time, the average American household is barely keeping up with inflation.
Disparities in income and wealth create an inequitable infrastructure reality, making it difficult
for many households, and therefore local utilities, to afford to replace aging infrastructure, let
alone modernize their systems to be resilient to changing conditions.
Opportunities and Challenges
The arrival of digital infrastructure creates a vast array of opportunity to manage old
infrastructure more efficiently. However, if not implemented with an equity lens, it may create
additional inequities due to varied community capacity to obtain wireless capabilities or attract
the skilled workforce needed to benefit from digital infrastructure. Challenges, like these,
appeared as schools transitioned to online in the pandemic, but many families did not have
broadband. Millions of Americans do not have access to broadband or high-speed connections
(putting businesses to a disadvantage), or they do not have the skills to leverage digital solutions
to better manage existing municipal services. In an effort to keep up, municipalities across the
country are spending faster than their revenue growth.66
64. GAO. 2002. Water Infrastructure: Information on Financing, Capital Planning, and Privatization.
65. Ibid.
66. Tomer et al. 2019. To fix our infrastructure, Washington needs to start from scratch.
Nicholas Institute for Environmental Policy Solutions, Duke University | 22You can also read