2020 Japan's Insurance Market
←
→
Page content transcription
If your browser does not render page correctly, please read the page content below

Japan’s
Insurance
Market
2020

Japan’s Insurance Market 2020
Contents                                                                                                   Page

To Our Clients
   Masaaki Matsunaga
   President and Chief Executive
   The Toa Reinsurance Company, Limited                                                                      1

1. The Risks of Increasingly Severe Typhoons
   How Can We Effectively Handle Typhoons?
   Hironori Fudeyasu, Ph.D.
   Professor
   Faculty of Education, Yokohama National University                                                        2

2.	Modeling the Insights from the 2018 and 2019 Climatological Perils in Japan
   Margaret Joseph
   Model Product Manager, RMS                                                                               14

3.	Life Insurance Underwriting Trends in Japan
	Naoyuki Tsukada, FALU, FUWJ
  Chief Underwriter, Manager, Underwriting Team, Life Underwriting & Planning Department
  The Toa Reinsurance Company, Limited                                                                      20

4. Trends in Japan’s Non-Life Insurance Industry
   Underwriting & Planning Department
   The Toa Reinsurance Company, Limited                                                                     25

5. Trends in Japan's Life Insurance Industry
   Life Underwriting & Planning Department
   The Toa Reinsurance Company, Limited                                                                     32

Company Overview                                                                                            37

Supplemental Data: Results of Japanese Major Non-Life Insurance Companies for Fiscal 2019,
                   Ended March 31, 2020 (Non-Consolidated Basis)                                            40

©2020 The Toa Reinsurance Company, Limited. All rights reserved.
The contents may be reproduced only with the written permission of The Toa Reinsurance Company, Limited.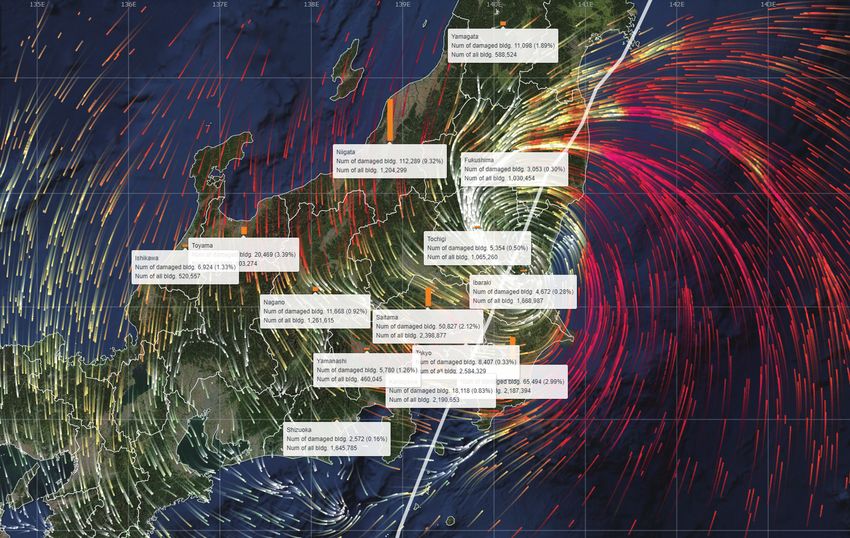
To Our Clients

        It gives me great pleasure to have the opportunity to welcome you to our brochure,
    ‘Japan’s Insurance Market 2020.’ It is encouraging to know that over the years our brochures have been
    well received even beyond our own industry’s boundaries as a source of useful, up-to-date
    information about Japan’s insurance market, as well as contributing to a wider interest in and
    understanding of our domestic market.
        During fiscal 2019, the year ended March 31, 2020, despite a moderate recovery trend in the first
    half, uncertainties concerning the world economy surged toward the end of the fiscal year, affected by
    the spread of COVID-19.
        In Japan, significant impacts on inbound demand, exports and production, and personal
    consumption became evident once the spread of COVID-19 gained traction, posing a challenge to the
    Japanese economy.
        In the reinsurance industry, whereas the trend toward softening of reinsurance premium
    rates and conditions has continued in recent years, reinsurance premium rates showed an upward trend
    for lines of business for which large amounts of reinsurance claims were paid, such as for contracts
    covering large-scale natural disasters, which are occurring frequently in Japan and overseas.
        Going forward, it will be necessary to respond appropriately to various impacts of the spread of
    the infectious disease on the reinsurance business. We also need to prevail in fierce competition to win
    contracts amid changes in the business environment, such as the frequent occurrence of natural
    disasters and the increasing complexity of risks. We forecast that the business environment will remain
    challenging.
        In accordance with the “Mission 2020” medium-term management plan, the Group will provide
    clients with higher quality reinsurance solutions and value-added services while further strengthening
    the management foundation to deal with future issues, in order to achieve sustainable growth.
        Everyone at the Toa Re Group will do their utmost so that the Group can fulfill its mission as a
    reinsurance company “Providing Peace of Mind,” as articulated in the Toa Re Mission Statement.
        In conclusion, I hope that our brochure will provide a greater insight into the Japanese insurance
    market and I would like to express my gratitude to all who kindly contributed so much time and effort
    towards its making.

                                                                                   Masaaki Matsunaga
                                                                               President and Chief Executive
                                                                      The Toa Reinsurance Company, Limited

                                                                                                               1
The Risks of Increasingly Severe Typhoons

                       1.
                                     How Can We Effectively Handle Typhoons?
                                     Hironori Fudeyasu, Ph.D.
                                     Professor
                                     Faculty of Education, Yokohama National University

                           Typhoon Faxai, also known as Reiwa 1 Boso Peninsula Typhoon, made landfall
                       in the Kanto region in September 2019. It was the strongest typhoon to make
                       landfall in the region since 1991, the year the Japan Meteorological Agency (JMA)
                       began to keep such records. The extreme winds of this typhoon left scars that
                       exposed the vulnerabilities of the metropolitan area in Japan. A year earlier, the
                       extremely powerful Typhoon Jebi in 2018 passed through western Japan, causing
                       devastation to the Kinki area. According to the General Insurance Association of
                       Japan (GIAJ), the damage caused by Typhoon Jebi resulted in the highest claims
                       ever paid for wind and flooding damage in Japan. Typhoons remain a serious threat
                       despite recent advances in science and technology.
                           Typhoons Faxai and Jebi share several characteristics. Both made landfall in
                       Japan without weakening, both featured powerful winds that set records in various
                       places, and both caused severe damage to large cities. We meteorologists are working
                       on the new challenges highlighted by typhoons in recent years. This paper
                       introduces the latest research results while elucidating three themes: (1) whether
                       typhoons have intensified in recent years; (2) how risks related to typhoons are
                       changing; and (3) new tools for handling typhoons.

                            Observation data based on historical records has enabled insights into the
    1. Are Typhoons   characteristics of typhoons in recent years. However, the typhoon data available
       Becoming More   from JMA is from 1951 onward, so we can only track trends for about half a
       Devastating?    century. Therefore, we reconstructed available typhoon data by aggregating past
                       observation data with a focus on only typhoons that made landfall in Japan islands
                       (Reference 1). Figure 1 shows the number of typhoons that have made landfall in
                       Japan since 1900. The number of landfalls varies from year to year, but there
                       doesn’t appear to be a long-term trend indicating an increase or decrease in number.
                       On the other hand, a trend in the intensity of typhoons at landfall is evident. Figure
                       2 shows intensity distribution in five-year averages, classified by typhoon central
                       atmospheric pressure at landfall. The proportion of strong typhoons below 970 hPa
                       at landfall has increased sharply since the year 2000. The average for these typhoons
                       in all analyzed periods is about 30%, but the average is about 50% since the year
                       2000. The data indicates that the proportion of typhoons having that strength at
                       landfall has trended upward in that period.
                            Observation data over the ocean from 100 years ago is not available, so whether
                       typhoons have gained strength over the ocean or whether they have come north
                       without weakening until landfall in Japan is not clear. However, Typhoon Faxai in
                       2019 was at the peak of its strength at landfall, so the research available on it is

2
The Toa Reinsurance Company, Limited — Japan’s Insurance Market 2020

                                     relevant here. On September 5, 2019, Typhoon Faxai formed offshore of
                                     Minamitorishima (Figure 3). It then proceeded northwest and approached the main
                                     islands of Japan, and on September 8 grew into a very strong typhoon over the
                                     ocean near Kozushima with a central pressure of 955 hPa and a maximum wind
                                     speed of 45 m/s. Typhoons usually weaken as they approach the Japanese islands,
                                     but Typhoon Faxai passed over the Miura Peninsula in the early hours of September
                                     9 without weakening, then passed over the narrow Tokyo Bay and made landfall in
                                     Chiba City, Chiba Prefecture before 5:00 AM JST (Japan Standard Time).
                                          Atmospheric and oceanic environmental factors led to Typhoon Faxai making
                                     landfall at full strength. Figure 4 shows a statistical prediction of the intensity,
                                     meaning central pressure, of Typhoon Faxai six hours ahead by JMA and the actual
                                     central atmospheric pressure at the actual time. The predicted central atmospheric
                                     pressure is in alignment with the actual central atmospheric pressure, indicating the
                                     high accuracy of this statistical method. Figure 4 also shows the environmental
                                     factors helping the storm strengthen that were used to predict intensity. Ocean
                                     surface temperature (effect: -2.8 hPa/6hr), ocean temperature (effect: -2.7 hPa/6hr),
                                     and upper-level wind (effect: -2.2 hPa/6hr) as the storm developed helped the
                                     typhoon intensify (negative numbers indicate intensification). The actual ocean
                                     surface temperature distribution is as high as 28°C to 30°C in the ocean offshore
                                     southern Japan, which on average is 2°C higher than in usual years. Statistically,
                                     2°C difference exceeds two standard deviations, or 95%, of past data. Looking at
                                     environmental factors prior to landfall in Chiba, upper-level wind (effect: -2.7
                                     hPa/6hr) more than offset the weakening influence of ocean surface temperature
                                     (effect: +0.7 hPa/6hr) and ocean temperature (effect: +0.8 hPa/6hr). In other words,
                                     proximity to land mitigated the effect of the ocean, but abnormally weak upper-
                                     level wind kept the typhoon from weakening at landfall.

Figure 1: Typhoons Making Landfall Annually – 1900 to 2014
(Typhoons)
11

10

 9

 8

 7

 6

 5

 4

 3

 2

 1

 0
     1900    1910   1920      1930        1940      1950      1960       1970      1980      1990       2000      2010 (Year)

                                                                                                                                3
1. T
        he Risks of Increasingly Severe Typhoons
          How Can We Effectively Handle Typhoons?

    Figure 2: Distribution of Typhoon Central Atmospheric Pressure at Landfall – 1900 to 2014
    (%)       (%)                                                                                                                                                 (hPa)
    100       100
                                                                                                                                                               990-1000
    90         90
                                                                                                                                                               980-990
    80         80

                                                                                                                                                               970-980
    70         70

    60         60                                                                                                                                              960-970

    50         50                                                                                                                                              950-960

    40         40                                                                                                                                              940-950

    30         30
                                                                                                                                                               930-940

    20         20
                                                                                                                                                               920-930

    10         10
                                                                                                                                                               910-920
     0          0
      1900-2014     1900     1910      1920      1930       1940          1950         1960        1970    1980       1990         2000          2010 (Year)

    Note: Shows the mean percentage over a 115-year period and its transition in 5-year intervals.
          The solid line indicates percentage of typhoons below 970 hPa.

                                                  Figure 3: The Path of Typhoon Faxai
                                                   60N

                                                   50N

                                                                                                                                          9/11
                                                   40N
                                                                                                    9/9           Becomes extratropical cyclone

                                                   30N                                                    9/7
                                                                                                                    9/6             Typhoon forms
                                                                   Sept. 9, 06:00:                                           9/5
                                                   36N             960hPa
                                                                                                                                                 9/2
                                                                                 Sept. 9, 03:00:
                                                                                 960hPa
                                                                       Sept. 9, 0:00: 960hPa
                                                   34N
                                                                       Sept. 8, 18:00: 955hPa

                                                                            140E                           150E              160E            170E              180E
                                                  Note: Passage over a wide area marked every 9 hours.
                                                        All notations are in Japan time.

4
The Toa Reinsurance Company, Limited — Japan’s Insurance Market 2020
Figure 4: JMA Statistical Mechanical Strength Prediction for Central Pressure of Typhoon Faxai in 6-hour Change
in Contributing Factors over Time
(Contribution to typhoon development (decrease in pressure) and decay (increase in pressure) (hPa/6 hr)) (hPa)
15 1,020
Formation period Development period Peak period Decay period
Typhoon genesis
10 1,000
5 980
0 960
-5 940
-10 920
9/2 9/2 9/2 9/3 9/3 9/3 9/3 9/4 9/4 9/4 9/4 9/5 9/5 9/5 9/5 9/6 9/6 9/6 9/6 9/7 9/7 9/7 9/7 9/8 9/8 9/8 9/8 9/9 9/9 9/9 9/9 9/10
6:00 12:00 18:00 0:00 6:00 12:00 18:00 0:00 6:00 12:00 18:00 0:00 6:00 12:00 18:00 0:00 6:00 12:00 18:00 0:00 6:00 12:00 18:00 0:00 6:00 12:00 18:00 0:00 6:00 12:00 18:00 0:00
Upper-level wind Ocean surface temperature IRP RH 850 vor or 850 vorticity Actual central atmospheric pressure
Ocean temperature SST^2 or Sea surface temperature Shear x latitude OHC^2 or Ocean heat content Predicted central atmospheric pressure
Statistics indicate that typhoons making landfall in Japan are getting stronger,
2. Recent Changes which has also influenced recent changes in typhoon risk. The damage that typhoons
in Typhoon Risk inflict directly on people has decreased markedly compared to the mid twentieth
century, when single typhoons inflicted damage affecting up to several thousand
people (Table 1). Reasons include improved public infrastructure such as flood
control, or more resilient housing. In fact, no typhoon has resulted in more than 100
dead or missing since the 1980s. However, damage inflicted on people has increased
since the 2000s. Typhoon Tokage in 2004 resulted in 98 dead or missing, Typhoon
Talas in 2011 resulted in 98 dead or missing, and Typhoon Hagibis, also known as
Reiwa 1 East Japan Typhoon, in 2019 finally resulted in 107 dead or missing (as of
April 2020).
Regarding economic damage, recent typhoons dominate in terms of insurance
claims paid from wind and flooding (Table 2). Claims paid due to Typhoon Jebi in
2018 topped 1 trillion yen, and the claims paid for two typhoons in 2019 were also
very large. These amounts cannot be ignored when compared with the finances of
national and local governments. As such, the economic impact of typhoon damage is
increasing.
Typhoon Faxai in 2019 is representative of the damage caused when a typhoon
hits a city. Experts conduct a comprehensive survey whenever a typhoon causes serious
damage to elucidate its mechanisms and analyze the human and physical damage.
According to the report prepared for Typhoon Faxai (Reference 2), Faxai resulted in
5
1. T
        he Risks of Increasingly Severe Typhoons
      How Can We Effectively Handle Typhoons?

                                   various kinds of damage to a large number of structures. Partial damage included
                                   damage to tiled roofs, while other kinds of damage included damage to houses caused
                                   by the collapse of steel poles from a golf driving range and solar panel fires that started
                                   when solar panels were blown away in the typhoon. Building damage included 391
                                   houses completely destroyed, 4,204 partially destroyed, and 72,279 partially damaged,
                                   with inundation above floor level at 121 properties and inundation below floor level at
                                   109 properties. In essential infrastructure, electric power facilities suffered the greatest
                                   damage. A large-scale power outage affecting approximately 930,000 homes occurred
                                   mainly in Chiba Prefecture, and this extraordinary long-term outage took half a
                                   month to resolve. In addition, downed trees and landslides cut off roads and
                                   transportation facilities in various places, which hindered a broad range of household,
                                   industrial and economic activities. An ancillary problem involved approximately
                                   10,000 passengers stranded at Narita Airport, which was isolated due to the planned
                                   suspension of many railway lines in preparation for the approaching typhoon. The fact
                                   that a single typhoon could cause these critical situations revealed the vulnerability of
                                   the metropolitan area to typhoons.

                                   Table 1: Typhoons with a Large Number of Dead or Missing
                                       Rank           Year             Typhoon Name                   Dead or Missing

                                         1           1959             Isewan Typhoon                       5,098
                                         2           1945          Makurazaki Typhoon                      3,756
                                         3           1934             Muroto Typhoon                       3,036
                                         4           1947            Typhoon Kathleen                      1,930

                                         5           1954           Toya Maru Typhoon                      1,761
                                         6           1958           Kanogawa Typhoon                       1,296
                                         7           1942            Suonada Typhoon                       1,162
                                         8           1951             Typhoon Louise                         943
                                         9           1948              Typhoon Ione                          838
                                        10           1950              Typhoon Jane                          539

6
The Toa Reinsurance Company, Limited — Japan’s Insurance Market 2020

Table 2: Major Claims Paid Due to Wind and Flooding Damage
                                                                                                      Claims Paid (Billion yen)
  Rank             Disaster Name                      Region                 Date
                                                                                               Fire       Motor    Marine     Total
             Typhoon No. 21, 2018              Osaka, Kyoto,
    1                                                                September 3-5, 2018      936.3        78.0      53.5    1,067.8
                (Typhoon Jebi)               Hyogo and elsewhere
             Typhoon No. 19, 2019
    2                                               East Japan        October 6-13, 2019      518.1        64.5       −           582.6
               (Typhoon Hagibis)
             Typhoon No. 19, 1991
    3                                              Nationwide        September 26-28, 1991    522.5        26.9      18.5         568.0
               (Typhoon Mireille)
             Typhoon No. 15, 2019
    4                                                 Kanto          September 5-10, 2019     439.8        25.8       −           465.6
                (Typhoon Faxai)
             Typhoon No. 18, 2004
    5                                              Nationwide         September 4-8, 2004     356.4        25.9       5.1         387.4
               (Typhoon Songda)
            Heavy Snowfall, February
    6                                             Mainly Kanto           February, 2014       298.4        24.1       −           322.4
                     2014
             Typhoon No. 18, 1999           Kumamoto, Yamaguchi,
    7                                                             September 21-25, 1999       284.7        21.2       8.8         314.7
                (Typhoon Bart)              Fukuoka and elsewhere
             Typhoon No. 24, 2018               Tokyo, Kanagawa         September 28-
    8                                                                                         294.6        11.5       −           306.1
               (Typhoon Trami)                   and elsewhere          October 1, 2018
                                             Okayama, Hiroshima,
    9         Heavy Rain, July 2018                                   June 28-July 8, 2018    167.3        28.3       −           195.6
                                             Ehime and elsewhere
              Typhoon No. 15, 2015
   10                                              Nationwide          August 24-26, 2015     156.1         8.1       −           164.2
                 (Typhoon Goni)
Note: Figures after 2016 are in red.
Source: GIAJ website; as of March 31, 2020; includes predictions

                                                 In a few days before Typhoon Faxai made landfall in Japan, JMA’s predictions
  3. New Tools for                          regarding its course and strength had proven accurate, and as a result JMA called for
     Predicting                              the highest-level precautions by various parties. While there is more time to prepare
     Typhoon Threats                         for typhoons than earthquakes and volcanoes, complacency and inadequate
                                             countermeasures can still result in enormous damage. In that regard, the provision
                                             of information that creates a critical sense of urgency among the populace is
                                             essential, but so too is robust urban development. Leading-edge applied research has
                                             given society the following two new tools to help prevent disasters.

                                             (1) Typhoon Soragram: Which Typhoon Path is Most Dangerous to
                                                 Your City?
                                                  Both Typhoon Jebi in 2018 and Typhoon Faxai in 2019 caused severe damage
                                             in many locales due to violent wind. However, a survey of the damage (Reference 2)
                                             reveals a clear contrast between areas where damage was significant and areas where
                                             damage was relatively limited. The strong winds that typhoons generate are heavily
                                             influenced by surrounding landforms, particularly mountains. As a result, typhoon

                                                                                                                                          7
1. T
        he Risks of Increasingly Severe Typhoons
      How Can We Effectively Handle Typhoons?

                                   paths that may cause a dangerous typhoon in a particular area vary regionally.
                                        In your city, which path will cause a dangerous typhoon? Answering that
                                   question requires data for the various paths a typhoon may take, but past
                                   observation data is insufficient. We have therefore created Typhoon-Path Ensemble
                                   Simulation (Reference 3). We incrementally shifted the positional relationship
                                   between atmospheric phenomena – including typhoons – and the Japanese islands
                                   from east to west in a computer-based virtual world to generate any number of
                                   typhoon paths. This approach creates many clones of a typhoon striking the
                                   Japanese islands. Figure 5 shows the path of Typhoon Vera in 1959, and clones of
                                   that typhoon created using Typhoon-Path Ensemble Simulation. Also known as the
                                   Isewan Typhoon, it was the most damaging typhoon in the modern history of
                                   Japan. The clone typhoons move along routes just like the real typhoon, so many
                                   courses are parallel from east to west against the original path. The simulation can
                                   generate virtual scenarios, such as having the typhoon hit Tokyo instead of making
                                   landfall in Wakayama Prefecture as it actually did. Thus we have been able to
                                   simulate the landfall of more than 1,000 typhoon clones in Japan and successfully
                                   obtain extensive wind data from all over the country. The amount of data we have
                                   obtained is equivalent to about 300 years of real-world typhoon observation.

                                   Figure 5: Paths of Multiple Isewan Typhoon Clones Created Using Typhoon
                                             Path Ensemble Simulation
                                               48N

                                                                                Isewan Typhoon
                                               45N

                                               42N

                                               39N

                                               36N

                                               33N

                                               30N

                                               27N

                                               24N

                                               21N

                                               18N

                                                                                      Clone Typhoons
                                               15N
                                                 120E      125E      130E      135E      140E      145E      150E      155E      160E

                                   Note: Selected data indicating the actual path of the Isewan Typhoon with the red line in the center
                                         and black lines to the east and west showing clones of that typhoon. This figure shows limited
                                         results only.

8
The Toa Reinsurance Company, Limited — Japan’s Insurance Market 2020
Figure 6: Typhoon Nomograms of Various Regions in Japan
Tottori
100
40°N
90
80
Kanazawa
37.5°N 70 100
Wind Ratio[%]
60 90
50 40°N 80
35°N
40 70
Wind Ratio[%]
30 60
37.5°N
32.5°N 20 50
10 40
35°N
30°N 0 30
130°E 132.5°E 135°E 137.5°E 140°E
20
Aomori
32.5°N 10 100
0 45°N 90
132.5°E 135°E 137.5°E 140°E 142.5°E
80
70
Fukuoka 42.5°N
Wind Ratio[%]
60
100
50
90 40°N
37.5°N 40
80
30
70
37.5°N 20
35°N
Wind Ratio[%]
60
10
50
0
135°E 137.5°E 140°E 142.5°E 145°E 147.5°E
32.5°N 40
30
20
30°N
10
0
Yokohama
125°E 127.5°E 130°E 132.5°E 135°E
100
40°N
90
80
37.5°N 70
Wind Ratio[%]
60
50
35°N
40
30
32.5°N
20
Naha 10
30°N 0
100 135°E 137.5°E 140°E 142.5°E 145°E
90
30°N
80
70
27.5°N
Wind Ratio[%]
60
Wakayama
50
25°N 40
Miyazaki 100
100 90
30
90 37.5°N 80
20
22.5°N
35°N 80 70
10
Wind Ratio[%]
70 60
0 35°N
122.5°E 125°E 127.5°E 130°E 132.5°E
Wind Ratio[%]
60 50
32.5°N
50 40
32.5°N
40 30
30°N 20
30
30°N 10
20
27.5°N 10 0
130°E 132.5°E 135°E 137.5°E 140°E
0
127.5°E 130°E 132.5°E 135°E 137.5°E
91. T
he Risks of Increasingly Severe Typhoons
How Can We Effectively Handle Typhoons?
We made a typhoon nomogram, which is a type of typhoon hazard map, at
each location, using results of Typhoon-Path Ensemble Simulation. Figure 6 shows
typhoon nomograms at various locations in Japan. Consider the typhoon
nomogram of Yokohama City (middle right of Figure 6) as an example of how to
read a typhoon nomogram. A circle with a radius of 500 km around Yokohama,
represented by the small circle in the center, is divided into 71 segments. Each
segment has a color-coded value from the Wind Ratio scale on the right, indicating
wind strength. A typhoon center entering the segments with red colors indicates
stronger wind. A typhoon path that passes through a segment with a high wind ratio
is a dangerous path because it means strong winds will be generated. In the typhoon
nomogram of Yokohama, compared to a typhoon with a path to the east through
Chiba or over the Pacific Ocean, a typhoon with a path to the west or northwest
through Shizuoka or Yamanashi will cause stronger winds in Yokohama. Even a
typhoon passing through more distant places to the west or northwest such as Gifu
and Toyama will increase wind impact in Yokohama. A multiregional comparison
of typhoon nomograms clearly shows that dangerous typhoon paths vary by region.
The typhoon hazard maps we developed are distributed for free under the
brand name “Typhoon Soragram” as part of the comprehensive weather service,
Liferanger (Note 1). Users can select their city to see which path increases typhoon
risk where they live. Knowledge of the risk for the city in which a person lives is a
very important typhoon countermeasure.
(2) CMAP: A Hazard Map That Predicts the Number of Damaged
Buildings
CMAP real-time damage prediction is available at the website, cmap.dev (Note 2).
It predicts the number of buildings that heavy rainfall and winds, or an earthquake
will damage in a given municipality and discloses predictive data in real time should
the disaster strike. This building damage prediction is an area-specific function of
the number of buildings and a building damage rate derived from past damage data
(Reference 4). When Typhoon Faxai passed through Japan, CMAP predicted and
published the number of damaged buildings in real time (Figure 7). CMAP
predicted damage to approximately 220,000 buildings in Chiba Prefecture from this
typhoon, which was almost three times the 80,000 damaged residential properties
reported by a survey after the typhoon (Reference 2). However, CMAP’s prediction
aligned closely with the roughly 220,000 aggregate claims received for property
damage reported by GIAJ (Note 3) (Reference 5). Moreover, the correlation
coefficient between the number of damaged buildings in 54 municipalities in Chiba
Prefecture reported by the survey after the typhoon (Reference 2) and CMAP’s
predicted number was 0.68, indicating a strongly positive relationship with damage
distribution (Figure 8). CMAP provides specific damage prediction information
relevant to users; for example predicting a thousand buildings will be damaged in
the town in which they live. Hopefully, this tool will help in the evacuation of
overly optimistic people who would like to regard natural disaster prediction
information as having nothing to do with themselves, and encourage them to think
10The Toa Reinsurance Company, Limited — Japan’s Insurance Market 2020
more critically about impending disasters.
CMAP also has a simulation function that predicts building damage for past
typhoons with hypothetical scenarios (Note 4). For example, it can use the
Typhoon Path Ensemble Simulation results discussed earlier to look at outcomes if
the Isewan Typhoon of the past were to strike today, or if it were to directly hit
other areas such as Kanto or Kyushu today. Global warming virtually ensures that
typhoons with the intensity of the Isewan Typhoon will strike in the future.
Advance knowledge of the extent of damage has many uses, such as for disaster
prevention measures by local residents, evacuation information and shelters
prepared by local governments, and national disaster prevention plans for flood
control by the government.
Figure 7: CMAP Building Damage Prediction for September 9, 2019, at 03:00
Yamagata Fukushima Tochigi Ibaraki
Num of damaged bldg. 11,098 (1.89%) Num of damaged bldg. 3,053 (0.30%) Num of damaged bldg. 5,354 (0.50%) Num of damaged bldg. 4,672 (0.28%)
Num of all bldg. 588,524 Num of all bldg. 1,030,454 Num of all bldg. 1,065,260 Num of all bldg. 1,668,987
Saitama Chiba Tokyo Kanagawa
Num of damaged bldg. 50,827 (2.12%) Num of damaged bldg. 65,494 (2.99%) Num of damaged bldg. 8,407 (0.33%) Num of damaged bldg. 18,118 (0.83%)
Num of all bldg. 2,398,877 Num of all bldg. 2,187,394 Num of all bldg. 2,584,329 Num of all bldg. 2,190,653
Shizuoka Yamanashi Nagano Ishikawa
Num of damaged bldg. 2,572 (0.16%) Num of damaged bldg. 5,780 (1.26%) Num of damaged bldg. 11,668 (0.92%) Num of damaged bldg. 6,924 (1.33%)
Num of all bldg. 1,645,785 Num of all bldg. 460,045 Num of all bldg. 1,261,615 Num of all bldg. 520,557
Toyama Niigata
Num of damaged bldg. 20,469 (3.39%) Num of damaged bldg. 112,289 (9.32%)
Num of all bldg. 603,274 Num of all bldg. 1,204,299
111. T
he Risks of Increasingly Severe Typhoons
How Can We Effectively Handle Typhoons?
Figure 8: Correlation between CMAP Prediction of the Number of Buildings
Damaged in Real Time and Damaged Buildings Reported by the
Chiba Prefecture Disaster Risk Management Department on May
14, 2020
(Number of damaged buildings reported by Chiba Prefecture)
10,000
Minamiboso City
y=x
Approximate Line: y=0.24x+586
Chiba City
5,000
0
0 5,000 10,000 15,000 20,000 25,000 30,000
(CMAP prediction of number of damaged buildings)
Although the number of typhoons that have made landfall in Japan has not
4. Conclusion changed significantly during the past 100 years, the intensity of the typhoons at the
time of landfall in Japan has increased in recent years. Consequently, the risks
associated with such typhoons have changed. As in the case of Typhoon Faxai,
typhoons that hit a vulnerable city throw societal functions into crisis. Society has
an urgent need to help make cities resilient to natural disasters by fully deploying
modern science and technology to evolve information and new tools for disaster
prevention and mitigation.
1.Rie Kumazawa; Hironori Fudeyasu; Naoyuki Kubota. Tropical Cyclone Landfall in
References Japan during 1900-2014. Tenki, 63, 855-861.
2.Ministry of Education, Culture, Sports, Science and Technology Grant-in-Aid for
Scientific Research (19K24677): Comprehensive survey on the effects of prolonged
blackouts caused by Typhoon 15 in 2019 and wind and flooding damage. http://ares.
tu.chiba-u.jp/typhoon15/
3.S hota Yamasaki; Hironori Fudeyasu; Masaya Kato; Tetsuya Takemi; Yasutomo
Kiyohara. Assessing Typhoon Wind Hazard: Development of Typhoon Nomogram.
Japan Association for Wind Engineering. 42, 121-133.
4.Takeshi Okazaki; Oriol Gaspa Rebull. Identifying building characteristics by deep
learning and a method of assessing typhoon losses. The 31st Annual Conference of the
Japanese Society for Artificial Intelligence, 2017.
5.Totals for members of the General Insurance Association of Japan and the Foreign
Non-Life Insurance Association of Japan (as of Monday, March 9, 2020).
https://www.sonpo.or.jp/news/release/2019/ctuevu000000rde1-att/ctuevu000000rdhx.pdf
12The Toa Reinsurance Company, Limited — Japan’s Insurance Market 2020
1. MTI Ltd. distributes Liferanger and other lifestyle information to mobile phones.
Notes Liferanger Typhoon Soragrams are available to users in Japan for their area via
smartphone and are color coded for easy understanding. Access Liferanger as follows: 1)
Search for Liferanger Tenki on smartphone; 2) Select Typhoon Soragram under
Disaster Preparedness from the Menu icon in the upper left corner. Select the city to
check from Other Locations in the center of the screen to display the local Typhoon
Soragram.
2. CMAP is the world’s first website for predicting the number of buildings affected by a
natural disaster in real time for a given location by municipality, and is the product of
industry-academia joint research among Aioi Nissay Dowa Insurance Co., Ltd., Aon
Benfield Japan Ltd. (currently Aon Group Japan Ltd.), and Yokohama National
University. Available at https://cmap.dev/, it was released in June 2019 and received the
grand prize at the 29th Global Environment Award in February 2020.
3.In terms of the number of buildings damaged in natural disasters other than typhoons,
there is significant difference between reports prepared by the Fire and Disaster
Management Agency and the number of claims paid reported by GIAJ members.
CMAP was developed using the number of claims paid, so it is consistent with the
number of claims submitted to GIAJ member companies.
4.CMAP can simulate the number of buildings affected in a hypothetical scenario. 1) Click
Past on the right panel; 2) Select “Vera in 1959” (Isewan Typhoon) from the paths of
typhoons; 3) Click “Shift the Track” at the bottom right and select the path to simulate.
13Modeling the Insights from the 2018
2. and 2019 Climatological Perils in Japan
Margaret Joseph
Model Product Manager, RMS
In 2018 and 2019 Japan experienced record high insurance losses from
1. Foreword typhoons. However, losses were not caused solely by typhoons in these years; there
were also high losses from non-typhoon climate catastrophes. These two years of
losses underline the risk that Japan faces from typhoon and non-typhoon
catastrophes alike. This article reviews the risk modeling work that RMS undertook
in response to events during 2018 and 2019 and discusses how we are incorporating
what we learned into our view of risk for Japan.
RMS has been modeling typhoon risks in Japan for over 25 years.
2. Twenty-Five Years In the autumn of 2016, RMS released an updated model for typhoon risk in
of Modeling Japan – the RMS® Japan Typhoon HD Model. This represented a complete model
Typhoons, and rebuild, with significant updates to all aspects of typhoon modeling: from the
stochastic track model through to hazard and vulnerability, as well as exposure and
the 2018 and
financial modeling. The update incorporated newly available data, scientific
2019 Events advancements, and innovative modeling advances – leading to a superior modeled
representation of typhoons over Japan and how they affect insured assets.
Since 2016, and most notably in the last couple of years, Japan has been impacted
by typhoons that resulted in significant insured losses. Table 1 shows the paid claims
as reported by the General Insurance Association of Japan (GIAJ) for Typhoons Jebi
and Trami in 2018 and Typhoons Faxai and Hagibis in 2019. However, market
estimates for global insured losses from the typhoons in Japan approach 20 billion
U.S. dollars for both 2018 and 2019. In the immediate weeks after landfall, RMS
released global industry loss estimates for Typhoon Faxai of 5 billion to 9 billion U.S.
dollars and for Typhoon Hagibis of 7 billion to 11 billion U.S. dollars.
Table 1: G
IAJ Total Claims, including Fire, Automobile, and Miscellaneous, and
for Jebi includes Marine (yen to U.S. dollar exchange rate at time of
GIAJ release)
JMA Event – Year Number ID Paid Claims (Billion U.S. dollars)
Typhoon Jebi (2018) 1821 9.8
Typhoon Trami (2018) 1824 2.8
Typhoon Faxai (2019) 1915 4.1
Typhoon Hagibis (2019) 1919 5.1
High insurance loss in Japan in 2018 also resulted from a non-typhoon event:
flooding caused by a stationary frontal system over the southwest of the country in July.
The GIAJ reported 1.8 billion U.S. dollars in paid claims from this event, with the
insurance market indicating total insured losses could approach 3 billion U.S. dollars.
Following these events, RMS modelers comprehensively reviewed all
components of the Japan Typhoon HD Model. As part of the review, RMS received
14The Toa Reinsurance Company, Limited — Japan’s Insurance Market 2020
a significant body of Typhoon Jebi claims from the primary market in Japan that
were used for a detailed claims analysis, working with companies that provided the
data to aid in the analysis and interpretation. In addition to claims, other key data
sources included insights from multiple field reconnaissance in the affected regions
after the events and work undertaken with academics and engineers in Japan.
Separately, RMS also received claims from the flooding in July 2018, within a
dataset of non-typhoon flood events in Japan since 2000.
RMS has incorporated the insights from the 2018 and 2019 events into an update to
the 2016 Japan Typhoon HD Model. So, what did we learn?
In July 2018, a stationary front over southwestern Japan, within an atmospheric
3. A Complete View setup that drew in moisture-laden air masses, brought multiple rounds of heavy
of Flood Risk precipitation. The widespread and severe flooding caused by this event led to
significant insured loss. As a consequence, the risk from non-typhoon precipitation
flooding in Japan was brought to the forefront. Furthermore, since the event, an
increase in flood coverage has been offered in insurance policies in Japan, which
increases the importance of understanding the future loss potential from such events.
Figure 1 shows what RMS reconnaissance teams saw in the immediate
aftermath of the flooding.
RMS includes probabilistic non-typhoon loss modeling in 2020 offerings for
Japan to provide a complete view of flood risk, both typhoon and non-typhoon.
Together with the existing wind component of the typhoon model, this constitutes
our Japan Typhoon and Flood HD Model.
Based on our latest modeling of typhoons and of non-typhoon flooding in
Japan, flood contributes around 30% of the total loss at the nationwide perspective.
When looking at the local level, particularly for certain lines of business, flood can
be a higher proportion of the loss or, indeed, the driver of the loss, and flood losses
can also be significant for individual events, as seen in recent years.
Figure 1: RMS Field Reconnaissance following Non-Typhoon Flooding in July 2018
152. M
odeling the Insights from the 2018 and 2019 Climatological Perils
in Japan
The typhoon events of 2018 and 2019 were a reminder that typhoon risk is not
4. Learning from confined to wind, with storm surge-driven coastal flood impacts observed in Jebi
Recent Typhoons and Faxai and significant precipitation-driven inland flooding in Hagibis. In 2018,
Typhoon Jebi brought coastal flooding to property lines in Osaka Bay, impacted
marine cargo in the ports of Kobe and Osaka, and inundated Kansai International
Airport. Notably, observed coastal flooding was in advance of the significant
“mainland” coastal defenses that exist in Osaka Bay (in Ise Bay and in Tokyo Bay);
it highlighted the vulnerability of exposures in advance of these defenses, including
exposures on reclaimed land.
Tokyo Bay is the only other area of reclaimed land with higher exposure than
Osaka Bay – within a year, Typhoon Faxai was tracking over Tokyo Bay. Faxai
made landfall during a receding tide, which served to limit coastal flooding. Where
coastal flooding did occur, however, RMS reconnaissance teams deemed the defense
breaching likely to have been caused by wind-induced waves riding on top of the
storm surge. Similarly, in Typhoon Jebi, at Kansai International Airport (situated
on reclaimed land in the center of Osaka Bay) the coastal flooding was
predominantly a result of waves on top of storm surge. Waves increase the energy of
the storm surge and its height, and they can significantly increase the damage at an
affected location. Waves are important to consider for coastal defense failure in
Japan as they present a significant factor for defense performance where deep water
abuts defenses, as seen during Typhoon Jebi at Kansai International Airport in
Osaka Bay and during Typhoon Faxai in the southwest of Tokyo Bay in Kanagawa
Prefecture.
In 2019, Typhoon Hagibis brought heavy precipitation over central and eastern
Japan for several days that resulted in widespread flooding, which consisted of many
individual areas of flooding across a large swath of Japan. The Ministry of Land,
Infrastructure, Transport and Tourism (MLIT) reported more than 100 levee
breaks along 64 rivers and almost 200 separate instances of rivers overtopping their
levees or banks. Looking at the extensive levee system in Japan, RMS reconnaissance
noted that most instances of flooding were from levee breaches rather than
overtopping. This reflected what RMS modelers observed in the field in the
immediate days after the July 2018 flooding. Levee breaches are typically
accompanied by high-velocity flows that contribute to increased structural damage
from foundation scour, even at low flood depths. RMS observed significant
structural damage in areas close to the levees where levees had failed in both
Typhoon Hagibis and the non-typhoon flooding in July 2018.
In the flooding associated with Typhoon Hagibis, RMS also observed instances
where the levee systems built to protect property were found to exacerbate flooding.
In a few locations visited in field reconnaissance, water from an upstream levee
failure was prevented from draining into the river by the levee, and accumulated
behind the levee structure.
The high precipitation levels from Hagibis that fell over Japan are, in part,
explained by the storm’s asymmetrical pattern development as it approached Japan.
This pattern displaced precipitation to the north of the storm’s center, leading to
16The Toa Reinsurance Company, Limited — Japan’s Insurance Market 2020
the occurrence of precipitation days in advance of landfall. Another factor was the
sheer size of the system. Hagibis was a typhoon with very large atmospheric
circulation; its wind field at landfall was three times that of Faxai (the typhoon that
had made landfall the month previous). A large geographic area was therefore under
the wind field and the precipitation extent.
Both these factors were influenced by the fact that Hagibis was undergoing
extratropical transitioning at landfall. This is a process that alters the shape of the
typhoon wind field, the precipitation field, and the storm surge and wave fields
(Bruneau et al., 2017), and therefore has profound impacts on the loss potential
from such storms. A significant number of typhoons that impact Japan do so
undergoing or having undergone extratropical transitioning. Typhoon Jebi began
this process as it tracked over the Sea of Japan, off the coast of northern Japan. For
Jebi, this meant that its wind field extended to the east to the extent that its winds
impacted northern Honshu and Hokkaido, even when tracking up to 80 miles
offshore.
The RMS Japan Typhoon HD Model explicitly models the flood component
from typhoons, and does so through a sophisticated methodology that enables
capturing flood inundation both in the model and when the model is used in event
response, as in Typhoon Hagibis. The model includes defense failure from both
overtopping and breaching of defenses, and it captures high-velocity flows and
movement of water across the landscape to include accumulating behind levees –
features observed in 2018 and 2019 events. The RMS model physically models the
impact of waves and, following what was observed at Kansai International Airport
in Typhoon Jebi, has been updated to allow for wave attack at more angles from the
north. Further, the RMS model well replicates the extratropical transitioning
process using the most advanced transitioning model on the market (Loridan et al.,
2014; Loridan et al., 2015), the importance of which has been seen in recent events.
RMS analysis of recent events also informed the vulnerability component of the
model. RMS conducted an extensive review to ensure the model is well calibrated
and continues to reflect both the latest market conditions and local building
performance typhoon hazards. Typhoon Jebi claims provided additional data for
specific regions and wind speed ranges to the claims pool used by RMS in the 2016
model development. In addition to claims, RMS used insights from field
reconnaissance along with extensive analytical modeling to recalibrate wind and
flood vulnerability functions across Japan for all lines of business.
Field reconnaissance provided clear examples of the unique characteristics and
difference in performance of traditional and western-style wood frame structures in
Japan. RMS modelers were able to validate major damage mechanisms based on
field observations, including extensive damage to tiled roofs on traditional
buildings. Clean-up and repair operations, with restoration practices and
redundancies unique to Japan, also aided in updating facility and lifeline business
interruption functions.
RMS has also updated the post-event loss amplification (PLA) module based on
insights from recent events, both in Japan and globally. PLA updates in the 2020
172. M
odeling the Insights from the 2018 and 2019 Climatological Perils
in Japan
model consider recent changes in the Japanese insurance market – mandatory
training of loss adjusters as stipulated by government regulations after the 2018
events, and GIAJ initiatives to improve fraud detection and the claims settlement
process following Faxai and Hagibis in 2019. The unique elements of Japanese
societal and systemic resilience in reconstruction and disaster preparedness were also
considered.
The Japan Typhoon HD Model also benefits from extensive research conducted
by RMS and our understanding of PLA impacts observed after intense losses in
specific regions, such as the recent California (U.S.) wildfires, major Atlantic
hurricanes (including Harvey, Irma, and Michael), the Elbe (central Europe) and
Louisiana (U.S.) floods, and the New Zealand Earthquake Sequence. As in the New
Zealand Earthquake Sequence, in recent years in Japan the impacts of overlapping
events has been seen, most notably in 2019 when Typhoon Hagibis tracked over
Tokyo Bay just over a month after Typhoon Faxai. The compounding impacts of
these events on PLA was considered in the recent model update.
Field reconnaissance in the immediate aftermath of an event can be challenging,
5. Commitment to but RMS modelers in the field provide details about the peril hazard that cannot
Field Learning solely be ascertained from media photographs of the severest damage. Modelers are
able to view first hand the type, extent, and severity of damage to property and
infrastructure and then review these details in the context of learning about the
event. RMS invested significantly in reconnaissance in the immediate days after the
2018 and 2019 events in Japan – particularly for Typhoon Hagibis given its
complexity, which included flooding across large areas of Japan and overlapping
impacts from the previous typhoon. Figure 2 shows what RMS reconnaissance
teams saw following Hagibis.
Figure 2: RMS Field Reconnaissance following Typhoon Hagibis in 2019
18The Toa Reinsurance Company, Limited — Japan’s Insurance Market 2020
Not only does RMS conduct field reconnaissance immediately after the event,
modelers often revisit the impacted areas in the months and years following events
to evaluate repair and restoration efforts. This was the case with Faxai and Hagibis,
when RMS modelers from our Tokyo office revisited areas around Tokyo Bay
following the initial reconnaissance. Similarly, RMS modelers returned to the Osaka
region a year after Jebi. In addition to field surveys, they spoke to claims adjusters
and met with local engineers and academics to gather information on the various
nuances of the event and details on model development.
The RMS commitment to ground truth – not just in the immediate aftermath
but over time to evaluate repairs and rebuilding – is important in evaluating and
modeling typhoon and flood risk in Japan.
The events in 2018 and 2019 highlighted features that are important to risk
6. Summary modeling, and RMS is committed to incorporating insights and learning into our
view of risk, thereby ensuring the models continue to represent the state of the
science in understanding the risk to insured assets in Japan.
The RMS Japan Typhoon and Flood HD Model was released this year on Risk
Modeler™ (the modeling application on the RMS platform Risk Intelligence™) and
incorporates lessons learned from recent typhoon events, and includes explicit
coverage of non-typhoon flood losses.
After the last two significant loss years for typhoon and flood in Japan, 2020 will
give the catastrophe modeling community and (re)insurance markets a lot to consider.
Bruneau N., Grieser J., Loridan T., Bellone E., & Khare S. (2017). The impact
References of extra-tropical transitioning on storm surge and waves in catastrophe risk
modeling: application to the Japanese coastline. Natural Hazards, 85, 649–667.
Loridan T., Khare S., Scherer E., Dixon M., & Bellone E. (2015). Parametric
modeling of transitioning cyclone wind fields for risk assessment studies in the
Western North Pacific. Journal of Applied Meteorology Climatology, 54, 624–642.
http://journals.ametsoc.org/doi/abs/10.1175/JAMC-D-14-0095.1
Loridan, T., Scherer E., Dixon M., Bellone E., & Khare S. (2014). Cyclone
wind field asymmetries during extratropical transition in the Western North Pacific.
Journal of Applied Meteorology Climatology, 53, 421–428. http://journals.ametsoc.
org/doi/abs/10.1175/JAMC-D-13-0257.1
About RMS : For over 30 years, RMS has shaped the world’s view of risk. RMS leads the
catastrophe risk industry that we helped to pioneer. We marry data and advanced model
science with leading-edge technology to create the most comprehensive catastrophe risk
models, applications, and APIs. Leaders across multiple industries can address the risks of
tomorrow with RMS Risk Intelligence™, our open, unified cloud platform for global risk.
Insurers, reinsurers, financial services organizations, and the public sector trust RMS to
help them better manage and navigate the risks of natural and man-made catastrophes.
19Life Insurance Underwriting Trends
in Japan
3. Naoyuki Tsukada, FALU, FUWJ
Chief Underwriter, Manager, Underwriting Team,
Life Underwriting & Planning Department
The Toa Reinsurance Company, Limited
The term “life insurance” is generally associated with benefits paid due to the
1. Foreword death of a person, but in fact life insurance also provides benefits for living needs
including health insurance, long-term care, critical illness, disability income, and
total permanent disability. Medicine, healthcare technology, information
technology, socioeconomics, lifestyles, life insurance products, and many other
issues are now very different from when I became involved in life insurance
underwriting in 1998. This paper covers the transition of life insurance in general,
from a product that covers the death of a person to a product for living needs, as
well as underwriting trends in Japan.
In 1706, the Amicable Society was established in England as the world’s first life
2. The Origins of insurance company. Moreover, in 1762 the Equitable Life Assurance Society
Life Insurance (“Equitable Life”) laid the foundation for modern life insurance companies because it
Medicine was the first to employ a scientific approach to underwriting: setting base premiums
by age, identifying risk on the basis of age and medical underwriting, and setting
premiums based on mortality tables. Equitable Life also employed actuaries, set
maximum sum assurance, and paid cash surrender value and policyholder dividends.
Risk selection is at the very heart of life insurance, and Oscar H. Rogers played
an important part in its history and evolution. Known as the father of life insurance
medicine, he served as Medical Director of New York Life Insurance Company at the
end of the nineteenth century and worked with fellow actuary Arthur Hunter on
impairment studies using a life table methodology. They published a paper titled The
Scientific Valuation of Human Lives for Insurance, which presented a revolutionary
numerical rating system that is now commonly used worldwide. In the twentieth
century, U.S. life insurance companies collaborated in intercompany impairment
studies that involved medico-actuarial studies using large groups of insured persons.
This methodology is still used today. Subsequently, Richard D. Singer worked with
The Association of Life Insurance Medical Directors of America (ALIMDA) and the
Society of Actuaries (SOA) to recalculate mortality ratios and extra mortality ratios
with clinical data categorized by age and time elapsed as a method for risk selection.
They presented Medical Risks: Patterns of Mortality and Survival in 1976, launching a
new approach to life insurance medicine. This study was then revised in Medical
Risks: Trends in Mortality by Age and Time Elapsed. Volume 1 and 2.
The history of the life insurance industry and risk selection in Japan began with
3. The History of Meiji Life Insurance Company, which was founded in 1881. Life insurance
Underwriting companies handled risk selection at that time by employing full-time doctors
Requirements (company doctors) to examine applicants. The first medical examination in Japan
took place on July 9, 1881, the day Meiji Life was established. Life insurance
companies subsequently contracted with clinical doctors so that professionals other
than company doctors could provide applicants with medical examinations. Medical
examinations at that time checked height, weight, chest measurement, auscultation,
20The Toa Reinsurance Company, Limited — Japan’s Insurance Market 2020
palpation, and vital capacity of the lungs.
Urinalysis was then introduced in 1889, blood pressure measurement in 1891,
and chest X-rays and electrocardiograms in the 1930s. A rise in deaths from
tuberculosis likely led to the pronounced increase in the use of chest X-rays, which
many life insurance companies no longer require due to the sharp decrease in the
tuberculosis mortality rate. On the other hand, electrocardiograms, which have
become lighter, more compact and more accurate to the extent that they can be
used when a doctor makes a home visit, have become more important in line with
increased emphasis on cardiovascular diseases. In Japan, company doctors and
doctors under contract visit the homes of people applying for life insurance policies,
which is not common practice in other countries.
Blood glucose tests were introduced in the 1960s, and blood tests including
complete blood counts and biochemical examinations became widespread in the
1980s. Blood tests are now fundamental components of health examinations, and
with their introduction the foundation of current underwriting requirements was
firmly established. Current common blood tests are AST, ALT, GGT, TB, TP, HDL,
LDL, TG, FBS, HbA1c, Cre, BUN, UA, WBC, RBC, Hb, Ht, and platelet count.
Some companies have included tumor markers such as CEA and PSA in their
medical examinations since the 1990s, but few life insurance companies make
tumor marker testing mandatory due to issues with sensitivity, specificity, costs, and
explaining these tests to applicants. Questionnaires and or testing for HIV and
recreational drug use are included in some countries, but are not currently used in
health examinations in Japan because these issues have not reached high levels.
In Japan, medical examinations, which are not necessarily conducted by a
doctor, include an applicant’s declaration (non-medical), data collected by health
interviewers, and the results of health checkups. The latter originated when the
employers of applicants replaced actual medical examinations with a certification of
examination results, due to the shortage of doctors in Japan following World War
II. This system is not common internationally and is also increasingly less common
in Japan, where applicants now typically submit the results of medical examinations
to life insurers. Health checkups are advantageous for risk selection because they
cover more issues than medical examinations. They also cost less, do not require the
labor of a medical examination, and incur no risk of legal liability for medical
examination mishaps. Moreover, more than 60% of people in Japan receive routine
health checkups, so it has become common since the late 1990s for Japanese life
insurance companies to only use the results of health checkups.
Health checkups can identify an applicant to be sub-standard because they
check for a large number of issues and may therefore uncover disorders that the
medical examination process does not. Insurance salespeople and agents therefore
tend to prefer medical examinations over health checkups, so to cover themselves
life insurance companies have in place measures such as paying higher sales fees (an
incentive) to salespeople and adopting lower mortality ratios for health checkups.
They typically credit the mortality ratio for health checkups by 25 to 50 points or
by multiplying it by 0.85 to 0.95.
213.Life Insurance Underwriting Trends in Japan
Consequently, policies underwritten through health checkups have achieved a
good record for several reasons. One, applicants who have routine health checkups
are generally more aware of their health, which supports the early detection of
illness and outcomes that are better than for other groups in terms of clinical and
preventive medicine. Two, health checkups can identify sub-standard risk because
they cover a large number of issues, which can lead sub-standard applicants to
gravitate to other companies, resulting in established pools of policyholders that
tend to be completely standard risk. However, accurate health checkup data for
applicants with illnesses enables more accurate underwriting, leading in many cases
to policy conditions that are favorable rather than conservative. More favorable
conditions, such as lower insurance premiums, are key for selling policies, and the
ability to offer favorable conditions to applicants even if they are sub-standard risks
keeps those applicants from taking their business to other companies.
Doctor shortages and medical examination issues after wars were similar outside
Japan. Canada began issuing insurance based on non-medical examinations (a
declaration only) rather than a medical examination in 1921 in response to the
shortage of doctors because of their deployment during World War I, and non-
medical examinations subsequently became a common means for risk selection in
industrial insurance in the United States. Non-medical examinations first came into
use in Japan in 1943 during World War II.
The use of health interviewers has evolved as a unique Japanese risk selection
method. Inspired by exams for paramedics in the United States, health interviewers
came into use in 1973. Health interviewers do not need nursing qualifications and
are certified as health interviewers if they pass a test conducted by the Life Insurance
Association of Japan. They do not measure blood pressure or perform urinalysis, but
they do obtain a declaration from applicants and confirm abnormalities in
appearance. However, many life insurance companies have discontinued the use of
health interviewers due to limited risk selection, cost and efficiency issues including
the time and effort required to educate them. Conversely, the life insurance
companies that still employ health interviewers make sure interviewers are highly
educated and have positive cost benefits.
Whole life insurance was the primary product during the early years of the life
4. Product insurance industry in Japan. However, endowment insurance subsequently became
Evolution and the primary product as the need for savings increased. Life insurance initially only
Underwriting handled standard risks, but began handling sub-standard risks in 1953. Initially, life
insurance companies generally used the lien method for sub-standard risks, but
increasingly employed the extra premium method and the exclusion of total
permanent disability method as their understanding of sub-standard risks increased.
The lien method for handling sub-standard risk is unique to Japan. Life insurance
companies use this approach for diseases including malignant neoplasms for which
the risk of death gradually decreases with the passage of time because this method
reduces the sum insured should an insured event occur within a specified period
22The Toa Reinsurance Company, Limited — Japan’s Insurance Market 2020
after the policy goes into force. As high-risk applicants are treated as postponed
groups, who cannot purchase life insurance until they meet certain conditions, the
lien method is only applicable to them after the specified period to meet such
conditions has passed. The lien method is more attractive to Japanese people as they
prefer a reduced sum insured over a short period to the burden of higher insurance
premiums because few applicants think they will die during the lien period specified
by the life insurance company. Postponed groups with high-risk of death are already
excluded from such applicants. The table below details the lien method. Figures
refer to the percentage of sum insured paid under the lien method.
Table 1: The Lien Method
Lien Period 1st Policy Year 2nd Policy Year 3rd Policy Year 4th Policy Year 5th Policy Year
1 year 50% 100% 100% 100% 100%
2 years 30% 60% 100% 100% 100%
3 years 25% 50% 75% 100% 100%
4 years 20% 40% 60% 80% 100%
5 years 15% 30% 45% 60% 80%
The development of various riders subsequently accompanied the development of
death benefits, including term riders, hospital indemnity riders, lifestyle disease riders,
nursing care riders, specified disease riders, and living needs riders. Eliminating anti-
selection is especially important for life insurance with living benefits, and the 90-day
waiting period for breast cancer in critical illness insurance is the result of extensive
experiential data. (Insurance for all types of cancer now has a 90-day waiting period.)
Insurance products featured various riders providing generous benefits in the early
1990s, but consumer needs shifted to less expensive products during the subsequent
economic crisis. These products included preferred insurance, non-participating
insurance without policyholder dividends and insurance with no cash value at
surrender. In particular, preferred insurance outside Japan requires that various criteria
be met including a cotinine test, body mass index (BMI), blood pressure, lipid levels,
medical history (including that of the family), hobbies, occupation, and driving
history. In Japan, companies require that comparatively fewer criteria be met: a
satisfactory cotinine test, BMI, blood pressure, and medical history, with some
companies requiring driving history. In the latter half of the 1990s, the aging of
society shifted the need for life insurance from death to living needs. Simple health
insurance plans became popular and companies developed riders that excluded certain
body parts or specific diseases in accordance with the medical history of applicants.
Competition among life insurance companies has intensified since the beginning
of the 2000s. Companies have developed simplified issue products and guaranteed
issue products to incorporate high-risk applicant groups such as sub-standard risk and
postponed risk, but have focused greatest attention on competitive underwriting.
23You can also read