DEUTSCHE FAMILIENVERSICHERUNG (DFV) - Successful IPO triggers next step in DFV's digital journey - Investor ...
←
→
Page content transcription
If your browser does not render page correctly, please read the page content below
17 January 2019

DEUTSCHE FAMILIENVERSICHERUNG (DFV)
Successful IPO triggers next step in DFV’s digital journey
Outperform, Price Target: EUR 17.2

For important disclosure information please see Appendix section at the end of this report
Insurance
Germany
DFV OUTPERFORM
DFV GY | 63 Pages | 17 January 2019 Price Target: EUR 17.2
Successful IPO triggers next step in DFV’s digital journey
Deutsche Familienversicherung (DFV), which raised EUR 52.1m of LAST CLOSE (EUR) 11.8
gross proceeds through an IPO, plans to disrupt the traditional MKTCAP (EUR m) 157
insurance industry with superior products, fully digitalised processes, UPSIDE (%) 46.4
event-based IT, and direct sales capability.
CHANGES TO ESTIMATES 2018E 2019E
Our investment case is based on highly dynamic customer and revenue
growth driven by investments in sales and marketing. The recently YEAR TO DEC 2016 2017 2018E 2019E 2020E
(EUR M)
announced deal with Henkel shows DFV’s growth potential. New Business volume 64 71 71 95 123
innovative products, e.g. product bundle, will be the icing on the cake. Net premiums 28 32 37 57 71
Operating result 2 2 (5) (3) 5
In contrast to many other InsurTechs, we believe that DFV has the right
Net result sh. (adj.) 2 1 (4) (2) 3
management and all the ingredients it needs to significantly grow its EPS (adj.) (EUR) 0.19 0.17 (0.27) (0.16) 0.24
market share in the German insurance market and abroad. DPS (EUR) 0.00 0.00 0.00 0.00 0.00
Shareholders' equity 19 19 68 65 69
HENKEL / IG BCE COOPERATION: DFV IS DELIVERING ON ITS PROMISES
Total assets 73 94 164 181 204
DFV has started the cooperation with consumer goods manufacturer Henkel P/E 0.00 0.00 (43.4) (75.0) 49.2
on an exclusive supplementary nursing care insurance product for its c.9,000 Oper. margin (%) 3.2 3.0 -7.6 -3.3 3.9
employees and trainees called Henkelcareflex. The product was launched in Dividend yield (%) 0.0 0.0 0.0
cooperation with the Mining, Chemical and Energy Industrial Union (IG P/BV 0.00 0.00 2.32 2.39 2.28
Bergbau, Chemie, Energie), which has more than 600,000 members. These P/TNAV 0.00 0.00 2.32 2.39 2.28
co-operations illustrate DFV's expertise in implementing social partnership ROE (adj.) (%) 18.3 7.8 -8.3 -3.1 4.7
models and we agree that such insurance co-operations are highly scalable. RONAV (adj.) (%) 9.2 7.6 -5.3 -3.2 4.6
Additional key drivers are the next product generation, including a P&C comb. ratio (%) 86.8 93.2 96.1 97.4 94.7
comprehensive product bundle and a market entry in other European markets
via the EU single passport directive. DFV has set itself an ambitious target of Next event: Q4/FY Results (10 Apr 2019)
100,000 new customers in 2019.
ANALYSTS
DFV: FULLY DIGITALISED INSURER WITH AN OUTSTANDING PRODUCT OFFERING René Locher
Equity Research, Insurance
DFV offers easy-to-use, award-winning products (16 Matrix) via all relevant +41 (43) 888 6151
sales channels, whereof the direct sales channel and Direct Response TV rene.locher@mainfirst.com
(DRTV) together account for ~75% of total sales. Contract sign-off, policy
process, customer service and claims service are fully digitalised. The
‘personnel-light’ business model is supported by its scalable IT core system,
which can accommodate 10x the current client base (that is, up to 5m
customers) at little incremental cost. This is operating leverage at its best, and
we expect DFV’s expense ratio to improve in the medium-term. Direct insurers
Hastings Group in the UK, and Allianz-owned Genialloyd in Italy, show that an
expense ratio below 20% is achievable.
VALUATION
As with other InsurTech companies, traditional insurance valuation multiples
cannot be applied to value DFV. The discounted cash flow model (FCFE) is
our preferred valuation model for DFV, as it best captures DFV’s entire growth
trajectory. We derive a price target of EUR 17.2, which offers 46% upside to
the current share price, hence our Outperform rating.
For important disclosure information please see Appendix section at the end of this report. 2 / 63
DFV (OUTPERFORM)

                                                                            CHART ONE: OPERATING PROFIT
KEY FINANCIALS
YEAR TO DECEMBER (EUR M)                  2016 2017 2018E 2019E 2020E
PROFIT & LOSS ACCOUNT
Business volume                            64    71    71     95     123
Gross written premiums                     64    71    71     95     123
Net earned premiums                        28    32    37     57      71
Net investment income                      (1)    1      1      1      1
Total income                               28    33    38     59      73
Net claims and benefits                    17    18    22     35      43
Net administrative expenses                  8   11    13     21      25
Other operating expenses                     1    2      8      6      1
Total expenses                             26    31    43     62      68
Operating result                             2    2    (5)    (3)      5
Pre-tax result                               2    2    (5)    (3)      5
Income taxes                                 0    1    (2)    (1)      2
Net result                                   2    1    (4)    (2)      3    Source: MainFirst, DFV
Net result (shareholders, reported)          2    1    (4)    (2)      3
MF adjustments                               0    0      0      0      0    CHART TWO: DFV PORTFOLIO DEVELOPMENT
Net result (shareholders, adjusted)          2    1    (4)    (2)      3
BALANCE SHEET
Investments                                32    46    47     64      82
Goodwill, other intangibles                 0     0     0      0       0
Other assets                               41    48   118    117     122
Total assets                               73    94   164    181     204
Shareholders' equity                       19    19    68     65      69
Policyholder reserves                      35    47    40     58      77
Total liabilities                          73    94   164    181     204
OPERATING METRICS & RATIOS
Business volume growth y/y                  10.3% 0.2% 34.7% 28.9%
Pre-tax result growth y/y                    4.8%        -      -       -
Net result (adjusted) growth y/y                 - 354.1%- 42.1%- 252.3%-
Operating margin                       3.2% 12.8%
                                             3.0% 343.4%
                                                    -7.6% 42.1%
                                                           -3.3% 252.3%
                                                                    3.9%
Pre-tax margin                         3.2% 3.0% -7.6% -3.3% 3.9%
P&C expense ratio                     27.7% 36.2% 35.7% 36.6% 34.6%
                                                                            Source: MainFirst, DFV
P&C net claims ratio                  59.1% 57.0% 60.4% 60.8% 60.1%
P&C combined ratio                    86.8% 93.2% 96.1% 97.4% 94.7%         CHART THREE: A TRULY DIGITAL JOURNEY – CUSTOMER CENTRICITY
EPS (reported) (EUR)                    0.19 0.17 (0.27) (0.16) 0.24
EPS (adjusted) (EUR)                    0.19 0.17 (0.27) (0.16) 0.24
P/E (reported)                          0.00 0.00 (43.4) (75.0) 49.2
P/E (adjusted)                          0.00 0.00 (43.4) (75.0) 49.2
DPS (EUR)                               0.00 0.00 0.00 0.00 0.00
Dividend yield                                       0.0% 0.0% 0.0%
BV/share (EUR)                          2.07 2.17 5.07 4.91 5.15
NAV/share                               2.07 2.17 5.07 4.91 5.15
P/BV                                    0.00 0.00 2.32 2.39 2.28
P/NAV                                   0.00 0.00 2.32 2.39 2.28
ROE (adj.)                            18.3% 7.8% -8.3% -3.1% 4.7%
RONAV (adj.)                           9.2% 7.6% -5.3% -3.2% 4.6%

                                                                            Source: DFV

17 January 2019                                                                                                                   3 / 63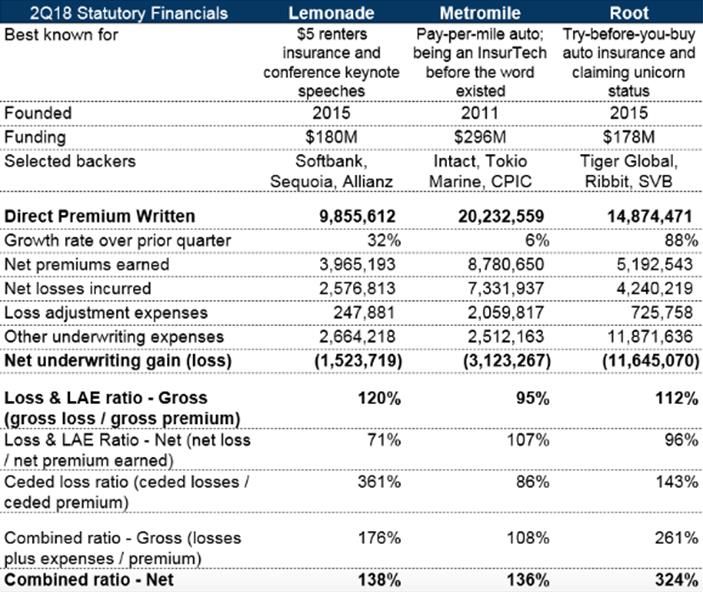
DFV OUTPERFORM
Investment case summary
Successful IPO triggers next step in The successful IPO triggers the next step in DFV’s digital journey: The
DFV’s digital journey placement of all new shares and the full exercise of the greenshoe option have
resulted in an increase of EUR 8.74m in share capital by issuance of
4,370,000 offer shares and the company has received net proceeds from the
offering in the amount of EUR 49.9m (gross proceeds: EUR 52.1m).
72% of the net proceeds of EUR 49.9m DFV currently intends to use the net proceeds from the IPO of EUR 49.9m as
will be used to fund additional spending follows:
for sales and marketing
EUR 35.9m to fund additional spending for sales and marketing
purposes, in particular by increasing advertising budgets for Google,
Bing, as well as state of the art TV channels and by financing offline
campaigns with leading German magazines;
EUR 7.2m to introduce new insurance products and bundles (such as
the reinvention of its property and accident insurance products on the
basis of its 16 matrix) as well as to internationalise its business,
starting in Benelux, France and/or Spain;
EUR 3.4m for investing in its IT infrastructure, in particular by adding
functionality to its core insurance platform, and refining its AI
intelligence processes;
EUR 3.4m for safeguarding and matching Solvency II levels.
None of the major shareholders will Following the IPO CEO Dr. Stefan Knoll (via his SK Beteiligungen GmbH), the
continue to hold more than 30% of the Community of Heirs (Erbengemeinschaft) Vogel, and Luca Pesarini (directly
voting rights in the company and indirectly through Ethenea Independent Investors) are now holding
21.15%, 20.93%, and 23.92% (formerly 18.42%, 22.39%, and 25.59%),
respectively, of the Company’s shares. As a result, none of the major
shareholders will continue to hold more than 30% of the voting rights in the
company and, thus, none of the major shareholders will hold a controlling
interest in DFV pursuant to the WpÜG (Wertpapiererwerbs- und
Übernahmegesetz) anymore.
Figure 1: DFV shareholders – Pre-IPO DFV shareholders – Post-IPO
Source: MainFirst Research, DFV
Free float of 17% The current free float amounts to 17.16%.
VPV Versicherungen as new anchor The new anchor shareholder VPV Versicherungen (15.64%), one of the
shareholder medium-sized insurance companies in Germany, has total assets of more than
EUR 8.2bn, approximately 1000 employees, and a premium income of
c.EUR 500m.
17 January 2019 4 / 64
DFV OUTPERFORM

“Henkelcareflex” is the first important       DFV is delivering on its promises: As a first milestone, DFV has started the
milestone for DFV                             cooperation with consumer goods manufacturer Henkel on an exclusive
                                              supplementary nursing care insurance for its c.9,000 employees and trainees
                                              called "Henkelcareflex". In addition to basic coverage, employees can
                                              supplement this long-term care insurance individually and also include family
                                              members – life partners, children, parents and parents-in-law.

IG Bergbau, Chemie, Energie has more          The product was launched in cooperation with the Mining, Chemical and
than 600,000 members                          Energy Industrial Union (IG Bergbau, Chemie, Energie), which has more than
                                              600,000 members. The cooperation with Henkel and IG BCE illustrates DFV's
                                              expertise in implementing social partnership models. We believe the exclusive
                                              partnership with IG BCE opens the door for further industry solutions and co-
                                              operations.

DFV has set an ambitious target of            According to DFV the cooperation with Henkel has resulted in the signing of
100,000 new customers in 2019                 several thousands of contracts since the beginning of 2019. We agree that
                                              insurance co-operations such as HenkelCareFlex are highly scalable. DFV has
                                              set itself an ambitious target of 100,000 new customers in 2019. In our
                                              financial model we are looking for 87,500 new contracts in the current business
                                              year.

DFV stands for “Digitalisation at its best”   Deutsche Familienversicherung (DFV) was founded in 2007. The company has
                                              substantially changed its business model over the last four years. DFV today
                                              offers easy-to-use, award-winning products (16 Matrix) via all relevant sales
                                              channels, whereof the direct sales channel and Direct Response TV (DRTV)
                                              together account for ~75% of total sales. Contract sign-off, policy process,
                                              customer service and claims service are fully digitalised. The ‘personnel-light’
                                              business model is supported by its scalable IT core system, which can
                                              accommodate 10x the current client base (that is, up to 5m customers) at little
                                              incremental cost.

In our model, we assume that DFV will         To finance future volume growth in Germany and abroad, introduce new
invest more than EUR 46m in the               products and bundles and further refine its information technology, DFV has
operating business over the next 2            raised net proceeds of EUR 49.9m. In our financial model, we assume that
years. The remaining c. EUR 3m are            DFV will invest more than EUR 46m (incl. EUR 3.4m in its IT infrastructure) in
budgeted as solvency capital to support       future growth over the next 2 years. The remaining EUR c. 3m (less IPO costs)
future growth                                 is budgeted as solvency capital to support future growth. In the medium-term,
                                              DFV expects dynamic customer and revenue growth, driven by sales and
                                              marketing investments, new products, including a comprehensive product
                                              bundle, its cooperation with Henkel and the IG BCE (Mining, Chemical and
                                              Energy Industries Union) and its growth strategy in additional European
                                              markets like for example France, Spain or Benelux.

We conclude that DFV can achieve a            According to our financial model, DVF can achieve an impressive business
substantial volume growth (CAGR: 22%)         volume growth CAGR of 22% in the period 2018-2025E. Statistics provided by
in the period 2018-2025E                      German health insurers’ association (www.pkv.de) show that the segments of
                                              health and nursing insurance reported declines of 0.2% (to 8.8m) and 0.4% (to
                                              9.4m) in 2016. The supplemental health insurance market reported a
                                              substantial portfolio growth of 313,800 (+1%) to 25.1m in 2016. Key driver was
                                              supplemental dental insurance, which added 421,900 policies in 2016. Please
                                              note that supplemental dental insurance is one of DFV’s award-winning and
                                              top-selling products.

We are looking for a 2018-2025E CAGR          In our model, we are looking for a 2018-25E CAGR in policies of 15%, to 1.2m.
in policies of 15%, to 1.2m                   The supplementary health insurance is expected to grow at a CAGR of 15%,
                                              while the Damage/Accident segment is expected to grow at a CAGR of 19% in
                                              the same period.

17 January 2019                                                                                                           5 / 64
DFV OUTPERFORM

The planned launch of ‘flat-fee-worry-    The planned launch of ‘flat-fee-worry-free’ product bundles (incl. Dental Care,
free’ product bundles could disrupt the   Inpatient Care, Risk Life Care etc.) could substantially increase the average
insurance market and substantially        premium volume per contract, as well as overall number of contracts and
increase business volume                  hence DVF’s business volume. We are not aware of any other competitor
                                          which plans to launch such a product as this requires a DFV like state-of-the-
                                          art IT system.

The Germans are online. The proportion    According to an ARD/ZDF online study, around 62 million people in Germany
of online users in Germany has risen to   used the Internet in 2017. The proportion of online users in Germany has thus
around 89%                                risen to around 89%. According to the D21 Digital Index 2016, around 62% of
                                          households in Germany use broadband Internet access.

The average Internet usage time per day   Even in the 60+ generation, the share of Internet users is 74%. Among 14 to
in Germany in 2017 was 149 minutes        19 year-olds, 100% are considered Internet users. With regard to the gender of
                                          Internet users in Germany, the following picture emerges: around 91% of the
                                          male and 89% of the female population used the Internet in 2017. The average
                                          Internet usage time per day in Germany in 2017 amounted to 149 minutes.

The proportion of mobile Internet users   The increasing use of mobile devices has also changed the proportion of
has substantially increased               mobile Internet users. While the proportion of Internet users using the Internet
                                          on the move in 2011 was still around 13%, it steeply rose to 63% in 2016.
                                          Around 30% of people in Germany use the Internet every day while on the
                                          move.

Adcubum: 57% of German citizens can       Already today, 57% of German citizens can imagine taking out an insurance
imagine taking out an insurance policy    policy completely online. According to a study by software manufacturer
completely online                         Adcubum ("Digitale Versicherung 2018"), the favourite categories for taking out
                                          insurance online are motor, liability and household insurance. In addition,
                                          language assistants such as Alexa are gaining popularity when taking out
                                          insurance policies.

Volume growth is needed to support our    Volume growth is needed to support our investment case. We believe that DFV
investment case. The combined ratio       has the right management and all the ingredients to disproportionately grow its
target of 85-95% looks reasonable, in     insurance portfolio. One key KPI to focus on is the combined ratio. DFV guides
our view, but there is room for further   for a combined ratio target range of 85% to 95%. In our model, we assume an
improvement                               average combined ratio of c.90%, broadly at mid-point of the company
                                          guidance. According to management, DFV currently spends up to 12 monthly
                                          premiums to acquire a new customer (MFe: competition: 29-35 monthly
                                          premiums). This nicely illustrates the competitive edge DFV has over its
                                          competitors via their simplified product offering and easy to use platform.
                                          However, we see further room for improvement in the combined ratio. Direct
                                          insurers Hastings Group in the UK (Hastings is a fast growing, agile, data and
                                          digitally focused general insurance provider to the UK car, van, bike and home
                                          insurance market) and Allianz-owned Genialloyd in Italy (# 1 direct insurer in
                                          Italy, # 5 in Europe) run their business models at an expense ratio of c. 15%.

What is different at DFV? Management      Two very important facts support our investment case compared to other
is very experienced in insurance and      InsurTechs: 1) DFV’s management knows the insurance business inside-out.
DFV is making money                       This is, in our view, a key differentiator from most of the other InsurTechs; 2) In
                                          strong contrast to most of its competitors, DFV is making money and achieved
                                          operating profits (EBIT) of EUR 2m and EUR 2.1m in 2016 and 2017
                                          respectively. In H1-18, the operating profit amounted to EUR 163,501.

17 January 2019                                                                                                         6 / 64
DFV OUTPERFORM

The key risk to our positive investment    The key risk to our positive investment case is that the substantial sales and
case is that the substantial sales and     marketing investments of c. EUR 36m will not result in the expected above-
marketing investments of c. EUR 36m        average growth in the number of contracts (2018-25E CAGR: 15%). In the
will not result in the expected above-     fiscal year 2017, DFV met the statutory minimum solvency requirements
average growth in the number of            pursuant to Solvency II. On 31 December 2017, DFV’s provisional regulatory
contracts (20-2025E CAGR: 15%).            risk-bearing capacity was 214% (previous year: 190%). DFV’s SFCR report
                                           reveals that the company’s key risks are underwriting and market risks.

An InsurTech peer comparison (e.g.         As with other InsurTech companies, traditional insurance valuation multiples
USD/contract) yields a company value in    cannot be applied to value Deutsche Familienversicherung (DFV). An
excess of USD 1bn. Based on our            InsurTech peer comparison (e.g. USD/contract) yields a company value in
discounted cash flow model (FCFE) we       excess of USD 1bn. The discounted cash flow model (FCFE) is the preferred
derive a price target of EUR 17.2, which   valuation model for DFV, as it best captures DFV’s entire growth trajectory. We
offers 46% upside to the current share     derive a price target of EUR 17.2, which offers 46% upside to the current share
price, hence our outperform rating.
                                           price, hence our Outperform rating.

17 January 2019                                                                                                       7 / 64
DFV OUTPERFORM

                                   Contents
                                   Investment case summary                                      4
                                   Financial Estimates
                                                                                              10
                                     Revenue and Earnings Model                               10
                                     Profit & Loss Account                                    13
                                     Balance Sheet                                            17
                                       Investments – Financial instruments                    18
                                       Investment income and expenses                         18
                                       Share of reinsurers in underwriting provisions         20
                                       Receivables                                            20
                                       Actuarial reserves                                     20
                                       Reserve for outstanding claims                         20
                                   Valuation
                                                                                              21
                                     Summary                                                  21
                                     Peer Group Analysis                                      22
                                       Financial analysis of US-based InsurTech companies     24
                                     DCF Analysis                                             24
                                   DFV’s digital approach
                                                                                              27
                                       Deutsche Familienversicherung (DFV) – Milestones       28
                                   The market opportunity
                                                                                              29
                                       Sales Structure and Selected Sales Activities          30
                                   DFV offers a unique business model
                                                                                              33
                                     Trigger # 1 – ‘Best’ products                            33
                                       DFV offers award-winning products                      35
                                     Trigger # 2 – Digital & event-based IT                   36
                                       Policy process                                         36
                                       Customer service                                       37
                                       Claim service                                          37
                                     Trigger # 3 – State-of-the-art IT system                 37
                                     Trigger # 4 – Experienced management team                38
                                   Risk factors
                                                                                              39
                                     2017 Solvency and Financial Condition Report (SFCR)      40
                                   Management and Supervisory Board
                                                                                              42
                                     Management                                               42
                                     CVs of the Supervisory Board                             44
                                   APPENDIX
                                                                                              45

17 January 2019
                                                                                            8 / 64
DFV OUTPERFORM

                                   Company at a glance: DFV
                                                                                                         45
                                     History                                                             45
                                     Group structure                                                     46
                                   The German Insurance Market
                                                                                                         47
                                     Today, DFV is exclusively active in the German insurance market     49
                                        Market for private supplementary health and nursing care insurance49
                                        Market for property and casualty (P&C)                           50
                                        DFV’s portfolio decomposition                                    51
                                   InsurTech in Germany
                                                                                                         52
                                        German citizens are open for ‘online’                            54
                                     DFV’s main competitors                                              54
                                     DFV – From Frankfurt to London to Las Vegas                         58
                                     DFV in the news                                                     59
                                   Appendix: Regulatory Disclosures and Disclaimer                       60
                                   Company-Specific Disclosures                                          60
                                   General Disclosures and Disclaimer                                    62
                                   International Distribution and Research Locations                     63
                                   International Distribution Locations                                  63

17 January 2019
                                                                                                       9 / 64
DFV OUTPERFORM
Financial Estimates
Revenue and Earnings Model
Our financial model for DFV includes the following four business units:
Supplementary health insurance
Damage/Accident
Other
Consolidation
The following tables show a summary of DFV’s financial model:
Figure 2: Summary DFV P/L account
Group P/L (EUR '000) 2016 2017 2018E 2019E 2020E 2021E 2022E 2023E 2024E 2025E
Written premiums
Gross 64,076 70,655 70,790 95,370 122,980 149,482 174,891 208,481 246,290 288,119
Share of reinsurers 36,319 39,659
Total written premiums 27,757 30,996
Change in unearned premiums
Gross -334 -549 256 -209 -167 -40 -139 -116 -98 -118
Share of reinsurers 337 11 515 288 271 358 305 311 325 314
Total change in unearned premiums -671 -560 -259 -497 -439 -398 -444 -427 -423 -432
Net earned premiums 28,428 31,556 36,636 57,222 71,210 84,373 97,939 117,193 138,179 161,788
Results from investments -605 1,066 659 934 1,304 1,539 1,627 1,918 2,269 2,658
of which result from associated companies 0 0 0 0 0 0 0 0 0 0
Other income 243 475 423 389 431 416 414 422 419 421
Total income 28,066 33,097 37,718 58,545 72,945 86,328 99,980 119,533 140,868 164,867
Benefits paid to customers
Gross 36,822 38,899
Share of reinsurers 20,011 20,913
Total benefits paid to customers 16,811 17,986 22,143 34,766 42,774 49,038 55,922 66,787 78,580 91,634
Expenses for insurance operations
Gross 22,208 26,044
Share of reinsurers 14,335 14,622
Total expenses for insurance operations 7,873 11,422 13,080 20,968 24,664 27,915 32,065 38,046 44,632 52,063
Investments in growth
Other expensens 1,360 1,570 7,879 5,928 760 791 828 795 807 812
Total expenses 26,044 30,978 43,101 61,662 68,198 77,744 88,815 105,629 124,018 144,509
Operating profit 2,022 2,119 -5,384 -3,117 4,746 8,584 11,165 13,905 16,849 20,359
Financing expenses 0 0 0 0 0 0 0 0 0 0
Net income before income taxes 2,022 2,119 -5,384 -3,117 4,746 8,584 11,165 13,905 16,849 20,359
Income taxes 323 637 -1,777 -1,029 1,566 2,833 3,684 4,589 5,560 6,718
Net result 1,699 1,482 -3,607 -2,088 3,180 5,751 7,481 9,316 11,289 13,640
Minorities 0 0 0 0 0 0 0 0 0 0
Net result attributable to shareholders 1,699 1,482 -3,607 -2,088 3,180 5,751 7,481 9,316 11,289 13,640
Source: MainFirst Research, DFV
17 January 2019 10 / 64DFV OUTPERFORM Figure 3: Analysis of DFV P/L account Group P/L - in % 2016 2017 2018E 2019E 2020E 2021E 2022E 2023E 2024E 2025E Written premiums Growth in GWP 1.4% 10.3% 0.2% 34.7% 28.9% 21.6% 17.0% 19.2% 18.1% 17.0% Share of reinsurers 4.5% 9.2% Total written premiums -2.3% 11.7% Change in unearned premiums Gross -120.2% 64.4% -146.6% -181.8% -19.9% -75.9% 244.8% -16.8% -15.0% 19.7% Share of reinsurers -71.8% -96.7% 4578.8% -44.1% -5.7% 32.0% -14.6% 2.0% 4.3% -3.4% Total change in unearned premiums -247.8% -16.5% -53.8% 91.8% -11.7% -9.2% 11.6% -3.9% -0.9% 2.0% Net earned premiums 1.7% 11.0% 16.1% 56.2% 24.4% 18.5% 16.1% 19.7% 17.9% 17.1% Results from investments -405.6% -276.2% -38.2% 41.6% 39.7% 18.0% 5.7% 17.9% 18.3% 17.2% of which result from associated companies Other income 2.1% 95.5% -10.9% -8.0% 10.7% -3.4% -0.5% 2.0% -0.7% 0.3% Total income -1.2% 17.9% 14.0% 55.2% 24.6% 18.3% 15.8% 19.6% 17.8% 17.0% Benefits paid to customers Gross -2.8% 5.6% Share of reinsurers 7.8% 4.5% Total benefits paid to customers -13.0% 7.0% 23.1% 57.0% 23.0% 14.6% 14.0% 19.4% 17.7% 16.6% Expenses for insurance operations Gross -6.7% 17.3% Share of reinsurers -10.8% 2.0% Total expenses for insurance operations 2.0% 45.1% 14.5% 60.3% 17.6% 13.2% 14.9% 18.7% 17.3% 16.6% Other expensens 113.8% 15.4% 401.8% -24.8% -87.2% 4.0% 4.7% -4.0% 1.5% 0.7% Total expenses -5.9% 18.9% 39.1% 43.1% 10.6% 14.0% 14.2% 18.9% 17.4% 16.5% Operating profit 185.6% 4.8% -354.1% -42.1% -252.3% 80.9% 30.1% 24.5% 21.2% 20.8% Financing expenses 0 0 0 0 0 0 0 0 0 0 Net income before income taxes 185.6% 4.8% -354.1% -42.1% -252.3% 80.9% 30.1% 24.5% 21.2% 20.8% Income taxes -300.6% 97.2% -378.9% -42.1% -252.3% 80.9% 30.1% 24.5% 21.2% 20.8% Net result 95.5% -12.8% -343.4% -42.1% -252.3% 80.9% 30.1% 24.5% 21.2% 20.8% Minorities Net result attributable to shareholders 95.5% -12.8% -343.4% -42.1% -252.3% 80.9% 30.1% 24.5% 21.2% 20.8% Group P/L - KPI 2016 2017 2018E 2019E 2020E 2021E 2022E 2023E 2024E 2025E Retention ratio 43.3% 43.9% Earned net premiums / Gross written premiums 44.4% 44.7% 51.8% 60.0% 57.9% 56.4% 56.0% 56.2% 56.1% 56.2% Earned net premiums / Net written premiums 102.4% 101.8% Claims ratio (gross) 57.5% 55.1% Expense ratio (gross) 34.7% 36.9% Combined ratio (gross) 92.1% 91.9% Claims ratio (net; as a % of Net earned premiums) 59.1% 57.0% 60.4% 60.8% 60.1% 58.1% 57.1% 57.0% 56.9% 56.6% Expense ratio (net; as a % of Net earned premiums) 27.7% 36.2% 35.7% 36.6% 34.6% 33.1% 32.7% 32.5% 32.3% 32.2% Combined ratio (net; as a % of Net earned premiums) 86.8% 93.2% 96.1% 97.4% 94.7% 91.2% 89.8% 89.5% 89.2% 88.8% Return on Investments (ROI) Operating margin (on gross written premiums) 3.2% 3.0% -7.6% -3.3% 3.9% 5.7% 6.4% 6.7% 6.8% 7.1% Operating margin (on net earned premiums) 7.1% 6.7% -14.7% -5.4% 6.7% 10.2% 11.4% 11.9% 12.2% 12.6% Tax rate 16.0% 30.1% 33.0% 33.0% 33.0% 33.0% 33.0% 33.0% 33.0% 33.0% Source: MainFirst Research, DFV 17 January 2019 11 / 64
DFV OUTPERFORM

Figure 4: Group operating profit                                         Strong group top-line growth due to investments in sales & marketing

Source: MainFirst Research, DFV

Figure 5: Group combined ratio forecast at mid-point of 85%-95% target   Strong growth in number of contracts

Source: MainFirst Research, DFV

17 January 2019                                                                                                                           12 / 64
DFV OUTPERFORM

                                                   Profit & Loss Account
                                                   Our financial model mainly focuses on the two business units
                                                   1.      supplementary health insurance - the growth engine -
                                                   2.      and damage/accident which should benefit disproportionately from DFV’s
                                                           planned expansion in Europe.

Figure 6: Supplementary Health Insurance - Profit and Loss Account
Suppl. Health Insurance (EUR '000)                        2016       2017    2018E    2019E     2020E     2021E     2022E     2023E     2024E     2025E

Written premiums
Gross                                                    45,482    53,519    62,039   86,831   111,139   132,580   151,818   177,522   205,415   235,655
Share of reinsurers
Total written premiums

Change in unearned premiums
Gross
Share of reinsurers
Total change in unearned premiums

Net earned premiums                                      20,129    24,390    32,260   52,098    64,461    74,908    85,018    99,856   115,289   132,409

Results from investments                                   -340       835       602      877     1,235     1,436     1,479     1,713     1,991     2,294
 of which result from associated companies                    0         0         0        0         0         0         0         0         0         0
Other income                                                156       331       273      253       286       271       270       276       272       273
Total income                                             19,945    25,556    33,136   53,229    65,982    76,615    86,767   101,844   117,553   134,975

Benefits paid to customers
Gross
Share of reinsurers
Total benefits paid to customers                         12,089    14,320    19,904   32,145    39,321    44,196    49,311    57,916    66,868    76,797

Expenses for insurance operations
Gross
Share of reinsurers
Total expenses for insurance operations                   6,177      8,547   10,323   16,411    19,532    21,723    24,655    28,958    33,434    38,399

Other expensens                                             797     1,163     2,774      378       238       230       282       250       254       262
Total expenses                                           19,063    24,030    33,001   48,934    59,091    66,149    74,248    87,125   100,556   115,458
Operating profit                                            882     1,526       134    4,296     6,891    10,466    12,520    14,720    16,997    19,518

Suppl. health insurance P/L - in %                        2016       2017    2018E    2019E     2020E     2021E     2022E     2023E     2024E     2025E
Written premiums
Growth in GWP                                             15.1%     17.7%     15.9%   40.0%     28.0%     19.3%     14.5%     16.9%     15.7%     14.7%
Net earned premiums                                        4.2%     21.2%     32.3%   61.5%     23.7%     16.2%     13.5%     17.5%     15.5%     14.8%
Results from investments                                -214.5%   -345.6%    -27.9%   45.7%     40.8%     16.3%      3.0%     15.8%     16.3%     15.2%
 of which result from associated companies
Other income                                             -53.2%   112.2%     -17.4%   -7.3%     12.8%     -5.3%     -0.3%      2.1%     -1.2%      0.2%
Total income                                               0.0%    28.1%      29.7%   60.6%     24.0%     16.1%     13.3%     17.4%     15.4%     14.8%
Benefits paid to customers
 Gross
 Share of reinsurers
Total benefits paid to customers                          9.9%     18.5%     39.0%    61.5%     22.3%     12.4%     11.6%     17.5%     15.5%     14.8%
Expenses for insurance operations
 Gross
 Share of reinsurers
Total expenses for insurance operations                  23.7%     38.4%      20.8%   59.0%     19.0%     11.2%     13.5%     17.5%     15.5%     14.8%
Other expensens                                         120.8%     45.9%     138.5%  -86.4%    -37.0%     -3.5%     22.7%    -11.3%      1.6%      3.2%
Total expenses                                           16.6%     26.1%      37.3%   48.3%     20.8%     11.9%     12.2%     17.3%     15.4%     14.8%
Operating profit                                        -75.5%     73.0%     -91.2% 3098.5%     60.4%     51.9%     19.6%     17.6%     15.5%     14.8%
Source: MainFirst Research, DFV

17 January 2019                                                                                                                                   13 / 64
DFV OUTPERFORM
The following charts summarise the most important KPIs for DFV’s
supplementary health insurance.
Figure 7: Suppl. health insurance - KPI
Suppl. health insurance P/L - KPI 2016 2017 2018E 2019E 2020E 2021E 2022E 2023E 2024E 2025E
Retention ratio
Earned net premiums / Gross written premiums 44.3% 45.6% 52.0% 60.0% 58.0% 56.5% 56.0% 56.3% 56.1% 56.2%
Earned net premiums / Net written premiums
Claims ratio (gross)
Expense ratio (gross)
Combined ratio (gross)
Claims ratio (net; as a % of Net earned premiums) 60.1% 58.7% 61.7% 61.7% 61.0% 59.0% 58.0% 58.0% 58.0% 58.0%
Expense ratio (net; as a % of Net earned premiums) 30.7% 35.0% 32.0% 31.5% 30.3% 29.0% 29.0% 29.0% 29.0% 29.0%
Combined ratio (net; as a % of Net earned premiums) 90.7% 93.8% 93.7% 93.2% 91.3% 88.0% 87.0% 87.0% 87.0% 87.0%
Return on Investments (ROI)
Operating margin (on gross written premiums) 1.9% 2.9% 0.2% 4.9% 6.2% 7.9% 8.2% 8.3% 8.3% 8.3%
Operating margin (on net earned premiums) 4.4% 6.3% 0.4% 8.2% 10.7% 14.0% 14.7% 14.7% 14.7% 14.7%
Suppl. health insurance P/L - no. of contracts 2016 2017 2018E 2019E 2020E 2021E 2022E 2023E 2024E 2025E
No. of contracts ('Bestand') 274,573 314,095 364,095 459,095 544,095 624,095 704,095 784,095 864,095 944,095
New contracts ('Bestand') 27,679 39,522 50,000 95,000 85,000 80,000 80,000 80,000 80,000 80,000
Growth no. of contracts 11% 14% 16% 26% 19% 15% 13% 11% 10% 9%
GWP/contract 166 170 170 189 204 212 216 226 238 250
Source: : MainFirst Research, DFV
Figure 8: Operating profit Growth in gross written premiums (GWP)
Source: : MainFirst Research, DFV
Figure 9: Development of operating margin Strong growth in number of contracts
Source: : MainFirst Research, DFV
17 January 2019 14 / 64DFV OUTPERFORM
DFV’s damage/accident insurance should support the companies’ growth
ambition outside Germany.
Figure 10: Damage/accident insurance - Profit and Loss Account
Damage/Accident (EUR '000) 2016 2017 2018E 2019E 2020E 2021E 2022E 2023E 2024E 2025E
Written premiums
Gross 18,594 17,136 8,751 8,540 11,840 16,902 23,073 30,960 40,875 52,464
Share of reinsurers
Total written premiums
Change in unearned premiums
Gross
Share of reinsurers
Total change in unearned premiums
Net earned premiums 8,299 7,165 4,375 5,124 6,749 9,465 12,921 17,337 22,890 29,380
Results from investments -140 245 71 70 83 117 162 219 291 378
of which result from associated companies 0 0 0 0 0 0 0 0 0 0
Other income 64 98 104 89 97 96 94 96 95 95
Total income 8,223 7,508 4,550 5,283 6,928 9,678 13,177 17,652 23,276 29,853
Benefits paid to customers
Gross
Share of reinsurers
Total benefits paid to customers 4,722 3,666 2,239 2,622 3,453 4,843 6,611 8,871 11,712 14,837
Expenses for insurance operations
Gross
Share of reinsurers
Total expenses for insurance operations 1,696 2,876 1,756 2,057 2,632 3,691 4,910 6,588 8,698 11,164
Other expensens 625 395 594 538 509 547 531 529 536 532
Total expenses 7,043 6,937 4,589 5,216 6,594 9,081 12,052 15,988 20,946 26,533
Operating profit 1,180 571 -39 66 334 597 1,125 1,664 2,331 3,320
Damage/accident P/L - in % 2016 2017 2018E 2019E 2020E 2021E 2022E 2023E 2024E 2025E
Written premiums
Growth in GWP -21.4% -7.8% -48.9% -2.4% 38.6% 42.8% 36.5% 34.2% 32.0% 28.4%
Share of reinsurers
Total written premiums
Change in unearned premiums
Gross
Share of reinsurers
Total change in unearned premiums
Net earned premiums -3.9% -13.7% -38.9% 17.1% 31.7% 40.2% 36.5% 34.2% 32.0% 28.4%
Share of reinsurers
Total benefits paid to customers -43.4% -22.4% -38.9% 17.1% 31.7% 40.2% 36.5% 34.2% 32.0% 26.7%
Expenses for insurance operations
Gross
Share of reinsurers
Total expenses for insurance operations -37.9% 69.6% -38.9% 17.1% 28.0% 40.2% 33.0% 34.2% 32.0% 28.4%
Other expensens -18.0% -36.8% 50.4% -9.4% -5.4% 7.5% -2.9% -0.4% 1.3% -0.7%
Total expenses -40.5% -1.5% -33.8% 13.7% 26.4% 37.7% 32.7% 32.7% 31.0% 26.7%
Operating profit -140.6% -51.6% -106.8% -270.0% 404.8% 78.6% 88.5% 48.0% 40.1% 42.4%
Source: : MainFirst Research, DFV
17 January 2019 15 / 64DFV OUTPERFORM
The following charts summarise the most important KPIs for DFV’s
damage/accident insurance.
Figure 11: Damage/accident insurance - KPI
Damage/accident P/L - KPI 2016 2017 2018E 2019E 2020E 2021E 2022E 2023E 2024E 2025E
Retention ratio
Earned net premiums / Gross written premiums 44.6% 41.8% 50.0% 60.0% 57.0% 56.0% 56.0% 56.0% 56.0% 56.0%
Earned net premiums / Net written premiums
Claims ratio (gross)
Expense ratio (gross)
Combined ratio (gross)
Claims ratio (net; as a % of Net earned premiums) 56.9% 51.2% 51.2% 51.2% 51.2% 51.2% 51.2% 51.2% 51.2% 50.5%
Expense ratio (net; as a % of Net earned premiums) 20.4% 40.1% 40.1% 40.1% 39.0% 39.0% 38.0% 38.0% 38.0% 38.0%
Combined ratio (net; as a % of Net earned premiums) 77.3% 91.3% 91.3% 91.3% 90.2% 90.2% 89.2% 89.2% 89.2% 88.5%
Operating margin (on gross written premiums) 6.3% 3.3% -0.4% 0.8% 2.8% 3.5% 4.9% 5.4% 5.7% 6.3%
Operating margin (on earned net premiums) 14.2% 8.0% -0.9% 1.3% 5.0% 6.3% 8.7% 9.6% 10.2% 11.3%
Damage/accident P/L - KPI 2016 2017 2018E 2019E 2020E 2021E 2022E 2023E 2024E 2025E
No. of contracts ('Bestand') 228,148 150,261 85,261 77,761 100,761 130,761 163,761 199,761 239,761 279,761
New contracts ('Bestand') -70,669 -77,887 -65,000 -7,500 23,000 30,000 33,000 36,000 40,000 40,000
Growth no. of contracts -24% -34% -43% -9% 30% 30% 25% 22% 20% 17%
GWP/contract 81 114 103 110 118 129 141 155 170 188
Source: : MainFirst Research, DFV
Figure 12: Operating profit Growth in gross written premiums (GWP)
Source: : MainFirst Research, DFV
Figure 13: Development of operating margin Strong growth in number of contracts
Source: : MainFirst Research, DFV
17 January 2019 16 / 64DFV OUTPERFORM
Balance Sheet
The following table shows DFV’s balance sheet (post-IPO from 2018E on):
Figure 14: DFV - Balance sheet
Balance sheet (EUR '000) 2016 2017 2018E 2019E 2020E 2021E 2022E 2023E 2024E 2025E
Assets
Intangible assets
Goodwill 0 0 0 0 0 0 0 0 0 0
Other intangible assets 9,610 9,320 9,320 24,820 34,320 31,820 29,320 26,820 24,320 21,820
Total intangible assets 9,610 9,320 9,320 24,820 34,320 31,820 29,320 26,820 24,320 21,820
Investments
Loans 0 0 0 0 0 0 0 0 0 0
Financial investments available for sale 31,711 46,357 46,566 63,671 81,866 98,785 114,627 135,647 159,009 184,676
Financial investments at fair value through profit and loss 0 0 0 0 0 0 0 0 0 0
Other investments 0 0 0 0 0 0 0 0 0 0
Total investments 31,711 46,357 46,566 63,671 81,866 98,785 114,627 135,647 159,009 184,676
Receivables
Receivables from direct insurance business
to policyholders 748 517
to insurance brokers 241 605
Subtotal 989 1,122
Other receivables 2,423 782
Total receivables 3,412 1,904 2,210 3,453 4,297 5,091 5,909 7,071 8,337 9,762
Current accounts at bank 4,658 5,510 56,237 31,237 10,237 10,237 10,237 10,237 10,237 10,237
Share of reinsurers in underwriting provisions
Unearned premiums 1,996 2,007
Actuarial reserves 14,141 22,030
Reserves for outstanding claims 4,517 5,375
Other underwriting provisions 27 1
Total share of reinsurers in underwriting provisions 20,681 29,413 48,084 55,467 71,222 77,298 87,799 99,702 112,633 128,782
Tax refund claims
from actual taxes 0 0
from deferred taxes 454 402
Total tax refund claims 454 402 369 408 393 390 397 393 394 395
Other assets 2,102 1,377 1,687 1,722 1,595 1,668 1,662 1,642 1,657 1,654
Total assets 72,628 94,283 164,473 180,779 203,930 225,289 249,951 281,513 316,588 357,325
Equity
Authorized capital 34,110 34,110 26,648 26,648 26,648 26,648 26,648 26,648 26,648 26,648
Capital reserves 3,894 3,894 45,494 45,494 45,494 45,494 45,494 45,494 45,494 45,494
Retained earnings -21,030 -19,331 -297 -3,904 -5,993 -2,812 2,939 10,420 19,736 31,025
Other reserves
Unrealized gains and losses -152 -699 -699 -699 -699 -699 -699 -699 -699 -699
Reserve from currency conversion 0 0 0 0 0 0 0 0 0 0
Subtotal other reserves -152 -699 -699 -699 -699 -699 -699 -699 -699 -699
Consolidated net income attributable to shareholders 1,699 1,481 -3,607 -2,088 3,180 5,751 7,481 9,316 11,289 13,640
Total Equity 18,521 19,455 67,539 65,450 68,631 74,382 81,863 91,179 102,468 116,108
Gross underwriting provisions
Unearned premiums 4,887 4,338
Actuarial reserves 20,201 30,941
Reserves for outstanding claims 9,480 10,714
Other underwriting provisions 762 819
Total gross underwriting provisions 35,330 46,812 40,474 57,665 76,542 91,036 107,036 128,106 150,689 176,552
Other reserves 739 484 547 590 540 559 563 554 559 559
Liabilities from direct insurance business
to policyholders 216 238
to insurance brokers 806 460
Subtotal liabilities from direct insurance business 1,022 698
Other liabilities 15,745 25,319
Total liabilities from direct insurance business 16,767 26,017 54,622 55,714 56,829 57,965 59,125 60,307 61,513 62,744
Tax debt
from actual taxes 320 315
from deferred taxes 951 1,200
Total tax debt 1,271 1,515 1,291 1,359 1,388 1,346 1,365 1,366 1,359 1,363
Total equity and liabilities 72,628 94,283 164,473 180,779 203,930 225,289 249,951 281,513 316,588 357,325
Source: MainFirst Research, DFV
17 January 2019 17 / 64DFV OUTPERFORM
Investments – Financial instruments
Financial instruments are currently held Financial instruments are currently held exclusively in the category "available
exclusively in the category "available for for sale". They are reported pursuant to IAS 39. Financial instruments are
sale" initially recognised on the fulfilment date.
Generally, fair values of financial instruments are determined based on
parameters that can be observed on the market. IFRS 13 defines the fair value
as "sales price" (price that would be received in an ordinary transaction
between market participants on the measurement date upon sale of an asset
or upon transfer of a liability). The portfolio currently consists exclusively of
stock exchange-traded financial instruments, which are valued based on
current market prices.
Pursuant to IFRS 13, the method to determine the fair values results in an
allocation to a specific hierarchy level. Comprehensive explanations of the
hierarchy levels and their underlying individual valuation procedures as well as
the used calculation parameters, are presented below.
The category "financial instruments available for sale" is a residual. It contains
all financial instruments which, due to their nature, do not have to be allocated
to another category and for which no other option has been exercised. This
item mainly shows shares, investment shares and other shareholdings.
"Financial instruments available for sale" are measured at fair value. For listed
securities, this is generally the market value.
Changes in value are recognised directly Changes in value resulting from the difference between fair value and
in equity amortised acquisition cost are recognised directly in equity.
An impairment loss is recognised through profit or loss if the fair value of equity
instruments in an active market is below cost for more than six months, or
more than 20% on the balance sheet date. Write-ups through profit or loss of
equity instruments are not permitted. Reversals of impairment losses are
recognised directly in equity.
Profits or losses on the disposal of "financial instruments available for sale" are
calculated from the difference between the proceeds from the sale and the
carrying amount on the date of sale. They are reported under investment
income or expenses. Profits or losses from an interim revaluation that were
initially recognised directly in equity are realised upon sale.
Investment income and expenses
We expect a solid result from Investment income includes current income, income from write-ups, profits
investments from 2019 onwards – 2018 from changes in fair value and profits from the disposal of investments. Current
could be negatively impacted by volatile income mainly includes interest income from fixed-interest securities and
financial markets
dividend income. The inflow principle applies to dividends; interest income is
recognised on an accrual basis.
Investment expenses include expenses for the management of investments,
depreciation and impairment losses on investments, losses from changes in
fair value and losses from the disposal of investments.
17 January 2019 18 / 64DFV OUTPERFORM Figure 15: Investment income, classification and ratings Investment income (EUR '000) 2015 2016 2017 2018E 2019E 2020E 2021E 2022E 2023E 2024E 2025E Income from investments Current income from investments 203 481 1,107 Income from additions 0 0 0 Profits from changes in fair value 0 0 0 Profits from the disposal of investments 1,124 1,161 1,931 Total income from investments 1,327 1,642 3,038 Expenses for investments Expenses for management of investments, other expenses 155 614 378 Depreciation and impariments on investments 0 0 0 Losses from changes in fair value 0 0 0 Losses from the disposal of investments 973 1,633 1,594 Total expenses for investments 1,128 2,247 1,972 Result from investments 199 -605 1,066 659 934 1,304 1,539 1,627 1,918 2,269 2,658 Financial instruments - available for sale 2015 2016 2017 2018E 2019E 2020E 2021E 2022E 2023E 2024E 2025E Not fixed interest - shares 3,259 3,021 7,675 - investment fund units 4 5 5 - other (incl. accounts) 8,638 24,189 36,376 Total I 11,901 27,215 44,057 Fixed interest+call monies 3,728 4,496 2,300 Total II 15,629 31,711 46,357 46,566 63,671 81,866 98,785 114,627 135,647 159,009 184,676 Credit quality of the portfolio (in thousands) 2015 2016 2017 2019E 2020E 2021E 2022E 2023E 2024E 2025E AAA 3,136 3,926 5,595 AA 597 2,508 6,335 A 730 2,879 4,408 BBB 4,539 14,876 20,038 BB and lower 0 0 0 No rating 0 0 0 Total 9,001 24,189 36,376 Credit quality of the portfolio (in %) 2015 2016 2017 2018E 2019E 2020E 2021E 2022E 2023E 2024E 2025E AAA 34.8% 16.2% 15.4% AA 6.6% 10.4% 17.4% A 8.1% 11.9% 12.1% BBB 50.4% 61.5% 55.1% BB and lower 0.0% 0.0% 0.0% No rating 0.0% 0.0% 0.0% Total 100.0% 100.0% 100.0% Source: MainFirst Research, DFV 17 January 2019 19 / 64
DFV OUTPERFORM
Share of reinsurers in underwriting provisions
DFV makes use of reinsurance to grow According to IFRS, reinsurers' shares in underwriting provisions are shown
the business and to reduce volatility in under assets in the balance sheet. The corresponding gross amounts have to
its results be shown on the liabilities side. The reinsurers' shares in underwriting
provisions are determined by taking the contractual terms of the underlying
At the end of 2017 the following
reinsurance contracts into consideration.
companies were major reinsurance
partners: Receivables
Receivables mainly include interest receivable, receivables from direct
BNP Paribas Cardif Allgemeine
insurance business (dIB) and accounts receivable from reinsurance business.
Versicherung
They are reported at nominal value less payments made. Based on past
Echo Rückversicherungs AG,
experience, a standardised specific allowance is made for receivables from the
Schweiz, Zurich dIB. Credit risks are adequately taken into consideration after an individual risk
assessment.
E+S Rückversicherung, For reinsurance, allowances are made on a strict case-by-case basis. Write-
Hannover
offs through profit and loss are generally only made in the case of insolvency.
Based on past experience, no further allowances are made, even with regard
Hanse Merkur
to essential items.
Reiseversicherung
In the DFV Group, allowances through profit and loss are made and reduce the
Helvetia Schweizerische premium income and the book value of the receivables. If fair values of
Versicherung receivables are to be determined for the required disclosures in the notes, it is
assumed pursuant to IFRS 7.29 (a) that the carrying amount represents the
Partner Reinsurance Europe best approximate value. According to the regulations of IFRS 13, this results in
an allocation of these fair values to hierarchy level 3.
SCOR Global Life Deutschland
Actuarial reserves
VIG Re as, Prague For health insurance business conducted like life insurance, the company
strictly calculates according to the actuarial equivalence principle, i.e. the
present value of premiums and benefits are calculated in parity during the
initial calculation. Unless premium adjustments have to be made, the
premiums per tariff and policyholder will remain the same throughout the life of
the policyholder.
Reserve for outstanding claims
The reserve for outstanding claims represents benefit obligations from claims
for which the amount and/or time of payment cannot yet be reliably
determined. The reserve is reported but is also created for claims that have
already been incurred but not yet reported. This also includes both internal and
external expenses as well as claims settlement costs.
For known claims, the reserve for outstanding claims is generally calculated
individually. Receivables from recourses, claim recoveries and distribution
agreements are offset. For claims incurred or caused but not yet reported as of
the balance sheet date, the reserve was increased by a reserve for claims
incurred but not reported as of the balance sheet date based on the
subsequent claims reports observed in previous years. Claims not yet reported
at the balance sheet date are assessed with a lump sum. The reserve for
outstanding claims is not discounted. The reserves for claims settlement
expenses also included in this item are determined using a lump-sum method.
The share of reinsurers in the reserve is determined pursuant to the
reinsurance contracts.
17 January 2019 20 / 64DFV OUTPERFORM
Valuation
Summary
We cannot apply traditional insurance As with other InsurTech companies, traditional insurance valuation multiples
valuation multiples to value DFV cannot be applied to value Deutsche Familienversicherung (DFV). The
following tables show valuation multiples which are currently paid by investors
for traditional German and Swiss insurance companies.
Figure 16: Valuation overview - Swiss/German insurers
Market Div.
Price Share Up/ Cap EPS PE P/NAV RoNAV P/B RoE Yield
Company Rating Target Price Down (EUR bn) 2018 2019 2020 2019 2020 2019 2020 2020 2020 2020 2020
INSURANCE
Allianz Neutral 210 179 +17.3% 75.7 17.5 18.7 19.6 9.5 9.1 1.41 1.30 14.2% 1.10 12.4% 5.3%
Bâloise Outperform 170 145 +17.3% 6.27 11.5 13.1 13.9 11.0 10.4 1.02 0.98 8.9% 0.97 9.0% 4.8%
Hannover Re Outperform 125 123 +1.8% 14.8 8.33 10.1 10.4 12.1 11.8 1.63 1.55 13.2% 1.53 13.3% 4.3%
Helvetia Neutral 590 600 -1.6% 5.25 50.7 51.1 51.3 11.7 11.7 1.37 1.24 10.6% 1.00 8.9% 4.3%
Munich Re Outperform 205 192 +7.0% 27.0 16.4 18.2 19.9 10.5 9.6 1.25 1.18 12.5% 0.89 9.5% 5.0%
Scor Neutral 35.0 41.5 -15.8% 7.73 2.88 3.49 3.72 11.9 11.2 1.32 1.24 11.1% 1.08 9.9% 4.7%
Swiss Life Outperform 400 402 -0.5% 11.4 30.1 32.1 34.4 12.5 11.7 1.00 1.01 8.7% 0.91 7.8% 5.1%
Swiss Re Outperform 105 93.6 +12.2% 25.7 8.54 9.17 9.17 10.4 10.4 0.98 0.98 9.7% 0.89 8.8% 5.5%
Talanx Neutral 34.0 31.8 +6.8% 8.05 2.81 3.39 3.49 9.4 9.1 0.88 0.85 9.4% 0.79 8.9% 4.9%
Zurich Insurance Outperform 350 305 +14.9% 39.7 24.9 30.8 32.0 10.1 9.7 1.51 1.44 14.9% 1.34 14.1% 7.4%
Group
Sector 222 10.9 10.5 1.24 1.18 11.3% 1.05 10.3% 5.1%
Source: MainFirst Research
Valuation multiple expansion in the The following two tables explain the development of the P/E and P/BV
traditional insurance segment multiples for Allianz, which we consider to be a good market proxy. The ten-
year median for the P/E multiple was 8.7x and for the P/BV multiple 0.97x.
Figure 17: Development of the P/E and P/BV multiples for Allianz
Source: MainFirst Research, Factset
We compare DFV with InsurTech With regard to valuation, we believe that one approach could be to compare
companies and calculate the net present DFV with InsurTech companies such as ottonova, Lemonade or Oscar. In
value of DFV’s investments addition we have built a DCF-based valuation tool, which reflects DFV’s
earnings power following the successful investments in its future growth.
17 January 2019 21 / 64DFV OUTPERFORM
Peer Group Analysis
The InsurTech segment in Germany is booming and the investment rounds in
the young segment are getting bigger and bigger.
ottonova, with a few hundred customers, Munich-based health insurer ottonova (https://www.ottonova.de), which started
is valued at USD 115m business on 21 June 2017, is said to have between 200 and 1,000 customers
(the founder declined to give an exact number). The company is valued at
c.USD 115m. ottonova was the first new health insurance company to be
founded in Germany in almost two decades.
In the US InsurTech space there are Looking at the US InsurTech market, valuations are even more impressive.
many “unicorns” around Health insurer Oscar is valued at c.USD 3.2bn
https://www.hioscar.com/ny
Car insurer Root is valued at c.USD 1bn
https://www.joinroot.com
Renters and home insurer Lemonade is valued at c.USD 1bn
https://www.lemonade.com
In the following table we have summarised a few key figures of the above-
mentioned InsurTechs.
Figure 18: Peer Group Comparison
Source: Herbert Frommes „Versicherungsmonitor“: https://versicherungsmonitor.de/2018/08/30/us-insurtechs-wachsen-aber-noch-nicht-
profitabel/ // https://www.ottonova.de/SFCR_2017.pdf
DFV merits a valuation in the same Although a valuation pattern is not visible in the table above, we conclude that
broad range as other InsurTech Deutsche Familienversicherung merits a valuation in the same broad range for
companies the following reasons:
In strong contrast to many other InsurTech companies, DFV is
profitable. The company generated 2016 and 2017 operating profits of
EUR 2.0m and 2.1m respectively.
At the end of 2017, DFV’s insurance portfolio amounted to 464,356
insurance contracts.
DFV owns a scalable digital insurance platform designed to
accommodate 10x the current customer base.
DFV offers easy-to-understand, award-winning insurance products.
DFV is run by a very experienced management team, most of whom
have spent decades in the insurance industry.
InsurTechs have secured substantial In addition to ottonova, several other companies in the German InsurTech
amounts of money to wake up the larger segment are competing for customers. Intermediaries and brokers such as
players in a global market with total simplesurance (known in Germany as the insurance service Schutzklick)
business volume (premiums) of USD and Clark, a digital insurance manager, have just secured USD 24m and USD
4,891bn 29m respectively to drive their businesses forward. The insurance manager
Wefox, formerly known as FinanceFox, has secured EUR 55m so far. Under
17 January 2019 22 / 64DFV OUTPERFORM
the name One, the start-up recently launched its own insurance company.
simplesurance, on the other hand, allied itself with the digital insurer Element
in order to offer its own digital policies. Coya, another digital insurance with a
BaFin licence, has already secured around USD 40m – from Valar Ventures,
Peter Thiel, eVentures and La Famiglia, among others. Coya is competing to
"become Europe's leading digital insurance company".
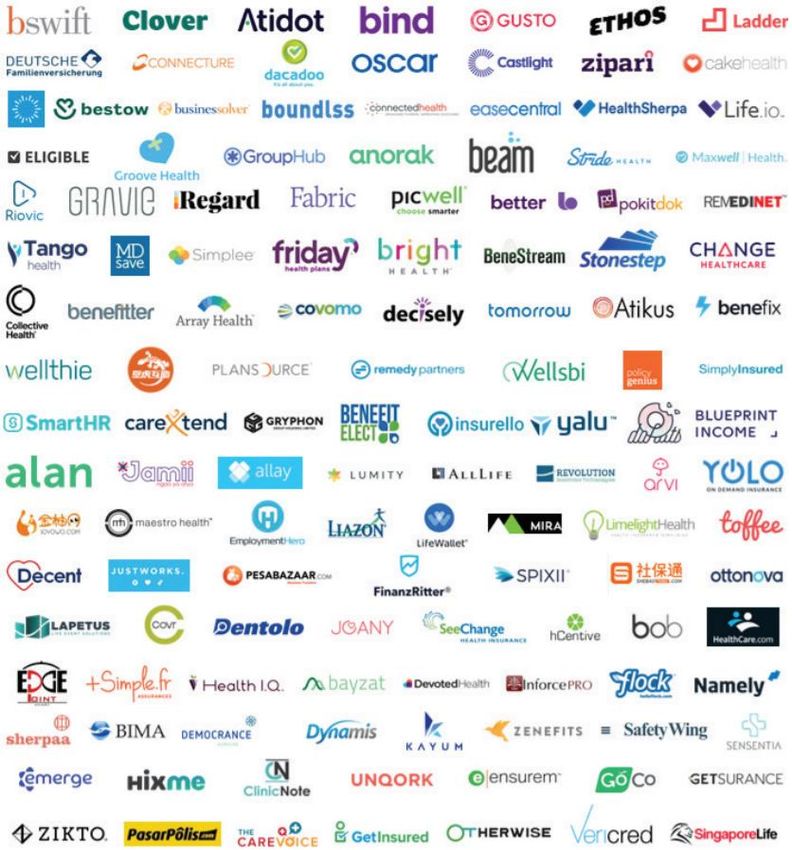
The InsurTech segment has become the According to Willis Tower Watson, the once sleepy world of insurance has
hot ticket for venture investors become the hot ticket for venture investors. Insurance technology companies
have raised many billions of dollars in the past four years.
Figure 19: Selected InsurTech companies in the Life & Health sector
Source: Willis Tower Watson
17 January 2019 23 / 64DFV OUTPERFORM
Financial analysis of US-based InsurTech companies
InsurTech financials are not yet In Matteo Carbone’s blog, ‘Q2-18 in InsurTech financials’, we found this
convincing summary of the Q2-18 statutory financials of three venture-backed insurance
companies. In the US, only insurance companies have to file statutory results,
not agents and brokers (i.e., most InsurTech underwriters).
Figure 20: Peer Group Comparison
Source: Statutory filings
DFV’s operating profit could increase The most interesting observation is the net combined ratio (from 136% to
tenfold in the next five years 324%) of these companies. This clearly shows that none of the three
InsurTech companies mentioned currently posts any profits. However, their
investors are betting that all three companies will become very successful in
the future, hence the optimistic valuations of between USD 1bn and USD
3.2bn. Investors should keep in mind that DFV is already generating an
operating profit of EUR 2m, which could increase tenfold in the next five years.
DCF Analysis
As traditional valuation multiples do not ‘work’ to value Deutsche
Familienversicherung (DFV), we use the Free Cash Flow to Equity (FCFE)
method. This valuation method is based on the work of Richard Goldfarb’s
‘P&C Insurance Company Valuation’.
DFV has no debt outstanding FCFE is very similar to the Free Cash Flow to the Firm (FCFF) method, but it
reflects free cash flows after deductions for interest payments (please note that
DFV has no debt outstanding), net of any tax consequences of these interest
payments, and any net change in borrowings (i.e. repayment of debt and new
debt issued).
17 January 2019 24 / 64DFV OUTPERFORM
The typical textbook definition of FCFE and a simplified definition of FCFE for
P&C insurers are summarised as shown in the following tables:
Figure 21: Definition of Free Cash Flow to Equity (FCFE) Simplified definition of FCFE for P&C insurer
Source: P&C Insurance Company Valuation, Richard Goldfarb, FCAS, CFA, FRM
Increases in insurance reserves have a For a P&C insurer, the most significant of the “non-cash” expense items on the
large impact on the reported income, but income statement are the increases in the loss and expense reserves. These
not on the actual cash flow reserve increases could have a substantial impact on the reported income but
not on the actual cash flow. This would seem to suggest that changes in
reserves could be added back to net income, but we understand that this is not
the case.
When calculating FCFE, changes in loss The FCFE represents the cash flow that could be paid to shareholders in any
and expense reserves can be included particular period. In the simple case of a two-year insurance policy where the
in the definition of capital expenditures. firm collects the premium net of expenses up front and then pays claims at the
Since these changes in reserves reflect end of the second period, it would not be sufficient to treat the net premiums as
the most significant non-cash charges, the (positive) free cash flow in the first period and the claim payments as the
which according to the usual definition of (negative) free cash flow in the second period. This is because some of the
FCFE would be added back to net
premium collected in the first period is not free to be paid to shareholders.
income, and also reflect a significant
portion of capital expenditures, which
Instead, some portion of the premium must be held in claim reserves. The
would be subtracted from net income, implication of this is that, when calculating FCFE, changes in loss and expense
these two adjustments will cancel each reserves can be included in the definition of capital expenditures. Since these
other out changes in reserves reflect the most significant Non-Cash Charges, which
according to the usual definition of FCFE would be added back to Net Income,
and also reflect a significant portion of Capital Expenditures, which would be
subtracted from Net Income, these two adjustments will cancel each other out.
The result is that the increases in loss and expense reserves, which have
already been reflected in the net income figures, can be ignored in the steps
used to estimate FCFE through adjustments to net income.
Notice that two other components of the free cash flow to equity calculation
include changes in net working capital and capital expenditures. Both of these
amounts represent uses of cash flow needed to maintain the firm’s operations
and support the growth that is planned. Working Capital Investment shown in
the above table reflects net short-term (non-cash) assets held to facilitate
company operations, such as inventory or accounts receivable. Capital
Expenditures typically refer to investment in property, plant, equipment and
other physical items. For P&C insurance companies, net working capital is not
typically significant and will not be discussed in detail here.
Capital expenditures include increases The definition of capital expenditures for P&C insurance companies is more
in capital held to meet regulatory complicated, because it must be adjusted to include changes in loss and
requirements (e.g. Solvency II). expense reserve balances as well as increases in capital held to meet
regulatory requirements (e.g. Solvency II), consistent with the company’s
business plan. Such regulatory minimum capital requirements should be
treated as "capital expenditures" for the purposes of determining free cash
flow. Furthermore, the ability of an insurer to meet its growth and profitability
targets is tied closely to public perception of its financial strength.
17 January 2019 25 / 64You can also read