2021 Budget - Tax Scenarios and Options - November 4, 2020 - Tax Scenarios and Options: 2020 Nov 4
←
→
Page content transcription
If your browser does not render page correctly, please read the page content below
2021 Budget – Tax Scenarios and Options
              November 4, 2020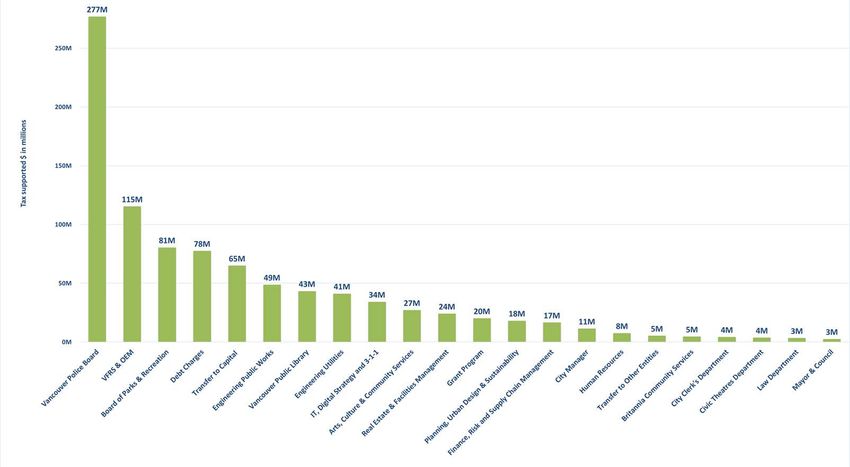
Agenda

• 2021 Budget update
• Budget scenario highlights
• Public engagement results

                               2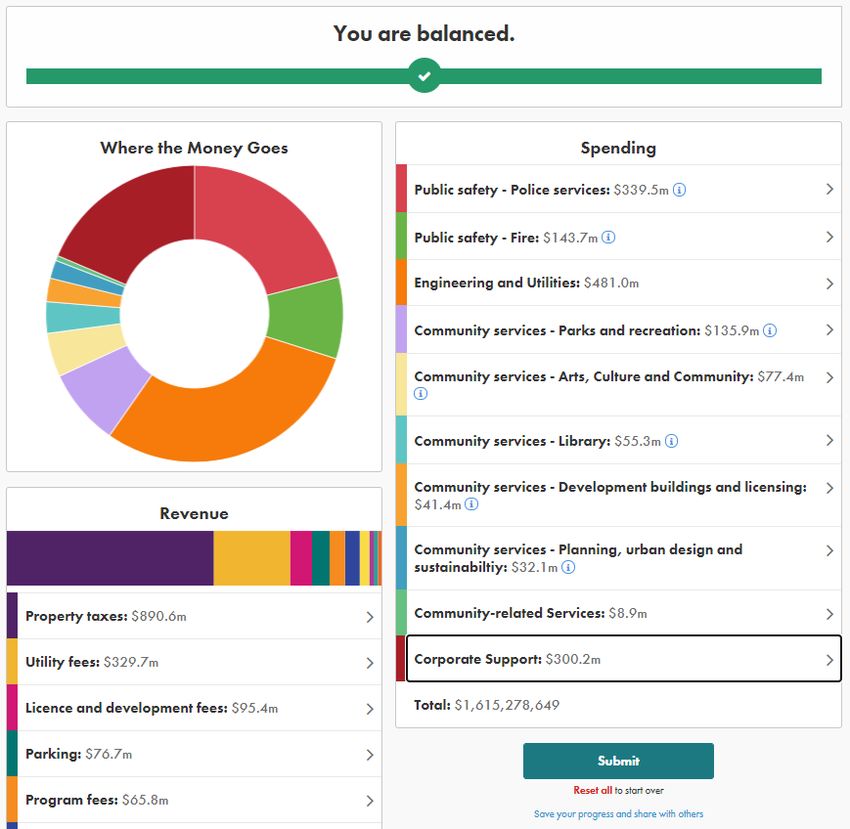
Council direction from Budget outlook

Staff will be reporting to Council on Nov 4th in response to the following motion:

THAT Council direct staff to bring forward a proposed 2021 Budget and Five
Year Financial Plan with options for a tax increase of up to 5% that supports
Council’s priorities.

For the median single-family home assessed at $1.6M, a 5% tax increase
would result in a $146 increase in tax in 2021;

FURTHER THAT Council direct staff to provide the first iteration of the 2021
Budget for information in late October.

                                                  3
2021 Budget Update
42021 Budget Update
• We are taking a conservative and flexible approach to building the 2021
Budget
• Despite our financial challenges, and the increased effort and costs
involved in responding to the pandemic, we are continuing to deliver on the
important services that residents and businesses expect every day
• We are continuing to take measures to reduce costs, but must balance this
with the need to protect core services
• Staff are providing Council with options for property tax increases
percentages, each of which requires some trade offs
5Budget Approach
Conservative and flexible approach to building the 2021 Budget:
• Budgeting for revenues to be below normal in 2021, based on trends over
the past few months
• Include adequate contingency for COVID-related risks and other
uncertainties (e.g. collective bargaining)
• There remains significant financial uncertainty for 2021
• but as circumstances change – e.g. if our revenues increase or once the amount of
government funding coming to Vancouver is known – we will remain flexible and be ready
to reactivate work that had to be put on hold
62021 Budget Summary – Base Budget Scenario
$ in M 2020 Budget 2021 Draft $ Change % Change
Revenues 1,616 1,598 (18) (1.1%)
Expenses 1,616 1,598 (18) (1.1%)
Net - - -
Highlights:
• Revenue declines due to lower parking revenues, lower licence and development revenues, lower program
and other revenues
• Maintain discretionary savings and 1% - 2% reduced staffing level from the 2020 budget with associated
reduced service levels
• 2021 full year operating costs for previously closed facilities i.e. Parks, libraries etc.
• Fixed costs i.e. wages and benefits, equipment and fleet, insurance rates, operating impacts of previously
approved capital projects etc.
• Business adaptation costs related to COVID
• Reserve transfer of $57M
72021 Budget Decisions - Trade-offs Required
• Resume most services • Increased service demand - • Tax and Fee Increases
Street disorder/ cleanliness;
• Staffing to deliver and support homelessness; opiod crisis • One Time actions:
service delivery - at lower • Reserves
service/staffing level than 2020 • Advance council priorities: • Funds from Capital deferral
budget Affordability, Equity, Climate • NOT SUSTAINABLE
Change, Economy
• Expense increases for fixed • 2022 impact: Revenue returns
costs and COVID costs to prior levels or significant
Tax/Fee and service impacts
• Use existing resources to
advance priority initiatives
Delivery of Funding -
External pressures
Services 2021/2022
Given the uncertainty, the MOST PRUDENT approach is to limit new initiatives, wherever possible, until
later in 2021 or in 2022 when revenues improve or additional senior funding is available – at that point
identify additional initiatives from the prioritized list to fund
8Reserves
• Reserves are a one-time funding sources, and a balance needs to
be maintained to respond to future potential events (for example,
snow/storm)
• If revenue declines continue in 2022 and beyond, it will be
necessary to adjust service levels and/or raise taxes
• Reserve balances will need to be replenished over time
9Budget Scenarios
102021 Tax Supported Expenditures
Given the magnitude of police,
and fire services, any
reductions to Property Tax
related services will need to
include Police and Fire
11Historical tax increase (2010-2020)
2010 – 2020 Average:
Residential: 3.7%
Non-residential: 2.3%
12Indicative City Property Tax Impact
0.5%Tax shift to residential
Property Tax Increase 5.0% 4.0% 3.0%
Residential properties +0.9% 5.9% 4.9% 3.9%
Non-residential (1.2%) 3.8% 2.8% 1.8%
Indicative City Property Tax Impact of 2021 Budget
Assessed Value of Property Estimated 2021 Change over 2020 Change over 2020 Change over 2020
(without Land Assessment Tax Bill
Averaging) (CoV Portion) 5% 4% 3%
Median residential strata unit
$1,144 $64 $53 $42
assessed at $688,000
Median overall residential unit
$1,853 $104 $86 $68
assessed at $1,114,000
Median single-family home
$2,607 $146 $121 $96
assessed at $1,567,300
Median business property
$4,559 $166 $123 $79
assessed at $1,012,700
*Includes impact of council-directed 2021 tax shift of 0.5% property tax share from Non-Residential to Residential Classes
13Budget Scenarios
OPTIONS FOR $8M
FUNDING AVAILABLE
SCENARIOS FROM CAPITAL PLAN
BASE SCENARIO 1. Advance 2020
5+%
deferred
1. Full year operating costs initiatives and
5%
of closed facilities, fixed new council
cost increases, highest motions (see
priority critical risks and 1. Deferral of renewal prioritized list)
core service gaps
4.3%
capital projects as per
the Capital Plan
recalibration used to 2. Address core
2. Council priority initiatives 1. Deferral of renewal
i.e. Vancouver plan, reduce tax by 0.7% business risks
3%
capital projects as per and service
temporary patio permits, the Capital Plan
veterans parking gaps by filling
recalibration used to outstanding
reduce tax by 0.7%
vacancies
3. Vacancy savings in all
depts. and Boards at the 2. Additional layoffs and/or
1%-1.8% core business attrition including 3. Reduce
level reduced service levels in reliance on
public safety, facility reserves
4. Deferral of renewal hours or closures
capital projects as per 4. Reduce tax
the Capital Plan
recalibration available to
increase for
fund prioritized list of 2021
options Not recommended by staff
14 14Building the 2021 budget – base scenario
• Property tax increase would be 12% to balance the budget
• Revenues below budget by $60M
- Approximately 7% tax increase would be needed to bridge the gap
- Development fees would need to increase over 20% to balance for 2021
• 2021 budget reflects majority of services restarted and associated costs
- Staffing held at 1-2% below 2020 budget with associated service impacts
• Higher costs added to support provincial health requirements where needed
• Fixed costs added
- Tax increase to support planned expenditures would be 5%
• Filling revenue shortfall with reserves of $57M (or with senior gov. funding when available)
• Approx. $8m of funding freed up through the Capital Plan recalibration is available:
1. fund new initiatives and recent council approvals (primarily one time)
2. reduce the tax increase for 2021 by ~0.7% (would be a delay for one to two years)
3. reduce the draw on reserves from $57m to $51m, preserving stabilization reserve for future years’ emergencies and
uncertainties.
155% Base scenario $8M savings available
• $8M savings from the capital plan recalibration are being redirected to
operating budget
• Savings will be allocated towards recent council approvals impacting 2021:
• Free parking for veterans ($0.5M)
• TEPP program ($2M)
The remaining $6M could be used for any or combination of:
a) Reducing the tax increase for 2021
b) Reducing the reserve transfer
c) Council Priority initiatives and core business initiatives not included in base
scenario (details listed in excel file)
164.3% scenario
• The ~$8M capital plan funding will be used to fund recent council approvals:
• Free parking for veterans ($0.5M)
• TEPP program ($2M)
• The $6M remaining unallocated savings from the capital plan recalibration
would be used to reduce tax to 4.3%
173% scenario
The 3% scenario involves significant service impacts and layoffs of staff in tax-funded
services areas, as this would be in addition to the 1-2% built into the Base scenario,
and is not recommended by staff at this point given the impact on services during the
pandemic, primarily essential services such as public safety.
To realize savings Council would need to provide direction on the areas to implement
service reductions
• Few examples:
• Police will have to a reduce 106 police officers which will negatively impact the VPD's ability to respond to calls from the public
and address crime in our community, result in delayed response times, and increase officer burnout
• Fire will have to layoff 25 staff which is taking a heavy apparatus out of service in addition to not staffing Medic 11
• Engineering would need to reduce its funding towards its infrastructure maintenance program, resulting in further deterioration
of the condition of its assets into the poor and very poor categories; deferral for regular maintenance program will result in
more frequent failure and much more costly repair in the future
• Park Board to reduce staff by approximately 20 full time equivalent through vacancies or layoffs resulting in fewer maintenance
visits to parks, increased complaints, delayed response times, some assets may remain out of service for longer periods of
time which may put the asset at risk, and increased potential for negative impact on the health and safety of Park Board Staff
resulting from increased demands with reduced resources. It is important to note that the pandemic has led to a +100%
increase in the usage of our Parks assets.
• Reduced hours or closure of 2 small branch libraries and service hours reduction; 230,000+ public visits affected & 19 FTE
• Further details available in accompanying excel file (Sheet 4)
18Information available – Building the 2021 Budget
List of options which further council
priorities and core business risks and gaps
Prioritized not included in any scenario
list of •Sheet 1- Prioritized Initiatives (List of prioritized Council
Priorities initiatives and Core Business initiatives)
initiatives
Recommended items related to List of planned priority actions, where
critical risks and service gaps existing budgets have been
included in the 5% deployed to progress Council’s
•Sheet 2- Critical Service Risks & Gaps and Council priorities
Priorities •Sheet 3- 2021 Budget Aligned to Council Priorities
Detailed service impacts related to a 2021 Budget Summary at Base
Supporting 3% scenario Scenario
Information •Sheet 4- 3% Scenario: List of options to reduce the tax
increase from 5% to 3%
•Sheet 5- Budget Table: 2021 Budget versus 2020
Budget
Reduced staffing level Update on new council motions and
•Sheet 6- Summary of the 1% - 2% reduced staffing 2020 Deferred Investments
level from the 2020 budget with associated reduced •Sheet 7- 2019-2020 Council Motions list
service levels
•Sheet 8- 2020 Deferred Investments - Risks and Gaps
•Sheet 9- 2020 Deferred Investments - Council
19 PrioritiesPrioritized list of initiatives includes:
Bringing back staffing to 2020 levels i.e. removing the
1%-1.8% vacancies included in the 5% base scenario
Prioritised initiatives by council priorities and core
services
Deferred initiatives from 2020
New Council Motions
20Prioritized list of initiatives
A prioritized list of initiatives, not included in the 5% base scenario, has been compiled by staff
including:
• Deferred initiatives from 2020
• New Council Motions
• Details available in accompanying excel file (Sheet 1)
Staff have provided their best estimates of the priority of items based on:
• Addressing critical service gaps and risks
• Prioritizing Urgency/Timing
• COVID related
• In progress (e.g. Vancouver plan)
• Prioritizing impact of the initiative on the desired outcome of the Council Priority
Council can provide direction to add to the 5% budget scenario either by allocating capital plan
savings, increasing property tax, or providing direction to reduce service levels in tax-funded areas
to offset adding new items from the prioritized list
• Summary of the tax-funded services available in the accompanying excel file (sheet 11)
21How were the prioritized list of initiatives created?
The option lists were created from:
1. List of Council motions
• Details available in accompanying excel file (Sheet 7)
2. List of initiatives deferred from 2020
• Details available in accompanying excel file (Sheet 8 and 9)
3. Core Business service gaps
• Details available in accompanying excel file (Sheet 1)
City staff have suggested a prioritization of Council priority initiatives from items 1 and 2 above,
that can be referenced by Council should they choose to
a. have a higher tax increase than 5%
b. utilize some of the Capital Plan savings in 2021
c. replace an existing initiative with one from this list.
22Examples of initiatives on the prioritized list
Address Affordability • Vancouver Affordable Housing Endowment Fund - Resourcing and portfolio set up,
Partner Agreements – Coordinator and planners, Housing resources focused on data
and the Housing analytics Program costs, Evaluate key drivers of Affordability specific to Vancouver,
Crisis etc.
• ELER Implementation investments, Small Business Policy and Recovery Initiatives
Protect and Build a Investment, Culture|Shift Recovery Investments Year 2, COVID Response and
Resilient Local Recovery Investments, Culture|Shift Operating Investments additional Reconciliation,
Economy Redress, and Equity Investments, etc.
Increase Focus on • Anti Racism/Cultural Redress, Decriminalizing Poverty, Equity Based Budgeting,
Equity and Critical Expansion of fine free service for libraries, Reconciliation programming in parks and
Social Issues community centres, South Asian Apology motion etc.
Accelerate Action On • Implementation of one additional bus priority corridor, Support for Active Travel to
Climate Change Schools program, Walking/cycling improvement, EV charging infrastructure, etc.
Deliver Quality Core
• Core business risks and service gaps by filling outstanding vacancies, operational
Services that Meet reviews etc.
Residents' Needs
23Stabilization Reserve
• At the end of 2020, stabilization reserve balance expected to be @7% of non-
tax/utility revenues (target 8-16%) without provincial recovery
• after drawing down $34M for the 2020 budget
• In 2021, reserve balance expected to be @3%, without provincial recovery
• after drawing down $57M for the 2021 budget
• With estimated provincial recovery, the reserve level would around 4%-5% in 2021
• Minimum 4% required for items already committed
• 1% increase in reserve level would require ~$13M. Will need to be replenished over
the next few years
24Next Steps
Further detailed information provided to Council to inform their deliberations on the 2021 Draft budget on
December 1st and 8th.
A. Summary of ongoing services in the Bases budget scenario aligned to Council priorities: staffing reduced
by 1-2% and associated service impacts; additional fixed and COVID costs included.
• Details available in accompanying excel file (Sheet 2)
• Council may choose to reduce service levels in base scenario to free up capacity for new initiatives
• Details available in accompanying excel file (Sheet 6) for 1% - 2% reduced staffing level from the 2020 budget
by department
B. Review options to allocate Capital funds made available from the Capital Plan recalibration
• Use to fund additional priority initiatives - Staff will include this option in the draft budget
• Use to reduce the tax increase in 2021 (from 5% to 4.3%)
• Use to reduce the planned reserve transfer from $57m to $51M
C. If used for additional priority initiatives in B above
• Council may review Sheet 1 and consider any changes from staff’s recommendation
25Public Engagement
26Engagement Overview
What we hoped to learn...
• Understand relative importance of City Council’s priorities and types of City services
• Gauge preferences for delivering a balanced budget and managing service delivery
• Seek input on opportunities to adjust costs and revenues
Engagement method Timing Touchpoints
Shape Your City project pages Aug. 17 - present 10.6k visits (as of Oct. 21)
1,222 interactions
Talk Vancouver survey Aug. 17 - Sept. 20 8,378 survey completes
Budget simulation educational tool Aug. 17 - Sept. 20 551 submissions
In-person outreach Aug. 17 – Sept. 25 ~100 hard-copy surveys*
* Additional survey submitted online
27Engagement Overview
New for this year:
• Civic Satisfaction survey postponed until 2021
(normally takes place in spring)
• Shape Your City digital engagement pages in six
languages: English, Traditional/Simplified Chinese,
Punjabi, Vietnamese and Tagalog
• “Balance the Budget” educational tool allowing
residents to +/- City revenue and spending
categories
• Targeted outreach, including hard-copy surveys,
focusing on DTES community centres and some
libraries
28Engagement Overview
How we promoted engagement:
Online Offline
• Information Bulletin issued Aug. 17 • Print ads in:
• Shape Your City landing page • Vancouver is Awesome (Courier)
• Vancouver.ca – “what’s new” on homepage • Ming Pao
and on budget webpage • Sing Tao
• Social media - Facebook, Twitter and • South Asian Link (The Link)
Instagram (e.g. Instagram stories) • Posters in reopened community centres
• Budget “explainer” video for Shape Your • In-person outreach (e.g. during existing
City, vancouver.ca and social media community centre programming)
• Email invite to Talk Vancouver panelists
• Email invite to BIAs, neighbourhood
houses, settlement agencies and others
29Talk Vancouver Survey
Original survey Vancouver population
Demographic group
sample - residents (Census 2016) • 8,378 respondents, including
GENDER – weighting NOT applied*
Female 51% 51%
7,573 residents & 805 business
Male 39% 49% owners – twice as many survey
Transgender 1% n/a
None of the above 2% n/a
completes as last year
Prefer not to say 6% n/a
AGE – weighting applied
18-39
40-49
56%
15%
44%
16%
• Survey data weighted based on
50-59 12% 16% 2016 Census data to increase
60 and over 17% 24%
RESIDENTIAL ZONE - weighting applied
representativeness of results
Downtown and West End 19% 17% • Residents: Weighted based on Census
NW - north of 16th and west of Main 23% 16% data for age and geographic zone
NE - north of 16th and east of Main 25% 17%
SW - south of 16th and west of Main 14% 19%
• Businesses: Weighted based on
SE - south of 16th and east of Main 19% 31% business size (not shown)
* Weighting based on gender did not significantly change results
30Early Survey Findings: Council Priorities
• Delivery of Core Services highest ranked priority overall
• Significant differences in ranking of Council Priorities based on age
Delivery of Core Affordability and Equity and Social
Economy Climate Change
Service Housing Issues
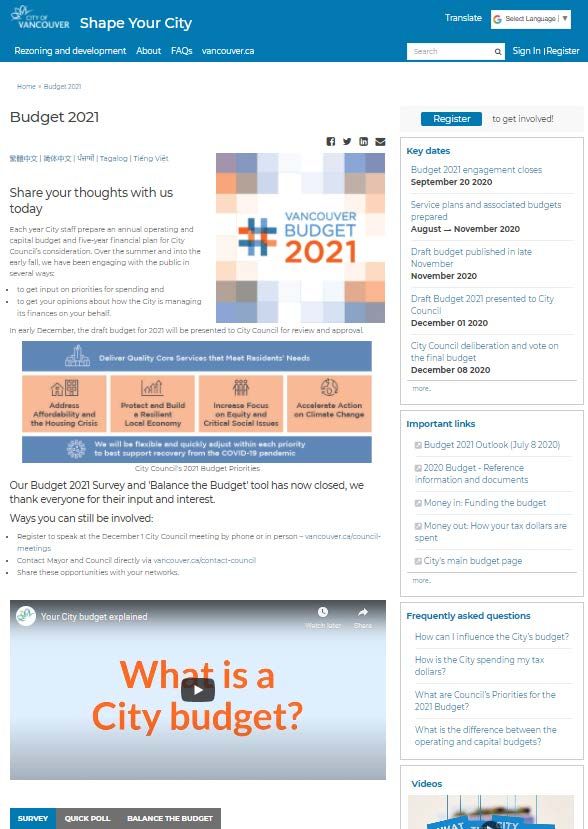
RESIDENTS 57% 48% 42% 32% 21%Early Survey Findings: Importance of Services
Residents Businesses
Sustainability (e.g. climate 71%
Fire and medical services 97% 66%
94% emergency)
Community planning (city-wide and 71%
93% neighbourhood) 73%
Water and sewer 91%
Recreation centres 71%
72%
Garbage and green bin collection 92%
87% Street maintenance, parking and 70%
lighting 72%
Emergency preparedness 91%
90% 67%
Public spaces and plazas 69%
Support for local businesses 88% Online services (e.g. payment,
91% 65%
VanConnect and 3-1-1) 67%
Parks and green spaces 87% 62%
84% Police services 65%
84%
Grants for community 58%
Transportation and roads 83% organizations 57%
By-law enforcement and 56%
Social services (e.g. childcare, 81% inspections 53%
support for homeless) 77%
Arts and culture including civic 55%
77% theatres 57%
Affordable housing programs 71%
Development (e.g. rezoning and 45%
permits) 56%
Libraries 73%
70% 18%
Golf, marinas and attractions 24%
32Early Survey Findings: Balancing the Budget
Preferred options to “balance the budget” among both residents and
businesses:
• Increase user fees for City services that currently have fees
• Postpone infrastructure projects (e.g. new amenities or major repairs)
• Introduce new user fees for some City services that currently have no fees
Least preferred options were increasing residential or business property
taxes:
• Among residential and business property owners the majority preferred a 1-
2% tax increase (68% on average for 1% tax increase, and 54% on average
for 2%)
33Budget Simulation Education Tool
• New for this year – for educational
purposes, to teach people about
components of the budget
• Participants could +/- revenue and
spending categories
• 551 budget submissions
(non-representative sample)
• Of those who submitted a response,
interest in increased funding to
address equity & critical social
issues and climate action; reduced
spending on police services
34Engagement – Next Steps
• Staff in process of analyzing and preparing full detailed engagement report
• Full engagement report will be available online at end of November as part of
Draft 2021 Budget
• shapeyourcity.ca/budget
• vancouver.ca/budget
• Presentation of full survey findings for December 1 Council Meeting
35You can also read