2021 Community Checkup Report - Washington Health Alliance
←
→
Page content transcription
If your browser does not render page correctly, please read the page content below

2021 Community Checkup Report
www.WACommunityCheckup.org
                             Community Checkup report: www.WACommunityCheckup.org   More about the Alliance: www.WAHealthAlliance.org   1
CONTENTS

Executive Director Letter                                         1

Comparing Washington State With National Benchmarks               2

Community Checkup Spotlight: Eye Exams for People with Diabetes   6

Medical Group Performance Ranking                                 8

Opioids in Washington State: Some Positive Trends                 14

Striving to Improve Health Care: Ways You Can Act and How This
Report Can Help                                                   16

Health Care Spending in Washington State                          19

Endnotes                                                          20

About Us                                                          21

A Letter to the Community from the Washington Health Alliance

March 2021
Dear Community Member:
It has been a year since the COVID-19 pandemic took hold and Washington has              While important, the Community Checkup is only one aspect of our work. The
now passed a tragic milestone: 5,000 people have died since the start. Even              Alliance is fortunate to have an engaged membership with dozens of active
though vaccines have been approved and are being distributed, the pandemic is            committee members, and a deeply committed Board of Directors all working
far from over. In addition to facing challenges with limited vaccine supply and          together to support the vision that Washington state hospitals, medical groups,
distribution channels, now we are seeing an increase in new variants. It’s clear that    and clinics achieve their stated goal of top 10% in performance nationally in the
we’re still in rough waters and the course to normalcy is not yet charted. It is amid    delivery of quality, evidence-based care. This is an aspirational goal that Alliance
these demanding circumstances that we affirm our commitment to provide                   members continue to hold. As you will see in this report, there is still much
transparency in quality, cost, and value to improve Washington state’s health care       opportunity for improvement. We’re encouraged by the performance of some
system and release the 15th Community Checkup report.                                    health care professionals in this report who not only meet but also exceed that
                                                                                         goal—and appreciate the efforts by others to join them.
Since the creation of the Washington Health Alliance (Alliance) 17 years ago, we
have held firm to our mission of building a strong alliance among patients, health       I offer deep gratitude to the members who entrust us with their data, the many
care professionals, hospitals, purchasers, health plans, and others to “promote          national and state organizations that provide us with the information to make this
health and improve the quality and affordability by reducing overuse, underuse,          report happen, and all of the individuals and organizations that support our work.
and misuse of health care services.” With these aims in mind, we issue this
                                                                                         You make everything we do possible.
comprehensive review of medical claims data, including the complete statewide
Common Measure Set first created by legislative mandate in 2014 to measure our           All the best,
progress toward achieving healthier outcomes for all residents in Washington.
These results include medical claims for 1,869 clinics, 322 medical groups, 105
hospitals, and 16 health plans for about 4 million people between January 1,
2019 and December 31, 2019.
                                                                                         Nancy A. Giunto
This release also includes several special features:                                     Executive Director
                                                                                         Washington
 • expanded details on Quality Composite Score results for clinics, medical
                                                                                         Health Alliance
   groups, counties, and Accountable Communities of Health,
 • a review of an important preventive care measure that has implications for
   patients with diabetes,
 • a look at how we are doing with opioid prescribing statewide, and
 • guidance to help health care professionals, purchasers, plans, and brokers
   use the Community Checkup to make practical changes that can positively
   affect the quality of health care across our state.

                                                                      Community Checkup report: www.WACommunityCheckup.org    More about the Alliance: www.WAHealthAlliance.org   1
Comparing Washington State With
National Benchmarks

MEASURING THE QUALITY OF HEALTH
CARE ACROSS WASHINGTON
The Community Checkup measures the quality of health care
delivered across Washington state and compares metrics related
to performance nationally using the Healthcare Effectiveness Data
and Information Set (HEDIS) reported by the National Committee
for Quality Assurance (NCQA).i
HEDIS is a comprehensive standardized performance
measurement process that is widely accepted as an industry
standard. National benchmarks are based on health care
delivered to approximately 191 million people enrolled in
commercial and Medicaid plans across the country and is used by
more than 90% of health plans to measure and report
performance to purchasers and consumers. Comparing
Washington state’s results with the national HEDIS results allows us
to track progress toward the shared goal of providing care in the
top 10% of performance nationally.
The figures summarize how well Washington state results compare
with national benchmarks as follows:
 •   at or above the national 90th percentile in dark green,
 •   between the 75th and 90th percentile in light green,
 •   between the 50th and 75th percentile in gray,
 •   between 25th and 50th percentile in yellow, and
 •   below the 25th percentile in red.ii

                                                                       Community Checkup report: www.WACommunityCheckup.org   More about the Alliance: www.WAHealthAlliance.org   2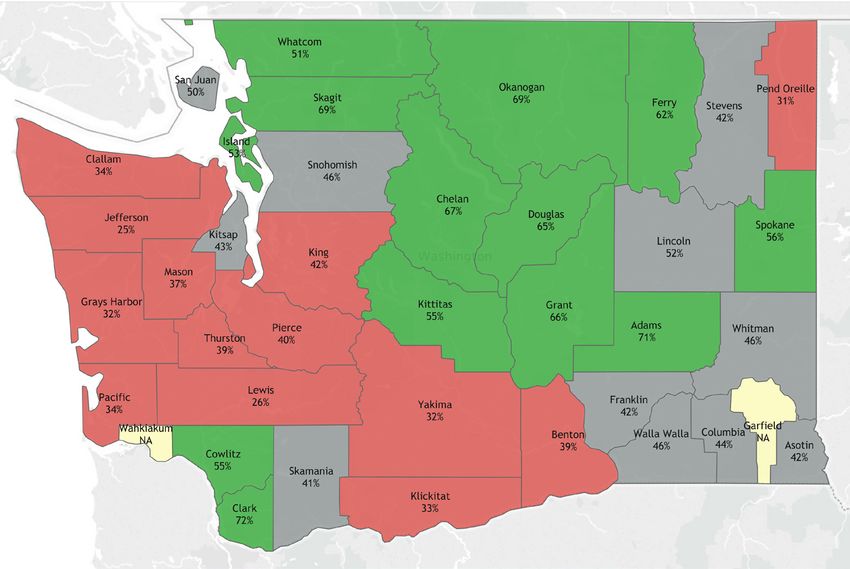
The results we are sharing in this report are fairly consistent with past reports. More than three quarters of the measures in Washington state are below the national 50th
percentile: 83% for the commercially insured and 85% for the Medicaid-insured. For both populations, Washington state performed above the national 90th percentile
on only one measure: avoiding antibiotics for adults with acute bronchitis. The commercially insured also ranked above the national 90th percentile for avoiding
antibiotics for children with an upper respiratory infection.

Figure 1: Summary of Washington State Performance Compared With NCQA HEDIS National Benchmarks

a. Commercial

                                                            b. Medicaid

                                                                      Community Checkup report: www.WACommunityCheckup.org   More about the Alliance: www.WAHealthAlliance.org   3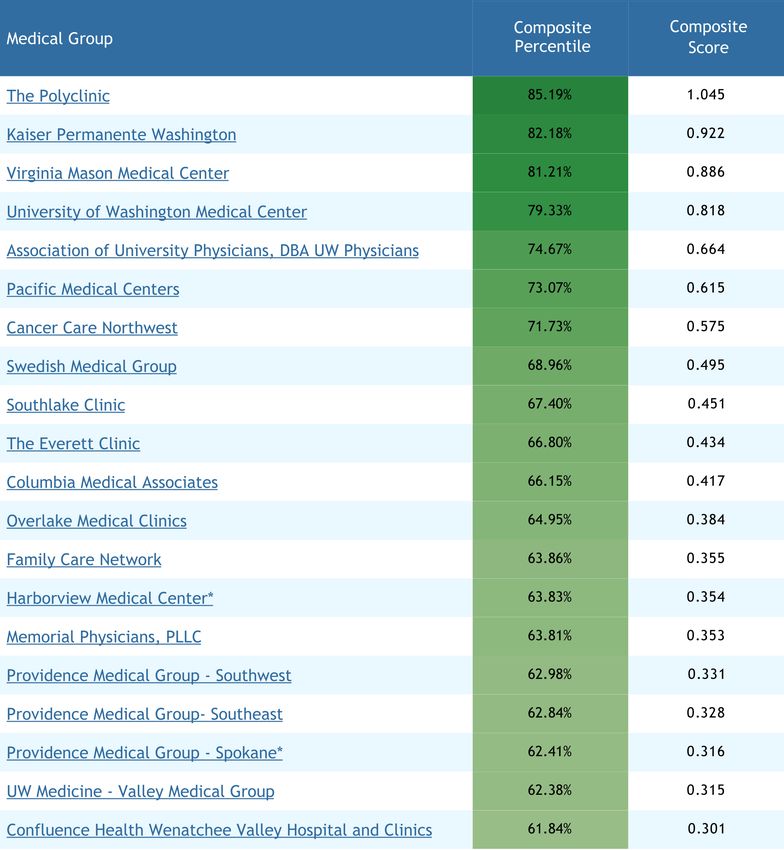
Figure 2(a): Washington State Performance Compared With NCQA HEDIS National Benchmarks (Commercial)

                                                            Community Checkup report: www.WACommunityCheckup.org   More about the Alliance: www.WAHealthAlliance.org   4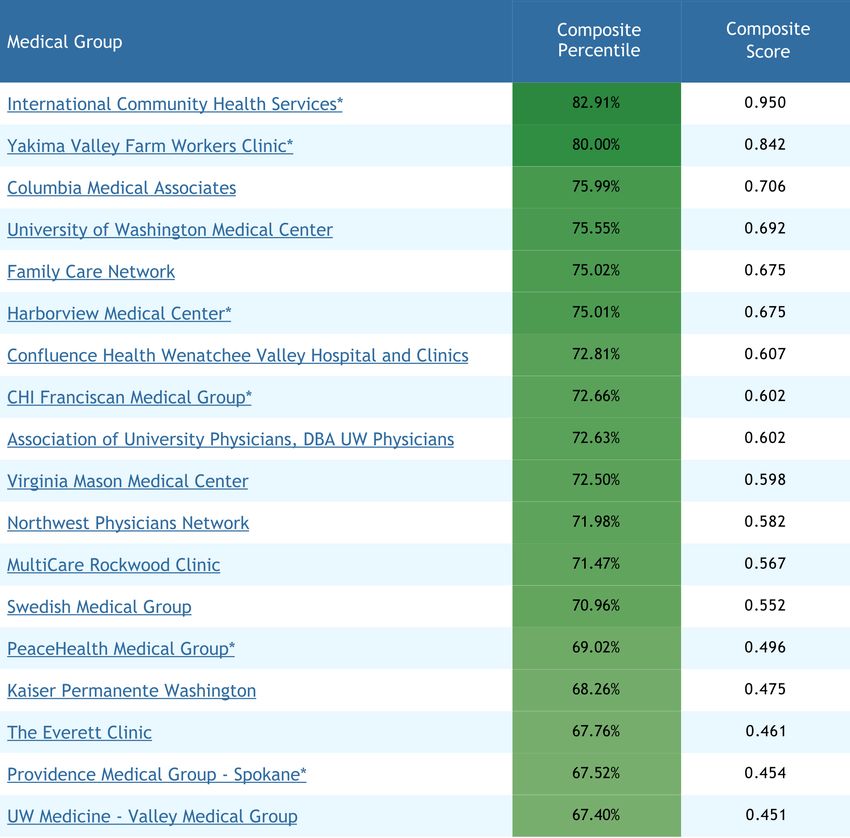
Figure 2(b): Washington State Performance Compared With NCQA HEDIS National Benchmarks (Medicaid)

                                                            Community Checkup report: www.WACommunityCheckup.org   More about the Alliance: www.WAHealthAlliance.org   5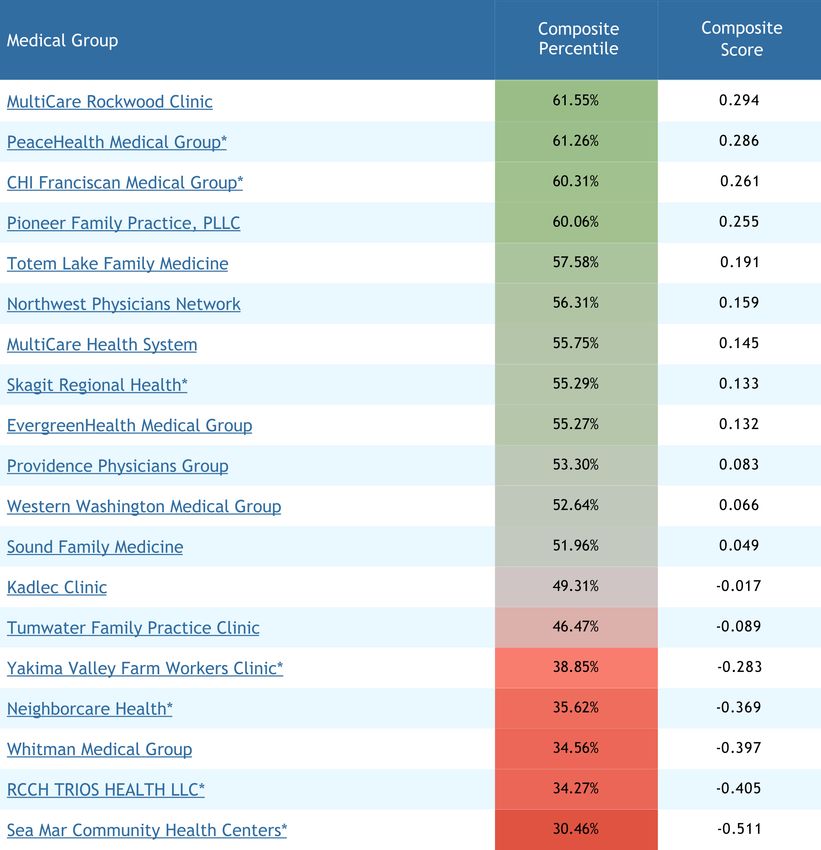
Community Checkup Spotlight:
Eye Exams for People With Diabetes

QUALITY VARIES BETWEEN COMMERCIAL
                                                                                 Figure 3: Eye Exams for People with Diabetes 90th Percentile, Commercial, and Medicaid
AND MEDICAID POPULATIONS
The Alliance brings together those who get, give, and pay for health
care to create a high quality, affordable system for all people of
Washington state. This is a shared aim across all of our stakeholders.
The Community Checkup illuminates the significant differences that can
occur in the quality of care across the state. The differences highlighted
by the Community Checkup at the medical group, clinic, or geographic
level provide an opportunity to identify high and low performers for the
purpose of informing those organizations and encouraging
improvement. Many of the Alliance member groups, such as the
Quality Improvement Committee, which is made up of senior clinical
leaders from medical groups, hospitals, and health plans, are places
where these stakeholders come together to critically assess results and
share ideas about how to improve care for all.
One example of this is the measure that tracks the degree to which
diabetic patients are receiving recommended eye exams.iii Individuals
with Type 1 or Type 2 diabetes are more prone to disorders of the eye
that can become quite serious, and even lead to blindness, if not
identified and treated early.iv The Community Checkup results help us to
understand that there continues to be a significant improvement
opportunity for all, but the degree of improvement needed between the
commercial and Medicaid populations reveals somewhat surprising
differences between these two populations.
The national benchmark for eye exams for people with diabetes is higher
for the Medicaid-insured population (70%) than for the commercially
insured population (68%). However, in Washington state, the rate for
Medicaid is only 46%, significantly lower than the commercially insured          The degree of variation and the opportunities for improvement are also evident when
rate of 64%, and well below national benchmarks. This translates into            comparing results across providers. The Community Checkup’s Highlight on Variation in
thousands of people each year who are not getting this important                 Health Care Quality shows that there is wide variation in the number of people with diabetes
diagnostic service that can help prevent blindness.                              who get this important service when comparing across medical groups and clinics.v

                                                                       Community Checkup report: www.WACommunityCheckup.org   More about the Alliance: www.WAHealthAlliance.org   6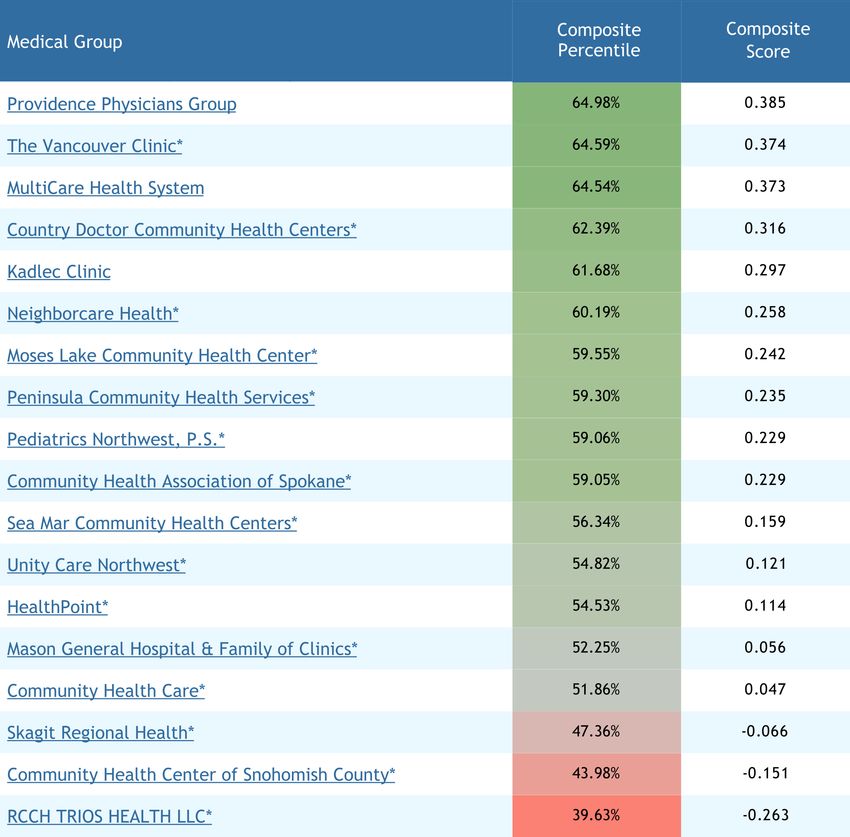
While many health care professionals are well        The wide variation continues across Washington state’s counties for the rate of people with Medicaid who have
below the state average, the table shows some not    diabetes and get an eye exam. We see averages ranging from as low as 25% to as high as 72%, 2 points
only exceed the national 90th percentile             higher than the goal of the national 90th percentile. This is clearly an opportunity for stakeholders to come
benchmark of 70%, they reach as high as 99%.         together to share best practices and improve care for all across the state.
This degree of variation reported in the Community
Checkup marks the starting point for the kind of
                                                     Figure 5: County Results for Eye Exams for People With Diabetes (Medicaid)
collective improvement opportunity the Alliance
and its members are focused on.                                                                                                                              Legend
                                                                                                                                                              •   Average
Figure 4: Highest Rated Performers, Eye Exams for
                                                                                                                                                              •   Better
People with Diabetes (Medicaid)
                                                                                                                                                              •   Unrated
a. Medical Groups                                                                                                                                             •   Worse

 Organization                               Rate
 Pacific Medical Centers                    97%
 Columbia Medical Associates                89%
 The Vancouver Clinic*                      89%
 Confluence Health–Central                  85%
 Washington Hospital & Clinics
 Ear, Nose and Throat Clinic of the         85%
 Northwest*

b. Clinics

 Organization                               Rate
 Pacific Medical Center–Canyon Park         99%
 Pacific Medical Center–First Hill          99%             To see variation on a wide range of measures by clinic, medical group, and county, go to
                                                            www.WACommunityCheckup.org/Highlights and click on Variation in Health Care Quality.
 Pacific Medical Center–Northgate           99%
 Pacific Medical Center–Renton              98%
 Pacific Medical Center–Beacon Hill         97%

An * indicates that more than 50% of patients have
Medicaid coverage.
Identical results are reported alphabetically.

                                                               Community Checkup report: www.WACommunityCheckup.org   More about the Alliance: www.WAHealthAlliance.org     7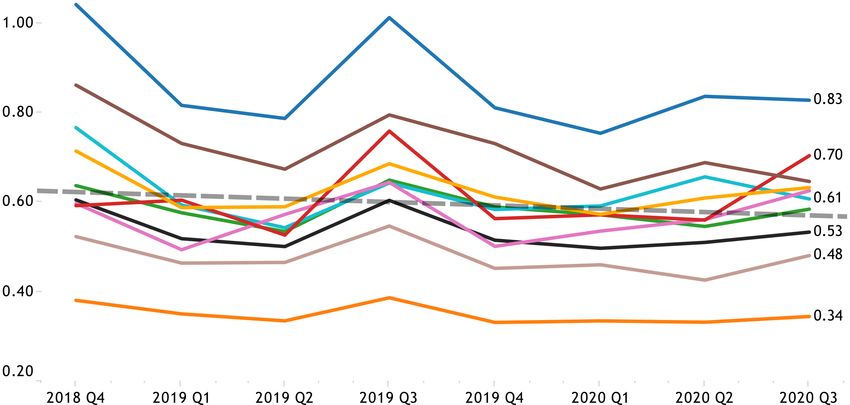
Medical Group Performance Ranking

MEASURING RELATIVE PERFORMANCE                                                           The composite measure is comprised of four different domains:

The Quality Composite Score uses the results for a subset of Community                   • Prevention and Screening looks at the degree to which individuals are
Checkup measures (up to 29 in total) considered to be indicators of strong                 receiving recommended services on a timely basis, such as well-child visits;
primary care delivery. All of the underlying measures are also reported                    adolescent well-care visits; screenings for chlamydia; and screenings for breast,
independently in the Community Checkup. The principal objective of the                     cervical, and colorectal cancers.
composite score is to compare relative performance in primary care services              • Care for Chronic Diseases considers whether conditions such as diabetes,
across the state using a standardized measure. The Quality Composite Score is              high cholesterol, depression, and hypertension are well-managed.
available for comparison across clinics, medical groups, counties, and                   • Coordinated, Cost-Effective Care evaluates whether care avoids costly
Accountable Communities of Health (ACHs).                                                  inpatient readmissions and potentially unnecessary emergency department visits.
                                                                                         • Appropriate, Cost-Effective Care examines a variety of measures
        Additional information on the Quality Composite Score, including its               associated with using evidence-based treatment options such as prescribing
        background and comprehensive results on each measure, is                           generic medications; avoiding the inappropriate use of antibiotics; and avoiding
        available at www.WACommunityCheckup.org/Highlights/.                               unnecessary X-rays, MRIs, and CT scans for specific types of low-back pain.
                                                                                         In this Community Checkup, the results for medical groups across the state are reported.

    Congratulations to these medical groups for their Quality
    Composite Score ranking!
    Commercial                                              Medicaid
    •   The Polyclinic                                      •   International Community Health Services
    •   Kaiser Permanente Washington                        •   Yakima Valley Farm Workers Clinic
    •   Virginia Mason Medical Center                       •   Columbia Medical Associates
    •   University of Washington Medical Center             •   University of Washington Medical Center
    •   Association of University Physicians, DBA           •   Family Care Network
        UW Physicians

                                                                      Community Checkup report: www.WACommunityCheckup.org     More about the Alliance: www.WAHealthAlliance.org    8
Figure 6: Quality Composite Score Composition
Prevention and Screening Coordinated, Cost-Effective Care
Breast cancer screening Potentially avoidable ER visits
Cervical cancer screening Hospital readmissions within 30 days
Colon cancer screening
Chlamydia screening Appropriate, Cost-Effective Care
Adolescent well-care visits Avoiding antibiotics for adults with acute bronchitis
Well-child visits (in the first 15 months) Appropriate testing for children with sore throat
Well-child visits (ages 3-6 years) ADHD medication generic prescriptions
Stomach acid medication generic prescriptions
Chronic Disease Care Antidepressant medication generic prescriptions
Follow up for children prescribed ADHD medication (30 days) Avoiding X-rays, MRIs and CT scans for low-back pain
Follow up for children prescribed ADHD medication (9 months) Avoiding antibiotics for children with upper respiratory infection
Staying on antidepressant medication (12 weeks)
Staying on antidepressant medication (6 months)
Asthma medication ratio
Eye exam for people with diabetes
Blood sugar (HbA1c) testing for people with diabetes
Kidney disease screening for people with diabetes
Taking diabetes medication as directed
Monitoring patients on high blood pressure medication
Taking hypertension medications as directed
Taking cholesterol-lowering medications as directed
Statin therapy for patients with cardiovascular disease
Community Checkup report: www.WACommunityCheckup.org More about the Alliance: www.WAHealthAlliance.org 9Figure 7(a): Performance Ranking for Medical Groups (Commercial)
READING THE TABLE
The composite score is a weighted
average of the results from the four domains.
A composite score of 0 indicates that the
medical group’s performance is the same as
the state average. A positive score indicates
overall performance above the state
average, while a negative score indicates
overall performance below the state
average. Note that within the composite
score, there are likely to be both high and
low performance measures.
The composite percentile ranges
between 0 and 100% and represents the
distribution of the composite scores and
reports on each medical group’s
performance relative to all others. For
example, a medical group at the 85th
percentile means we estimate its
performance would exceed 85% of all
other medical groups.
The rank order is based on the composite
percentile with performance color coded
green for better, gray for average, and red
for worse.
Due to population differences, rankings are
reported separately for the commercially
and Medicaid-insured.
An * indicates that more than 50% of
patients from that medical group have
Medicaid coverage.
Community Checkup report: www.WACommunityCheckup.org More about the Alliance: www.WAHealthAlliance.org 10Figure 7(a): Performance Ranking for Medical Groups (Commercial)
Community Checkup report: www.WACommunityCheckup.org More about the Alliance: www.WAHealthAlliance.org 11Figure 7(b): Performance Ranking for Medical Groups (Medicaid)
Community Checkup report: www.WACommunityCheckup.org More about the Alliance: www.WAHealthAlliance.org 12Figure 7(b): Performance Ranking for Medical Groups (Medicaid)
Community Checkup report: www.WACommunityCheckup.org More about the Alliance: www.WAHealthAlliance.org 13Opioids in Washington State:
Some Positive Trends
REDUCING THE RATE OF OPIOID PRESCRIBING
Long considered a public health crisis, opioid misuse and abuse has devastated lives, affected
communities, and overwhelmed law enforcement, health care, and social service providers.
Opioids such as morphine, hydrocodone, oxycodone, and fentanyl cause more unintentional
deaths due to overdose in Washington state than motor vehicle accidents or firearm fatalities.vi
Despite efforts to reduce the number of opioid-related deaths, current data show that opioid
addiction still causes the deaths of two people each day in Washington state on average.vii
As a state, we have led the nation with the first comprehensive statewide effort to address the
opioid crisis. To reduce the rate of opioid prescribing, the Washington State Agency Medical
Directors’ Group, in partnership with academics, practicing surgeons, pain experts, and other
organizations, provides guidance, opioid dose and taper calculators, educational videos, free
continuing medical education credits, and other resources for health care professionals to reduce
the rate of opioid prescribing.viii The Prescription Monitoring Program (PMP) requires prescribers
to register and report on their opioid prescribing practices.ix
The Washington State Opioid Response Plan brings together state agencies, local health
departments, professional groups, and community organizations to work collaboratively on four
priorities:
• preventing opioid misuse and abuse;
• identifying and treating opioid use and disorder;
• reducing morbidity and mortality from opioid use disorder; and
• using data and information to detect opioid misuse/abuse, monitor morbidity and mortality,
and evaluate interventions.x
As part of the last goal, the Washington State Department of Health issues regular reports on
opioid use.xi In this Community Checkup, we use three metrics using data from the PMP for
counties and Accountable Communities of Health (ACHs) regarding:
• the number of new patients with their first opioid prescription by the number of days (3,
4–7, 8–13, ≥14);
• patients prescribed high doses (>50 MME/day and >90 MME/day); and
• patients transitioning to chronic opioid use, defined as >60-day supply.xii
Community Checkup report: www.WACommunityCheckup.org More about the Alliance: www.WAHealthAlliance.org 14As the graph illustrates, from Q4 2018 to Q3 2020, the average statewide rate for patients transitioning to chronic
opioids (more than a 60-day supply) went from 0.61 to 0.53 per 1,000. Performance among ACHs was similar
with most showing a reduction. The exceptions were North Central ACH, which increased from 0.59 to 0.70 per What the Alliance is Doing to
1,000, and Olympic Community of Health, which increased from 0.60 to 0.63 per 1,000. The ACH with the Address Opioids
greatest reduction during this timeframe was Better Health Together, which decreased from 1.04 to 0.83 per 1,000.
Approximately 4 million people in
Washington state receive health care from the
Figure 8. Opioid Use in Washington State, Accountable Communities of Health, New Opioid Patients organizations represented on the Alliance’s
Transitioning to Chronic Opioids (>60 days) Board of Directors. Working cooperatively,
Board members are focusing attention on
reducing inappropriate opioid prescribing in
two situations when many people are first
introduced to opioids: acute low-back and
dental pain. This builds on the significant
efforts invested in addressing opioid misuse
and abuse by many across the state,
including the Dr. Robert Bree Collaborative.xiii
By coordinating their efforts with other
national and Washington state
organizations, the Board organizations are
working hard to ensure a noticeable
improvement across their populations.
To see more results, go to www.
Legend WACommunityCheckup.org/Highlights
and click on Opioid Prescribing Practices.
• Better Health Together • North Sound ACH
• Cascade Pacific Action Alliance • Olympic Community of Health
• Elevate Health • SW WA Regional Health
• Greater Columbia ACH Alliance
• HealthierHere • State Average
• North Central ACH • State Trend Line
Community Checkup report: www.WACommunityCheckup.org More about the Alliance: www.WAHealthAlliance.org 15Striving to Improve Health Care: Ways You
Can Act and How This Report Can Help
PUTTING COMMUNITY CHECKUP RESULTS INTO ACTION
The Community Checkup provides extensive information on health care quality and can be used The Alliance’s analysis enables the Association
by plans, health care professionals, and purchasers including employers and union trusts, and of Washington Cities Employee Benefit Trust to
their advisors, to improve the delivery of health care in Washington state. Here are some ideas
have a clearer understanding of the care that
for how it can be used.
our members and their families are getting and
IF YOU ARE A HEALTH INSURANCE PLAN... helps inform our decisions on how we can
improve it. Using Community Checkup results,
• Use the Quality Composite Scores to understand relative differences in quality
across the state at the following levels: clinics, medical groups, counties, and we focused on preventive care and are seeing
ACHs.xiv This can be an important tool that can inform your decisions regarding an increase in the number of people getting
network composition and areas of potential focus for collaborative improvement information about their benefits and accessing
efforts.
these important services. We also expanded
• See how well your plan rates when it comes to important measures such as primary
care and access to care and consider expanding member networks or supporting our behavioral health benefits and now our
alternative access to care, such as telehealth options, to ensure more members are members have more access than ever before.
getting the health care they need when they need it.xv
– Beverly Lakey, CEBS, Employee Benefit Trust
• Examine how well adults and children who are diagnosed with a mental health Manager, Association of Washington Cities
need are getting mental health servicesxvi and expand access or benefit options to
improve health outcomes and increase the quality of life for themselves, their
families, and their communities.
• See how well your plan provides follow-up care within 7 days after visits to the
emergency department for alcohol or other substance abuse and compare that rate
to 30 days.xvii Consider how you can work with those providers to help those
members achieve better long-term health.
Community Checkup report: www.WACommunityCheckup.org More about the Alliance: www.WAHealthAlliance.org 16IF YOU ARE A HEALTH CARE PROFESSIONAL...
• Review the Quality Composite Score domain results to see how your care compares The Alliance’s information is great in terms of
in each domain (prevention and screening; chronic disease care; coordinated, informing us on how we’re doing with respect to
cost-effective care; and appropriate, cost-effective care)xviii and implement best
preventive and chronic care measures, such as
practices across your group to target the areas that need the most improvement.
Participate in collaborative improvement efforts through the Alliance and groups which medical groups, provider groups, and
such as WA State Medical or Nurses Associations, WA Academy of Family health plans are better at coordinating the care
Physicians, among others. received by our employees and their families.
• Consider not only how you are addressing high-value care but also how you are
The Alliance’s reports give us confidence in our
addressing low-value care, such as avoiding unnecessary X-rays, MRIs, and CT
scans for low-back pain,xix that can often lead to other treatments that are purchasing and communications strategies,
considered unnecessary or wasteful and could result in emotional, physical, and which emphasize the importance of having a
financial harm to your patients. primary care provider in a coordinated system
of care. We’ve done extensive communications
IF YOU ARE A HEALTH CARE PURCHASER...
with our employees using the Alliance’s Own
If you are a health care employer, union trust, or you advise purchasers about health
care services, you wield tremendous market power. There are a variety of ways the
Your Health website and other campaigns to
Community Checkup can support your efforts to make the highest value purchasing spread that message. We’ve seen a significant
decisions on behalf of your organization. increase in the number of our members who
• Consider contracting with plans that have better performance and ensure your have a primary care provider over the past few
networks include high performing hospitals, medical groups, and clinics.xx years and that results in more people accessing
• Offer assistance to help your members navigate all of the different Community those important services.
Checkup resources to locate high quality providers in their communities by using the
Find Quality Care tool (located in the middle of the home page—click on the Get – Michele Ritala, Benefits Strategic Planner, King County
Started button).xxi
• Evaluate the scores for following medication regimens (e.g., diabetes, cholesterol-
lowering, and hypertension medications),xxii work with pharmacy benefit managers
to remove financial obstacles to those medications, and explore apps or other
resources to improve compliance.
• Understand your population’s health care needs. For people with diabetes, for
example, investigate the scores for your health plans for kidney disease screening,
blood sugar (HbA1c) testing, and eye exams.xxiii
Community Checkup report: www.WACommunityCheckup.org More about the Alliance: www.WAHealthAlliance.org 17HOW SYSTEM ALIGNMENT CAN HELP
Well-intended efforts to measure and report on care quality can have unintended consequences by introducing administrative complexity that can detract from a focus
on care delivery improvements. But it doesn’t have to be that way.
PLANS CAN HELP BY: BENEFITS TO HEALTH CARE PROFESSIONALS:
Working with other health plans to select a limited Focus their efforts on care delivery improvements
number of meaningful measures for improvement. and not on administering quality reporting.
Working with other health plans to agree on a common Reduce the administrative burden of
mechanism (common data specifications, information measurement and focus resources on care
exchange systems, etc.,) for measuring quality. delivery improvements.
Ensure network providers are sharing information on
Fully informed care delivery at the point of
behalf of your members in a patient-centric manner across
care for all patients.
your network, regardless of organizational boundaries.
Community Checkup report: www.WACommunityCheckup.org More about the Alliance: www.WAHealthAlliance.org 18Health Care Spending in
Washington State
WHY IS IT IMPORTANT TO MEASURE HEALTH CARE In the meantime, the state, as the largest purchaser of health care, is doing its part to
encourage transparency by reporting what it is spending to purchase health care
SPENDING? and by continuing to look for opportunities to slow the rate of spending growth.
The cost of a good or service is one of the primary pieces of information
consumers use to assess value and inform their purchasing decisions. However, Annual per-capita state-purchased health care spending growth
when it comes to the cost of health care, accurate information about the cost of a relative to state GDP
treatment or procedure is often not available in advance. Not only do consumers
The table below reports on the Washington state-purchased health care annual
often have difficulty gathering accurate price information, but costs can vary
spending (Medicaid and Public Employee Benefits (PEBB)) as a percentage of
significantly between facilities. This lack of price transparency makes it impossible
Washington state gross domestic product (GDP) for a six-year period (2014-
for consumers to make informed decisions about how to spend their health care
2019).xxiv For each year, the denominator is that year’s GDP and the numerator is
dollars in order to get the best value.
the amount spent by the state on health care that year (i.e., 2014 Washington
In the state of Washington, as in much of the rest of the nation, we are only at the state-purchased health care annual spending as a percentage of 2014 state
dawn of price transparency. Over time, with more collaborations among GDP). Percentages reflect year-over-year changes.
stakeholders, we expect to see greater transparency of health care costs in our state.
Figure 9: Health Care Spending Relative to the Washington State Gross Domestic Product, 2014-2019 (Current Dollars)
WA State-Purchased Health WA State Health Care Average State Purchased Health
Care Annual Spending Monthly Eligible Members WA State GDP Care Spending as a
(Medicaid and PEBB) (Medicaid and PEBB) Percentage of State GDP
2014 $9,315,362,455 1,801,946 $442,201,300,000 2.11%
2015 $10,169,822,206 9% Change 2,002,550 11% Change $470,329,300,000 6% Change 2.16% 3% Change
2016 $11,203,779,829 10% Change 2,068,114 3% Change $491,358,200,000 4% Change 2.28% 5% Change
2017 $12,012,782,916 7% Change 2,077,690 0% Change $524,814,600,000 7% Change 2.29% 0% Change
2018 $12,466,265,652 4% Change 2,043,530 -2% Change $565,831,000,000 8% Change 2.20% -4% Change
2019 $12,884,935,557 3% Change 2,010153 -2% Change $599,607,700,000 6% Change 2.15% -2% Change
To see additional information on Medicaid and public employee spending as well as graphs of spending over time,
go to www.WACommunityCheckup.org/Highlights/ and select Health Care Spending in Washington State.
Community Checkup report: www.WACommunityCheckup.org More about the Alliance: www.WAHealthAlliance.org 19Endnotes
i
National Committee for Quality Assurance, HEDIS and Performance Measurement, https://www. xiv
Washington Health Alliance, Community Checkup, 2021 Highlight: Quality Composite Scores,
ncqa.org/hedis/. https://www.wacommunitycheckup.org/highlights/.
Washington Health Alliance, Community Checkup, 2021 Technical Specifications, https://www.
ii
Washington Health Alliance, Community Checkup, Scores, Health Plans, https://www.
xv
wacommunitycheckup.org/about/methodology/. wacommunitycheckup.org/compare-scores/.
This measure reports on the number of patients ages 18-75 who were diagnosed with Type 1 or Type 2
iii
Washington Health Alliance, Community Checkup, Scores, Individual Measures, Mental Health
xvi
diabetes and had at least one eye exam during a 2-year period or had evidence of eye disease during Services for Adults and Mental Health Services for Children, https://www.wacommunitycheckup.org/
the year measured from January 1, 2019, to December 31, 2019. Additional information on this and compare-scores/.
other measures is available in the Community Checkup 2021 Technical Specifications, https://www. Washington Health Alliance, Community Checkup, Scores, Individual Measures, Follow-up After
xvii
wacommunitycheckup.org/about/methodology/. Emergency Department Visit for Alcohol and Other Drug Abuse or Dependence (7 Days) and (30
American Diabetes Association, Eye Complications, https://diabetes.org/diabetes/complications/
iv
Days), https://www.wacommunitycheckup.org/compare-scores/.
eye-complications. Washington Health Alliance, Community Checkup, 2021 Highlight: Quality Composite Scores,
xviii
v
Washington Health Alliance, Community Checkup, 2021 Highlight: Variation in Health Care Quality, https://www.wacommunitycheckup.org/highlights/.
https://www.wacommunitycheckup.org/highlights/. Washington Health Alliance, Community Checkup, Scores, Individual Measures, Avoiding X-ray,
xix
vi
Washington Governor Jay Inslee, Inslee Launches Executive Order to Combat Opioid Crisis, October MRI and CT Scan for Low-Back Pain, https://www.wacommunitycheckup.org/compare-scores/.
7, 2016, https://www.governor.wa.gov/news-media/inslee-launches-executive-order-combat- Washington Health Alliance, Community Checkup, Scores, Health Plans, https://www.
xx
opioid-crisis. wacommunitycheckup.org/compare-scores/.
Washington State Department of Health, Opioids, https://www.doh.wa.gov/
vii
xxi
Washington Health Alliance, Community Checkup, https://www.wacommunitycheckup.org/.
CommunityandEnvironment/Opioids.
Washington Health Alliance, Community Checkup, Scores, Measures by Category, Managing
xxii
Washington State Agency Medical Directors’ Group, http://www.agencymeddirectors.wa.gov/
viii
Medications, https://www.wacommunitycheckup.org/compare-scores/.
default.asp.
Washington Health Alliance, Community Checkup, Scores, Measures by Category, Diabetes,
xxiii
ix
Washington State Department of Health, Prescription Monitoring Program, https://www.doh.wa. https://www.wacommunitycheckup.org/compare-scores/.
gov/ForPublicHealthandHealthcareProviders/HealthcareProfessionsandFacilities/
PrescriptionMonitoringProgramPMP. This information is provided by the Washington State Health Care Authority. Washington state gross
xxiv
domestic product data are from the U.S. Bureau of Economic Analysis. Medicaid expenditures and
x
Washington State Department of Health, Opioid Misuse and Overdose Prevention, https://www. eligible member data are from February 2020 Health Care Authority Per Capita Expenditure Forecast,
doh.wa.gov/YouandYourFamily/PoisoningandDrugOverdose/OpioidMisuseandOverdosePrevention. CMS 64, and Agency Financial Reporting System Data. Medicaid Expenditures include medical,
Washington State Department of Health, Opioid Awareness Dashboards, https://www.doh.wa.
xi
dental, vision, pharmacy, long-term support services, mental health, and substance use disorder
gov/DataandStatisticalReports/HealthDataVisualization/OpioidDashboards. expenditures; and excludes Medicare Part D Co-Pay/Clawback and Medicare Part A/B Premiums.
PEBB data for calendar years 2014-2015 is from Milliman PFPM 3.0 (5/11/2016); data for calendar
Washington State Department of Health, Opioid Awareness Dashboards, https://www.doh.
xii
year 2016 is from Milliman PFPM 6.0, (02/14/2017), Exhibit 4a; data for calendar year 2017 is from
wa.gov/DataandStatisticalReports/HealthDataVisualization/OpioidDashboards.
Milliman PFPM 2.0 (02/09/2018), Exhibit 4a; data for calendar year 2018 is from Milliman PFPM
Dr. Robert Bree Collaborative, Opioid Prescribing Metrics, July 2017, https://www.qualityhealth.
xiii
7.0 (05/29/2019), Exhibit 4a; data for calendar year 2019 is from Milliman PFPM 3.0
org/bree/wp-content/uploads/sites/8/2018/06/Bree-Opioid-Prescribing-Metrics-Final-2017.pdf. (06/01/2020), Exhibit 4a. Non-Medicare PEBB expenditures include medical, dental and vision;
excludes life insurance and long-term disability.
Community Checkup report: www.WACommunityCheckup.org More about the Alliance: www.WAHealthAlliance.org 20ABOUT THE COMMUNITY CHECKUP ABOUT THE WASHINGTON HEALTH ALLIANCE
The Community Checkup report and all results produced and prepared by the The Washington Health Alliance (Alliance) is a 501(c)(3) nonprofit nonpartisan
Washington Health Alliance (Alliance) are considered proprietary and the organization working collaboratively to transform Washington state’s health
intellectual property (IP) of the Alliance. All rights are reserved. No part of the care system for the better. The Alliance brings together more than 185
Alliance’s results may be reproduced for public or private reporting, distributed, committed member organizations to improve health and health care by offering
or transmitted in any form or by any means without the prior written permission a forum for critical conversation and aligned efforts by health plans, employers,
of the Alliance. union trusts, hospitals and hospital systems, health care professionals, start-up
companies, consultants, consumers, and other health care partners. The Alliance
Many of the results in the Community Checkup report were prepared by the
believes strongly in transparency and offers trusted and credible reporting of
Alliance based on our analysis of a significant amount of data, reflecting health
progress on health care quality, value, pricing, and overall spending. The
care provided to approximately 4 million residents in Washington state. These
Alliance publishes its reports at www.WACommunityCheckup.org and
results were calculated using measures that have been developed and finalized
provides guidance for consumers at www.OwnYourHealthWA.org so that
based on the judgment of many health care stakeholders and technical experts.
individuals can make informed health care decisions.
Others may reach different conclusions than the results presented in this report
and on the Community Checkup website.
Results in this Community Checkup report also include those provided by other HOW TO CONTACT US
organizations including the Washington State Hospital Association, the Nancy Giunto
Washington State Department of Health, the Washington State Department of Executive Director
Social and Health Services, the Washington State Health Care Authority, and the Email: ngiunto@wahealthalliance.org
National Committee for Quality Assurance. These results were calculated by Phone: 206.454.2951
groups other than the Alliance, also based on the judgment of technical experts,
and therefore the same cautions apply. Medical science changes constantly and Karen Johnson
health care quality performance measurement is continually evolving. Therefore, Director of Performance Improvement and Innovation
the Alliance does not warrant that the information in the Community Checkup Email: kjohnson@wahealthalliance.org
report or in any other results produced and prepared by the Alliance is complete, Phone: 206.454.2956
accurate, and current—or that it will be suitable for your specific needs. Mark Pregler
In addition, the Alliance does not provide medical advice and our results are Director of Data Management and Analytics
not a substitute for medical advice, diagnosis, or treatment. Never dismiss or Email: mpregler@wahealthalliance.org
delay seeking medical advice or treatment because of information in the Phone: 206.454.2952
Community Checkup or any of the other Alliance reports. Theresa Lampkin Tamura
Director of Membership and Business Engagement
Email: ttamura@wahealthalliance.org
Find out how you can support health system change by visiting
Phone: 206.454.2957
www.WAHealthAlliance.org/join-us/ and becoming a
member of the Alliance.
Community Checkup report: www.WACommunityCheckup.org More about the Alliance: www.WAHealthAlliance.org 21The Community Checkup is produced by the Washington Health Alliance.
Community Checkup report: For consumer guidance visit: More about the Alliance:
www.WACommunityCheckup.org www.OwnYourHealthWA.org www.WAHealthAlliance.org
Community Checkup report: www.WACommunityCheckup.org More about the Alliance: www.WAHealthAlliance.org 22You can also read