2022 Community Health Needs Assessment - Kirby Medical Center
←
→
Page content transcription
If your browser does not render page correctly, please read the page content below
2022 Community Health Needs Assessment
TABLE OF CONTENTS

            INTRODUCTION............................................................................................................................................5
            Executive Summary................................................................................................................................................5-9
            Background.................................................................................................................................................................9-13
            Kirby Medical Center Services....................................................................................................................14-16
            Local Impact of COVID.......................................................................................................................................16-17

            ESTABLISHING THE CHNA INFRASTRUCTURE AND PARTNERSHIPS.........................19

            DATA COLLECTION............................................................................................................................19-24
            Secondary Data.....................................................................................................................................................19-21
            Primary Data............................................................................................................................................................21-24

            DATA ANALYSIS...................................................................................................................................27-57
            Demographics.......................................................................................................................................................27-30
            Social Determinants of Health...................................................................................................................31-41
            Health and Wellness Indicators...............................................................................................................42-55
            - Chronic Illness....................................................................................................................................................43-47
            - Mental Health.....................................................................................................................................................48-50
            - Behavioral Health............................................................................................................................................51-53
            - Substance Use..................................................................................................................................................54-55
            Diversity and Minority Health Status...........................................................................................................56
            Emergency Preparedness...................................................................................................................................57

            Copyright ©2022 by the Illinois Critical Access Network (ICAHN). All rights reserved. The contents of this publication may not be
            copied, reproduced, replaced, distributed, published, displayed, modified, or transferred in any form or by any means except with
            the prior permission of ICAHN. Copyright infringement is a violation of federal law subject to criminal and civil penalties.

2 I Community Health Needs Assessment
IDENTIFICATION AND PRIORITIZATION OF NEEDS.........................................................59-60
Process................................................................................................................................................................................59
Description of the Community Health Needs Identified...............................................................60

RESOURCES AVAILABLE TO MEET PRIORITY HEALTH NEEDS.................................63-64
Hospital Resources....................................................................................................................................................63
Healthcare Partners or other Resources including Telemedicine.........................................64
Community Resources...........................................................................................................................................64

DOCUMENTING AND COMMUNICATING RESULTS................................................................67

IMPLEMENTATION STRATEGY.....................................................................................................69-73
Planning Process.........................................................................................................................................................69
Implementation Strategy..............................................................................................................................70-73

REFERENCES AND APPENDIX....................................................................................................75-77

                                                                                                                                                                     Kirby Medical Center I 3
Early Childhood         Adolescents               Adults                 Seniors

INTRODUCTION

In 1850, John Kirby left his home in Limerick County, Ireland, and headed for
America. When he eventually settled in Monticello, Illinois, he could not have
imagined that someday he would be revered as a great community leader.
Today, more than 90 years after his passing, his legacy as a community
philanthropist remains.

The original John and Mary E. Kirby Hospital was located in one of the majestic
mansions of Monticello and opened for business in 1941. In the early 1970s, a new
Kirby Hospital was built on that same location and would serve the community
and Pike County for the next 30 years. Kirby Ambulance Service began in 1974.

In 2011, the new Kirby Medical Center began providing care at its current location.
In 2015, Kirby Medical Center began a Wellness Trail on its campus. In 2016. KMC
Active opened on the campus. In 2019, KirbyRx Retail Pharmacy opened. The
pharmacy expanded to a second location in Monticello in 2020. A new Kirby
Medical Center clinic opened in Cerro Gordo in 2016, and a replacement clinic
was built and opened in Atwood in 2021.

                                                                           Kirby Medical Center I 5
EXECUTIVE SUMMARY

            Provisions in the Affordable Care Act (ACA) require charitable hospitals to conduct
            a Community Health Needs Assessment (CHNA). The CHNA is a systematic
            process involving the community to identify and analyze community health needs
            as well as community assets and resources in order to plan and act upon priority
            community health needs.

            This assessment process results in a CHNA report which assists the hospital
            in planning, implementing, and evaluating hospital strategies and community
            benefit activities. This Community Health Needs Assessment was developed
            and conducted, in partnership with representatives from the community, by a
            consultant provided through the Illinois Critical Access Hospital Network (ICAHN).

            ICAHN is a not-for-profit 501(c)(3) corporation established in 2003 for the purposes
            of sharing resources, education, promoting operational efficiencies, and improving
            healthcare services for member critical access and rural hospitals and their
            communities.

6 I Community Health Needs Assessment
ICAHN, with 57 member hospitals, is an independent network governed by
a nine-member board of directors, with standing and project development
committees facilitating the overall activities of the network. ICAHN continually
strives to strengthen the capacity and viability of its members and rural health
providers.

This Community Health Needs Assessment will serve as a guide for planning
and implementation of healthcare initiatives that will allow the hospital and
its partners to best serve the emerging health needs of Monticello and the
surrounding area. The CHNA process was coordinated by the Chief Compliance
Officer service at Kirby Medical Center.

Two focus groups met to discuss the state of overall health and wellness in the
Kirby Medical Center service area and to identify health concerns and needs in
the delivery of healthcare and health services in order to improve wellness and
reduce chronic illness for all residents. The focus groups included representation
of healthcare providers, community leaders, community services providers,
schools, faith-based organizations, local elected officials, public health and others.
Several members of these groups provided services to underserved and unserved
persons as all or part of their roles.

The findings of the focus groups were presented along with secondary data
analyzed by the consultant to a third group for identification and prioritization
of the significant health needs facing the community. The group consisted of
representatives of mental health, community leaders, healthcare providers,
and community services providers.

                                                                              Kirby Medical Center I 7
IDENTIFICATION AND PRIORITIZATION                 ADDRESSING THE NEED

            At the conclusion of their review and discussion, the identification and prioritization
            group advanced the following needs:

               Creating a             Addressing              Locations             Mental Health
              Post-COVID            Transportation           and Patterns           and Wellness
               Response                 Gaps                  of Poverty               Needs

                1. Create a community-wide post-COVID response for adults and youth

                2. Identify and address gaps in transportation related to:

                  – Flexibility in and outside of Kirby Medical Center service area
                    for transportation to and from local appointments
                  – Transportation to out-of-the-area substance use disorder and other
                    mental health services

                3. Identify location and patterns of poverty within the Kirby Medical Center
                   service area and address issues related to scattered or isolated poverty

                4. Identify and plan to address mental health and wellness needs across
                   the Kirby Medical Center service area

            The results of the assessment process were then presented to senior staff at Kirby
            Medical Center through a facilitated discussion for development of a plan to
            address the identified and prioritized needs.

            ADDRESSING THE NEED              CREATING THE PLAN

            The group addressed the needs with the following strategies:

                • Kirby Medical Center will collaborate with local officials, providers, agencies,
                  and organizations within communities served to recognize the potential
                  post-COVID needs of the communities and begin to analyze, assist, and
                  move together toward solutions.

8 I Community Health Needs Assessment
• Kirby Medical Center will investigate ways to make availability of KMC van
     service better known.

   • Kirby Medical Center will collaborate with the Piatt County Sheriff to explore
     transfers out-of-the-area for mental health and substance use disorder
     services.

   • Kirby Medical Center will utilize new U.S. Census and other data in
     combination with input from local government officials and community
     and faith-based organizations to identify poverty in the smaller communi-
     ties and rural areas, analyze its impact to health and wellness, and plan for
     mitigation.

 BACKGROUND

The Community Health Needs process is conducted every three years. In response
to issues identified and prioritized and the implementation strategy developed to
address them, Kirby Medical Center has taken the following steps since the last
CHNA.

Kirby Medical Center will start a geriatric behavioral health program

  • Kirby Senior Life Solutions started in the spring of 2020

Kirby Wellness Services

  • Free service that combines physical and mental health wellness services
    started in 2020

  • Kirby Medical Center implemented free COVID rapid testing for Piatt County
    student and school faculty

Kirby Medical Center will hire a new Licensed Clinical Social Worker

  • Another LCSW was hired during the summer of 2019 and advertising for an
    LCPC (Licensed Clinical Professional Counselor)

  • LCPC hired in the fall of 2020

  • LCSW services now also offered in Cerro Gordo and Atwood at the clinics

                                                                          Kirby Medical Center I 9
Kirby Medical Center will begin Mental Health First Aid training in the
            community

              • Staff have been trained in this, and KMC has offered to provide to the
                Ministerial Alliance

               • Mental Health First Aid provided to the Ministerial Alliance

            Kirby Medical Center will continue to support “Girls on the Run” through the
            Mattoon YMCA

              • Annual program that continues to be staffed by Kirby Medical Center,
                with 5-10 girls graduating every year

            Kirby Medical Center will continue the in-house pharmacy to address pain
            management

              • Continues to be staffed full-time, with regular face-to-face consults between
                the pharmacist and patients

            Kirby Medical Center will explore a retail outpatient pharmacy to collaborate
            with the clinics

              • Opened November 2019

              • Second location opened November 2020 on Market Street

            Kirby Medical Center will continue and expand corporate health services

              • New Wellness Coordinator has been hired and has made an immediate
                impact and connection with patients from Kirby Medical Group and
                also its employees

              • The Wellness Coordinator is working directly with corporate health partners
                for bi-annual lab and health metric testing

            Kirby Medical Center will continue and expand the internal employee health
            program

              • KMC has continued the program and continues to tweak and improve it

              • KMC will continue Seniors Active and Independent for Life (SAIL). The program
                has relocated to the Community Building where the class size can be
                increased and also, there is more room for social distancing.

10 I Community Health Needs Assessment
Kirby Medical Center will expand dietitian services for weight loss
• KMC has moved away from the Fresh Start/Ideal Protein program with new
food and a more streamlined, non-keto program that is proving successful
Kirby Medical Center will continue intensive behavioral therapy
• This continues and has proven successful
Kirby Medical Center will continue to develop recreation and exercise
opportunities on the Kirby Medical Center campus, in conjunction with
the YMCA
• Kirby Medical Center has expanded the KMC Active programs to include
KMC30. Other programs like Endurance and Olympic weightlifting have also
been added.
• The YMCA collaboration on the hospital campus has not worked out, and
KMC remains interested in helping the YMCA establish somewhere else
in the community. The YMCA is considering a Y Express in the Lincoln School
building when it is vacated. Monticello schools have put the Lincoln School up
for sale with no further interest from the Clinton YMCA.
• Kirby Medical Center will continue Neighborhood Medic welfare checks
and chronic care management through Kirby Medical Group ACO activities
and case management.
• Kirby Medical Center announced the development of the new Kirby Therapy
& Wellness Center, a 22,000 square foot building that will house therapy,
wellness, cardiac rehab, pulmonary rehab, dietitians, and KMC Active under
one roof.
Kirby Medical Center will support local partners that are attempting to address
food insecurity as reasonably possible
• Kirby Medical Center financially supports the operations and capital
improvements of the East Illinois Foodbank that serves areas in Piatt County
• Kirby Medical Center will continue to collect food to support local food
providers through employee programs
Kirby Medical Center I 11Kirby Medical Center will explore a hospital-owned retail pharmacy that will
utilize 340b program funds to improve access to affordable medication
• Kirby Rx has opened and offers 340b discounts. Additionally, hours are
expanded and over-the-counter medications are offered for a steep
discount.
• Kirby Rx #2 opened on November 2, 2021 on Market Street, and this location
will now be able to offer 340b discounts to clients and the potential of
expanding DME (durable medical equipment) services.
Kirby Medical Center will explore partnerships with local clergy to support
transportation needs beyond what Piattran can provide
• This was explored following the community meetings, and a contact
number was given. When called, the message went to a machine with
no response. That clergy is no longer in the local ministry, and contact
will be made with the Ministerial Alliance leader to see if there is another
option.
• Kirby Medical Center has purchased a MediVan that can be used to
transport patients to and from the outlying clinics, as well as from the
Emergency Department when other transportation is not available.
A small number of expected activities were not completed, largely because
of COVID-19 and staffing issues but they remain under review.
12 I Community Health Needs AssessmentKirby Medical Center I 13
AREA SERVED BY KIRBY MEDICAL CENTER

                                          Kirby Medical Service Area South 2021

                                                                                                           February 14, 2022

                       ©2022 Esri                                                                                  Page 1 of 1

            For the purpose of this CHNA, Kirby Medical Center has defined its primary service
            area and populations as the general population within the geographic area in and  February 14, 2022

            surrounding Monticello, defined in detail below. This includes all of Piatt County
          ©2022 Esri                                                                                 Page 1 of 1

            and some adjoining locations. The hospital’s patient population includes all who
            receive care without regard to insurance coverage or eligibility for assistance. A
            total of 16,847 people live in the 445.75 square mile report area defined for this
            assessment, according to the U.S. Census Bureau American Community Survey
            2015‐-19 5‐-year estimates. The population density for this area, estimated at 38
            persons per square mile, is less than the national average population density of 92
            persons per square mile.
                                    Monticello     LaPlace            Cisco       Mansfield
                                     Deland      White Heath         Bement       Hammond
                                     Atwood      Cerro Gordo         Milmine

14 I Community Health Needs Assessment
Kirby Medical Center Service Area – Key Facts
KEY FACTS EDUCATION
18,129 44.4
Population 6%
Median Age
31%
2.4 $67,079 No High School Some College
Diploma
34% 29%
Average Median Household High School Bachelor's/Grad/Pr
Household Size Income Graduate of Degree
BUSINESS EMPLOYMENT
62%
White Collar
27% 3.9%
Blue Collar
575 4,612 Unemployment
Rate
Total Businesses Total Employees
11%
Services
INCOME Households By Income
The largest group: $100,000 - $149,999 (19.0%)
The smallest group: $200,000+ (4.3%)
Indicator ▲ Value DiffThe unemployment rate of 3.9% is lower than statewide and also lower than the
U.S. Also, as is the case in much of rural Illinois, median family household income
in the service area is lower than statewide.
LOCAL IMPACT OF COVID as of 2/16/22
COVID-19 Confirmed Cases and Mortalities
The COVID-19 epidemic has overshadowed many local health functions since
March 2020. It has dramatically impacted overall health of the communities and
the delivery of healthcare and health-related services. The broad impact has been
seen throughout the communities, changing the way people work, shop, learn,
and communicate.
The mortality rate related to COVID-19 in the service area of Piatt County
essentially is approximately one-half the rate of the state of Illinois. This indicator
reports incidence rate of confirmed COVID-19 cases per 100,000 population. Data
for this indicator are updated daily and derived from the Johns Hopkins University
data feed. In the Kirby Medical Center-Piatt County service area, there have been
4,285 total confirmed cases of COVID-19. Data are current as of 2/16/2022.
Confirmed
COVID-19 Cases
Note: This indicator is compared to the state average.
Data Source: Johns Hopkins University. Accessed via ESRI.
Additional data analysis by CARES. 2021. Source geography: County
16 I Community Health Needs AssessmentIn the service area, there have been 21 total deaths among patients with confirmed
cases of the coronavirus disease COVID-19. Data are current as of 2/16/2022.
COVID-19
Mortalities
Note: This indicator is compared to the state average.
Data Source: Johns Hopkins University. Accessed via ESRI.
Additional data analysis by CARES. 2021. Source geography: County
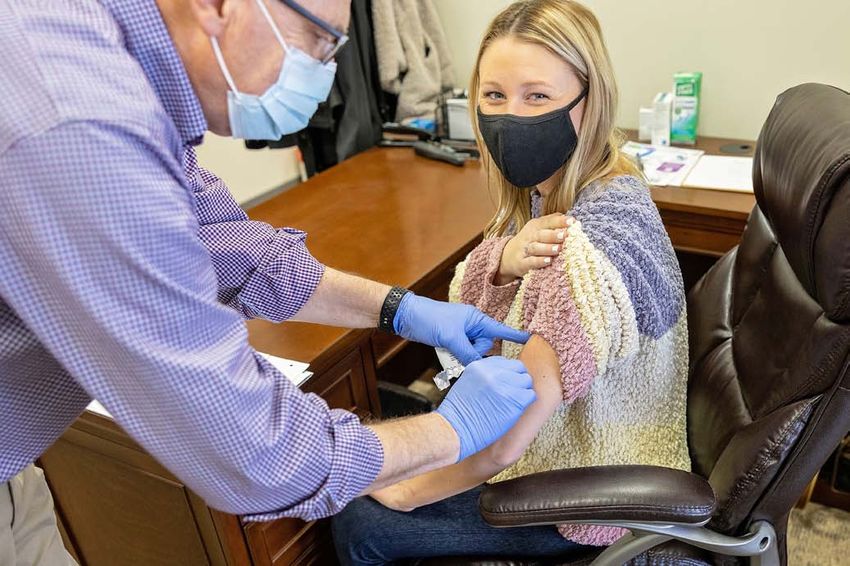
COVID-19 Fully Vaccinated Adults
This indicator reports the percent of adults fully vaccinated for COVID-19.
Data is updated daily from the CDC API. Vaccine hesitancy is the percent of the
population estimated to be hesitant towards receiving a COVID-19 vaccine. The
Vaccine Coverage Index is a score of how challenging vaccine roll-out may be
in some communities compared to others, with values ranging from 0 (least
challenging) to 1 (most challenging). Data are current as of 2/16/2022.
Note: This indicator is compared to the state average. Data Source: Centers for Disease Control and Prevention
and the National Center for Health Statistics, CDC GRASP, 2021.
Kirby Medical Center I 17Data Collection Quantitative Qualitative Data Analysis
ESTABLISHING THE CHNA INFRASTRUCTURE AND PARTNERSHIPS
Data Collection
SECONDARY DATA
Description of Data Sources – Quantitative
Quantitative (secondary) data is collected from many resources including, but not
restricted to, the following:
Source Description
Behavioral Risk Factor The BRFSS is the largest, continuously conducted telephone
Surveillance System health survey in the world. It enables the Center for Disease
Control and Prevention (CDC), state health departments,
and other health agencies to monitor modifiable risk factors
for chronic diseases and other leading causes of death.
SparkMap SparkMap is an online mapping and reporting platform
powered by the Center for Applied Research and Engagement
Systems (CARES) at the University of Missouri.
US Census National census data is collected by the US Census Bureau
every 10 years.
Centers for Through the CDC’s National Vital Statistics System, states col-
Disease Control lect and disseminate vital statistics as part of the US’s oldest
and most successful intergovernmental public health data
sharing system.
Kirby Medical Center I 19Source Description
County Health Each year, the overall health of each county in all 50 states
Rankings is assessed and ranked using the latest publicly available
data through a collaboration of the Robert Wood Johnson
Foundation and the University of Wisconsin Population Health
Institute.
American The American Community Survey (ACS), a product of the
Communities U.S. Census Bureau, helps local officials, community leaders,
Survey and businesses understand the changes taking place in their
communities. It is the premier source for detailed population
and housing information about our nation.
Illinois Department of The Illinois Department of Employment Security is the state’s
Employment Safety employment agency. It collects and analyzes employment
information.
National Cancer The National Cancer Institute coordinates the National Cancer
Institute Program, which conducts and supports research, training,
health information dissemination, and other programs with
respect to the cause, diagnosis, prevention, and treatment of
cancer, rehabilitation from cancer, and the continuing care of
cancer patients, and the families of cancer patients.
Illinois Department The Illinois Department of Public Health is the state
of Public Health agency responsible for preventing and controlling disease
and injury, regulating medical practitioners, and promoting
sanitation.
HRSA The Health Resources and Services Administration of the US
Department of Health and Human Services develops health
professional shortage criteria for the nation and uses that data
to determine the location of Health Professional Shortage
Areas and Medically Underserved Areas and Populations.
Local IPLANS The Illinois Project for Local Assessment of Needs (IPLAN) is
a community health assessment and planning process that
is conducted every five years by local health jurisdictions in
Illinois.
ESRI ESRI (Environmental Systems Research Institute) is an
international supplier of Geographic Information System
(GIS) software, web GIS and geodatabase management
applications. ESRI allows for specialized inquiries at the
zip code, or other defined, level.
Illinois State Board The Illinois State Board of Education administers public
of Education education in the state of Illinois. Each year, it releases school
“report cards” which analyze the makeup, needs,
and performance of local schools.
USDA USDA, among its many functions, collects and analyzes
information related to nutrition and local production and food
availability.
20 I Community Health Needs AssessmentSecondary data is initially collected through the SparkMap and/or ESRI systems
and then reviewed. Questions raised by the data reported from those sources are
compared with other federal, state and local data sources in order to resolve or
reconcile potential issues with reported data.
PRIMARY DATA
Two focus groups were convened at Kirby Medical Center on December 9 and
10, 2021. The groups included representation of healthcare providers, community
leaders, community services providers, schools, faith-based organizations,
local elected officials, public health, and others. Several members of the groups
provided services to underserved and unserved persons as all or part of their roles.
In response to a request to identify positive developments in health and healthcare
in the service area of Kirby Medical Center, the group put forward the following:
Focus Group One – Community Leaders and Partners
• School COVID testing program
• There has been better cooperation/collaboration on many community
issues by agencies and organizations of all types
• Kirby Medical Center has expanded mental health services
• IMPACT Coalition
• Collaboration among Kirby Medical Center and schools to address COVID-
related issues has grown to include ongoing partnerships
• Partnership between KMC Active and schools
• Excellent teamwork between Monticello Fire Department and Kirby Medical
Center Ambulance
• Youth lunch programs have developed in small towns in the county
• Meals on Wheels has adapted well to COVID
• Mental health resources have generally increased
• The stigma around mental health issues and substance use issues and
substance use disorders has been reduced
• American Rescue Plan Act funding has supported new programs for youth
and others at Public Health and other agencies
Kirby Medical Center I 21• Drug takeback program has expanded
• Local schools are offering a CEO entrepreneurship program for youth
supported by Kirby Medical Center and others
• Kirby Medical Center offers a “grow your own” scholarship program for local
healthcare professions
The people of Piatt County really came together to care for our people.
Focus Group Two – Medical Professionals and Partners
• Strong collaboration among healthcare providers, schools, community
organizations, community agencies, and others in response to COVID
• High level of cooperation among healthcare providers to make sure that
patients could be seen on a timely basis
• General surgeon
• Mental health counselors
• Cardiology services
• Hand surgeon
• Additional care navigators at Kirby Medical Center
• Continued services for substance use disorder
• Continued services for pain management
• COVID has led to strong collaboration around planning and community life
and needs
• Emergency services providers came together in response to COVID
• Kirby Medical Center has adjusted to evolving needs for individual patients
and the communities
• Increased collaboration for peer support for persons facing substance use
disorders
• Health services are working well together to provide patients with services
and options in a spirit of “coopetition”
22 I Community Health Needs Assessment• A cooperative effort including Kirby Medical Center, other organizations and
groups, and area youth has begun a small food pantry project utilizing food
pantries made by youth
• Kirby Medical Center is responsive and proactive in addressing staff
wellness
• New clinic in Atwood has begun to provide local service to the Amish
community there
• New urgent care at Kirby Medical Center
Health services are working well together to provide patients
with services and options in a spirit of collaboration and ‘coopetition.’
The groups were next asked to identify needs continuing to face the health
of the community, including physical and mental wellness and the delivery
of health services and care for all segments and members.
Focus Group One – Community Leaders and Partners
• Mental health services to address isolation (COVID, seniors, others)
• Address the loss of population and infrastructure in small communities
• Transportation to out-of-the-area in-patient care for substance use disorders
• Affordable and available rental housing in Monticello
• Continued collaboration on planning for emergencies and disasters
• Better access to nursing home care or home healthcare for seniors
• Crisis training for first responders
• Mental health counseling for youth
• Access to timely and efficient care in the small communities
• Improved access to non-emergency transportation
• A SANE (Sexual Assault Nurse Examiner) Nurse
• Affordable housing – not just low income
• Address resource and “brain drain”
Kirby Medical Center I 23• Continue to improve awareness of Kirby Medical Center and its many
services, programs, and partnerships
• Address the need for more flexibility in public transportation
• Improve outreach for seniors including, but beyond, direct care
• Expand social services in Monticello to easier access in the rest of the
county
• Provide more and broader support groups
Focus Group Two – Medical Professionals and Partners
• Mental health services at all levels for youth
• Address gaps in transportation for local services and distant appointments
• Increase local opportunities for safe socialization and recreation for youth
• Explore formation of a community-based program to address planning
and provision of services for seniors
• Opportunities for socialization for seniors
• Continue the momentum of community partnerships resulting from COVID
• Available affordable local counseling for youth and adults
• Recruit additional primary care providers
• Improve services for mental health concerns and substance use disorders
• Emphasis on services for anxiety, depression, and other mental health
issues
• Create community awareness of need to pay attention to isolated seniors
• Plan to address the potential long-term impacts of COVID
• Inform the public of the need to get back to preventive care, screenings, etc.
• Address loss of community service organizations
• Plan for healthcare provider shortages at all levels, especially nursing
• Bridge the gap for patients that are technologically unable or unwilling in
the face of shortages of employees
• Increased access for transfers for persons with mental health issues and
substance use disorders
• Social and emotional learning opportunities for youth
24 I Community Health Needs AssessmentKirby Medical Center I 25
Age Group             Ethnicity                         Race                          Disability

DATA ANALYSIS

 DEMOGRAPHICS

Total Population by Age Group

                          Data Source: US Census Bureau, American Community Survey. 2015‐-19. Source Geography: Tract

                                                                                           Kirby Medical Center I 27
Total Population by Age Groups, Kirby Medical Center Service Area
Total Population by Ethnicity
Data Source: US Census Bureau, American Community Survey. 2015-‐19. Source geography: Tract
28 I Community Health Needs AssessmentTotal Population by Race Alone
Data Source: US Census Bureau, American Community Survey. 2015‐-19. Source geography: Tract
Total Population by Race Alone, Kirby Medical Center Service Area
Kirby Medical Center I 29Population with any Disability
This indicator reports the percentage of the total civilian non-institutionalized
population with a disability. The report area has a total population of 16,793 for
whom disability status has been determined, of which 2,199 or 13.09% have any
disability. This indicator is relevant because disabled individuals comprise a
vulnerable population that requires targeted services and outreach by providers.
Note: This indicator is compared to the state average.
Data Source: US Census Bureau, American Community Survey. 2015‐-19. Source geography: Tract
30 I Community Health Needs AssessmentSOCIAL DETERMINANTS OF HEALTH
SOCIAL DETERMINANTS OF HEALTH
The data and discussion on the following pages will take a look into the social
determinants in the Kirby Medical Center service area and will offer insight into
the complexity of circumstances that impact physical and mental wellness for
the KMC audience. The infographic on Page 33 provides a snapshot of the at-risk
population served by Kirby Medical Center.
The CDC describes social determinants of health as conditions in the places where
people live, learn, work, and play that affect a wide range of health and quality of
life risks and outcomes. Healthy People 2030 uses a place-based framework that
outlines five key areas of SDoH:
• Healthcare access and quality, including:
- Access to healthcare
- Access to primary care
- Health insurance coverage
- Health literacy
• Education access and quality, including:
- High school graduation
- Enrollment in higher education
- Educational attainment in general
- Language and literacy
- Early childhood education and development
• Social and community context – within which people live, learn work
and play, including:
- Civic participation
- Civic cohesiveness
- Discrimination
- Conditions within the workplace
• Economic stability, including:
- Income
- Cost of living
- Socioeconomic status
- Poverty
Kirby Medical Center I 31• - Employment
- Food security
- Housing stability
• Neighborhood and built environment, including:
- Quality of housing
- Access to transportation
- Availability of healthy food
- Air and water quality
- Crime and violence
Some of the social determinant indicators reflected in the data include:
• 1,871 households with disability
• 425 households below the poverty level (6%)
• Median household income is $67,079, which is higher than Illinois
but lower than the U.S.
Economic and social insecurity often are associated with poor health.
Poverty, unemployment, and lack of educational achievement affect access
to care and a community’s ability to engage in healthy behaviors. Without a
network of support and a safe community, families cannot thrive. Ensuring
access to social and economic resources provides a foundation for a
healthy community.
32 I Community Health Needs Assessment18,129
Population
Kirby Medical Center Service Area
AT RISK POPULATION PROFILE 1,871
AT RISK POPULATION P Geography: County Households With
Disability
11 ZIP Codes
POPULATION BY AGE
PO
12,000
10,811
18,129 7,472 2.42 44.4
6%
Households Below
8,000 Population Households Avg Size Median
the Poverty Level
Household Age H
POPU
4,000
3,736 AT RISK POPULATION
3,582 L
E
14,949
0 S
1,871
Under 18 3,856Aged 65+
18 to 65 221 Daytime
AT RISK POPULATION PROFILEHouseholds With
Population S
Population 65+ Households
S
11 ZIP Codes Disability Geography: Without
ZIP Code Vehicle
Source: Esri forecasts for 2021, U.S. Census Bureau 2015-2019 American Community Survey (ACS) Data,
Source: This infographic contains data provided by Esri, Esri, American Community Survey (ACS), Esri and DaS
POPULATION BY AGE
POVERTY AND LANGUAGE I
18,129 7,472 2.42 44.4 $67,079 $162,390 92 231 9
Population Households Avg Size Median Median Median Wealth Housing Diversity I
12,000 Household Age Household Income Home Value Index Affordability Index
10,811 I
AT RISK POPULATION Language Spoken (ACS) 6% Age 5-17 18-64 425 Age 65+ Total 0 I
English Only 2,795 9,622 3,249 15,666
Households Below Households Below Pop 65+ Speak A
8,000 the Poverty Level the154
Poverty Level Spanish & No English
Spanish 22 2 178
1,871 3,856 221 Spanish & English Well 22 141 2 165
A
Households With Population 65+ Households
Spanish & English Not Well 0 14 0 14 A
Disability Without Vehicle
Spanish & No English POPULATION
0 0 AND BUSINESSES
0 0 A
3,736 3,582
4,000 POVERTY AND LANGUAGE Indo-European 121 218 31 370
Indo-European & English Well 121 218 31 370
O
Indo-European & English Not Well 0 0 0 0 O
6% 425 0 Indo-European & No English 14,949 0 0 575 0 0 4,612 O
0
Households Below Households Below Pop 65+ Speak Asian-Pacific Island Daytime 16 73 Total 1 90 Total O
Under
the Poverty Level 18 the Poverty Level
18 to 65 Aged
Spanish & No English 65+
Asian-Pacific Isl & English WellPopulation 16 Businesses 1
61 78Employees
Asian-Pacific Isl & English Not Well 0 12 0 12
Source: Esri forecasts forPOPULATION AND2015-2019
2021, U.S. Census Bureau BUSINESSES Asian-Pacific Isl & No English
American Community Survey (ACS) Data, 0 0 0 0
82
Source: This infographic contains data provided by Esri, Esri, AmericanOther LanguageSurvey (ACS), Esri and Data
Community 0 0 vintage of14
Axle. The 14
the data is 2021, 2026, 2015-2019, 2021.
Other Language & English Well 0 0 14 14
14,949 575 4,612 Other Language & English Not Well 0 0 0 0
Daytime Total Total Other Language & No English 0 0 0 0
65+
Population Businesses Employees
ey (ACS) Data, Version 1.8 © 2022 Esri
merican Community Survey (ACS), Esri and Data Axle. The vintage of the data is 2021, 2026, 2015-2019, 2021.
Kirby Medical Center I 33Economic Stability
Economic and social insecurity often are associated with poor health.
Poverty, unemployment, and lack of educational achievement affect
access to care and a community’s ability to engage in healthy behaviors.
Without a network of support and a safe community, families cannot thrive.
Ensuring access to social and economic resources provides a foundation
for a healthy community.
Employment – Unemployment Rate
Total unemployment in the service area for the current month equals 249 or
2.8% of the civilian, non‐institutionalized population age 16 and older (non‐
seasonally adjusted). This indicator is relevant because unemployment
creates financial instability and barriers to access including insurance
coverage, health services, healthy food, and other necessities that
contribute to poor health status.
Note: This indicator is compared to the state average.
Data Source: US Department of Labor, Bureau of Labor Statistics, 2021 - August. Source geography: County
Note: Unemployment data changes monthly, and the numbers reported here
depend on the date the data was collected for this report.
34 I Community Health Needs AssessmentIncome – Median Household Income
This indicator reports median household income based on the latest 5-year
American Community Survey estimates. This includes the income of the
householder and all other individuals 15 years old and over in the household,
whether they are related to the householder or not. Because many households
consist of only one person, average household income is usually less than average
family income.
Note: This indicator is compared to the state average.
Data Source: US Census Bureau, American Community Survey. 2015‐19. Source geography: Tract
Kirby Medical Center I 35Income - Per Capita Income
The per capita income for the report area is $33,142. This includes all reported
income from wages and salaries as well as income from self-employment, interest
or dividends, public assistance, retirement, and other sources. The per capita
income in this report area is the average (mean) income computed for every man,
woman, and child in the specified area.
Note: This indicator is compared to the state average.
Data Source: US Census Bureau, American Community Survey. 2015‐19. Source geography: Tract
$33,142
36 I Community Health Needs AssessmentPoverty – Population Below 100% FPL
Poverty is considered a key driver of health status. Within the service area, 5.88%
or 969 individuals are living in households with income below the Federal Poverty
Level (FPL). This indicator is relevant because poverty creates barriers to access
including health services, health food, and other necessities that contribute to
poor health status.
Note: This indicator is compared to the state average.
Data Source: US Census Bureau, American Community Survey. 2015‐19. Source geography: Tract
Kirby Medical Center I 37Poverty – Children Below 100% FPL
In the service area, 6.92% or 264 children aged 0-17 are living in households with
income below the Federal Poverty Level (FPL). This indicator is relevant because
poverty creates barriers to access including health services, healthy food, and
other necessities that contribute to poor health status.
Note: This indicator is compared to the state average.
Data Source: US Census Bureau, American Community Survey. 2015‐19. Source geography: Tract
38 I Community Health Needs AssessmentPoverty – Children Eligible for Free/Reduced Price Lunch
Free or reduced price lunches are served to qualifying students in families
with income between under 185 percent (reduced price) or under 130% (free
lunch) of the U.S. federal poverty threshold as part of the federal National
School Lunch Program (NSLP). Out of 15,998 total public school students
in the service area, 5,491 were eligible for the free or reduced price lunch
program in the latest report year. This represents 34.30% of public school
students, which is lower than the state average of 48.7%.
Note: This indicator is compared to the state average.
Data Source: US Census Bureau, American Community Survey. 2015‐19. Source geography: County
Kirby Medical Center I 39Education – Attainment
Educational attainment shows the distribution of the highest level of education
achieved in the report area and helps schools and businesses to understand the
needs of adults, whether it be workforce training or the ability to develop science,
technology, engineering, and mathematics opportunities. Educational attainment
is calculated for persons over 25, and is an estimated average for the period
from 2014 to 2019. For the selected area, 18.8% have at least a college bachelor’s
degree, while 34.8% stopped their formal educational attainment after high school.
Note: This indicator is compared to the state average.
Data Source: U.S. Census Bureau, American Community Survey, 2015-19. Source geography: County
40 I Community Health Needs AssessmentFood Insecurity Rate
Food insecurity is the household-level economic and social condition of
limited or uncertain access to adequate food. This indicator reported the
estimated percentage of the population that experienced food insecurity
at some point during the report year. Food insecurity is the household-
level economic and social condition of limited or uncertain access to
adequate food.
Note: This indicator is compared to the state average.
Data Source: Feeding America, 2017. Source geography: County
Kirby Medical Center I 41HEALTH AND WELLNESS INDICATORS
Physical Inactivity
Within the service area, 101,754 or 21.8% of adults aged 20 and older self-report
no active leisure time, based on the question: “During the past month, other than
your regular job, did you participate in any physical activities or exercises such
as running, calisthenics, golf, gardening, or walking for exercise?” This indicator
is relevant because current behaviors are determinants of future health, and this
indicator may illustrate a cause of significant health issues, such as obestity and
poor cardiovascular health.
Note: In 2021, the CDC updated the methodology used to produce estimates for this indicator.
Estimated volumes for prior years (2004-2017) have been updated in this platform to allow comparison
across years. Use caution when comparing with saved assessments generated prior to November 10,
2021.
Note: This indicator is compared to the state average. Data Source: Centers for Disease Control and Prevention, National Center for
Chronic Disease Prevention and Health Promotion, 2019. Source geography: County
42 I Community Health Needs AssessmentCHRONIC ILLNESS
Cancer Incidence – All Sites
This indicator reports the age-adjusted incidence rate (cases per 100,000
population per year) of cancer (all sites), adjusted to 2000 U.S. standard population
age groups (under age 1, 1-4, 5-9, ..., 80-84, 85 and older). Within the report area,
there were 114 new cases of cancer reported. This means there is a rate of 500.4 for
every 100,000 total population.
Note: This indicator is compared to the state average.
Data Source: State Cancer Profiles. 2014-18. Source geography: County
Kirby Medical Center I 43Mortality – Cancer
This indicator reports the 2016-2020 five-year average rate of death due to
malignant neoplasm (cancer) per 100,000 population. Figures are reported
as crude rates, and as rates age-adjusted to year 2000 standard. Rates are
resummarized for service areas from county level data, only where data is
available. This indicator is relevant because cancer is a leading cause of death in
the United States. Within the service area, there are a total of 193 deaths due to
cancer. This represents an age-adjusted death rate of 159.3 per every 100,000 total
population.Note: Data are suppressed for counties with fewer than 20 deaths in the timeframe.
Note: This indicator is compared to the state average. Data Source: Centers for Disease Control and Prevention, National Vital
Statistics System, Accessed via CDC WONDER, 2015-2019. Source geography: County
44 I Community Health Needs AssessmentChronic Conditions – Adult
Chronic Lower Respiratory Disease
These tables present the percentage of adults ever diagnosed with Chronic Lower
Respiratory Disease and Coronary Heart Disease. The data is reflected by county
and the entire service area and provides comparisons within the service area.
Note: This indicator is compared to the state average. Data Source: Centers for Disease Control and Prevention,
Behavioral Risk Factor Surveillance System. Accessed via the 500 Cities Data Portal, 2018.
Coronary Heart Disease
Note: This indicator is compared to the state average. Data Source: Centers for Disease Control and Prevention,
Behavioral Risk Factor Surveillance System. Accessed via the 500 Cities Data Portal, 2018.
Kirby Medical Center I 45High Blood Pressure
These tables present the percentage of adults ever diagnosed with High Blood
Pressure and High Cholesterol. The data is reflected by county and the entire
service area and provides comparisons within the service area.
Note: This indicator is compared to the state average. Data Source: Centers for Disease Control and Prevention,
Behavioral Risk Factor Surveillance System. Accessed via the 500 Cities Data Portal, 2018.
High Cholesterol
Note: This indicator is compared to the state average. Data Source: Centers for Disease Control and Prevention,
Behavioral Risk Factor Surveillance System. Accessed via the 500 Cities Data Portal, 2018.
46 I Community Health Needs AssessmentMortality – Coronary Heart Disease
This indicator reports the 2016-2020 five-year average rate of death due to
coronary heart disease (ICD10 Codes I20-I25) per 100,000 population. Figures are
reported as crude rates, and as rates age-adjusted to year 2000 standard. Rates
are resummarized for service areas from county level data, only where data is
available. This indicator is relevant because coronary heart disease is a leading
cause of death in the United States. Within the report area, there are a total of 92
deaths due to coronary heart disease. This represents an age-adjusted death rate
of 76.4 per every 100,000 total population. Note: Data are suppressed for counties with fewer
than 20 deaths in the timeframe.
Note: This indicator is compared to the state average. Data Source: Centers for Disease Control and Prevention:
National Vital Statistics System. Accessed via CDC WONDER: 2015-2019. Source geography: County
Kirby Medical Center I 47MENTAL HEALTH
Poor Mental Health
This indicator reports the percentage of adults aged 18 and older who report 14
or more days during the past 30 days during in which their mental health was not
good.
Note: This indicator is compared to the state average. Data Source: Centers for Disease Control and Prevention,
Behavioral Risk Factor Surveillance System. Accessed via the 500 Cities Data Portal, 2018.
48 I Community Health Needs AssessmentDepression (Medicare Population)
This indicator reports the number and percentage of the Medicare fee-for-
service population with depression. Data are based upon Medicare administrative
enrollment and claims data for Medicare beneficiaries enrolled in the fee-
for-service program. Within the report area, there were 360 beneficiaries with
depression based on administrative claims data in the latest report year.
This represents 17.1% of the total Medicare fee-for-service beneficiaries.
Note: This indicator is compared to the state average. Data Source: Centers for Medicare and Medicaid Services, CMS -
Geographic Variation Public Use File, 2018. Source geography: County.
Kirby Medical Center I 49Access to Care – Mental Health
This indicator reports the number of mental health providers in the report area
as a rate per 100,000 total area population. Mental health providers include
psychiatrists, psychologists, clinical social workers, and counselors that specialize
in mental health care.
Note: This indicator is compared to the state average. Data Source: Centers for Medicare and Medicaid Services, CMS - National Plan
and Provider Enumeration System (NPPES). Accessed via County Health Rankings.
50 I Community Health Needs AssessmentBEHAVIORAL HEALTH
Deaths of Despair – Suicide + Drug/Alcohol Poisoning
This indicator reports average rate of death due to intentional self-harm (suicide),
alcohol-related disease, and drug overdose, also known as “deaths of despair,” per
100,000 population. Figures are reported as crude rates, and as rates age-adjusted
to year 2000 standard. Rates are resummarized for service areas from county
level data, only where data is available. This indicator is relevant because death of
despair is an indicator of poor mental health. Within the service area, there were
33 deaths of despair. This represents an age-adjusted death rate of 36.3 per every
100,000 total population.
Note: This indicator is compared to the state average. Data Source: Centers for Disease Control and Prevention, National
Vital Statistics System. Accessed via CDC WONDER, 2015-2019. Source geography: County
Kirby Medical Center I 51Mortality – Suicide
This indicator reports the 2016-2020 five-year average rate of death due to
intentional self-harm (suicide) per 100,000 population. Rates are resummarized
for report areas from county level data, only where data is available. This
indicator is relevant because suicide is an indicator of poor mental health.
Note: Data are suppressed for counties with fewer than 20 deaths in the time frame.
Note: This indicator is compared to the state average. Data Source: Centers for Disease Control and Prevention, National Vital
Statistics System, Accessed via CDC WONDER, 2015-2019. Source geography: County
52 I Community Health Needs AssessmentTeen Births
This indicator reports the seven-year average number of births per 1,000 female
population aged 15-19.
Note: This indicator is compared to the state average. Data Source: Centers for Disease Control and Prevention,
Behavioral Risk Factor Surveillance System. Accessed via the 500 Cities Data Portal, 2018.
Kirby Medical Center I 53SUBSTANCE USE
Alcohol – Heavy Alcohol Consumption
Excessive drinking is defined as the percentage of the population who reports at
least one binge drinking episode involving five or more drinks for men and four or
more per day for women, over the same time period. Alcohol use is a behavioral
health issue that is also a risk factor for a number of negative health outcomes,
including: physical injuries related to motor vehicle accidents, stroke, chronic
diseases such as heart disease and cancer, and mental health conditions such as
depression and suicide. There are a number of evidence-based interventions that
may reduce excessive/binge drinking; examples include raising taxes on alcoholic
beverages, restricting access to alcohol by limiting days and hours of retail sales,
and screening and counseling for alcohol abuse (Centers for Disease Control and
Prevention, Preventing Excessive Alcohol Use, 2020).
Note: This indicator is compared to the state average. Data Source: University of Wisconsin Population Health Institute, County Health
Rankings, 2018. Source geography: County.
54 I Community Health Needs AssessmentMortality – Opioid Overdose
This indicator reports the 2016-2020 five-year average rate of death due to opioid
drug overdose per 100,000 population. Figures are reported as crude rates, and
as rates age-adjusted to year 2000 standard. Rates are resummarized for report
areas from county level data, only where data is available. This indicator is relevant
because opioid drug overdose is the leading cause of injury deaths in the United
States, and they have increased dramatically in recent years.
Note: Data are suppressed for counties with fewer than 20 deaths in the timeframe.
Note: This indicator is compared to the state average. Data Source: Centers for Disease Control and Prevention, National
Vital Statistics System. Accessed via CDC WONDER, 2015-2019. Source geography: County.
Kirby Medical Center I 55DIVERSITY AND MINORITY HEALTH STATUS
Population in Poverty Race Alone, Percent
This indicator reports the average (population weighted) Area Deprivation Index
(ADI) for the selected area. The ADI ranks neighborhoods and communities relative
to all neighborhoods across the nation (National Percentile) or relative to other
neighborhoods within just one state (state percentile). The ADI is calculated based
on 17 measures related to four primary domains (education; income
and employment; housing; and household characteristics). The overall scores
are measured on a scale of 1 to 100 where 1 indicates the lowest level of
deprivation (least disadvantaged) and 100 is the highest level of deprivation
(most disadvantaged).
Note: This indicator is compared to the state average. Data Source: University of Wisconsin-Madison School of
Medicine and Public Health, Neighborhood Atlas, 2021. Source geography: Block Group.
56 I Community Health Needs AssessmentEmergency Preparedness
EMERGENCY PREPAREDNESS
Kirby Medical Center works with the US-HHS ASPR, the Illinois Department of
Public Health, county health departments, the Illinois Emergency Management
Agency, and other state, regional, and local partners to plan, exercise, and equip
for emergency preparedness and to ensure the ability to address a wide range
of potential emergencies, ranging from disasters of all causes to pandemics and
terrorism.
Kirby Medical Center I 57Creating a Addressing Locations Mental Health
Post-COVID Transportation and Patterns and Wellness
Response Gaps of Poverty Needs
IDENTIFICATION AND PRIORITIZATION OF NEEDS
SECONDARY
PROCESS DATA
The steering group was comprised of representatives from both focus groups
(law enforcement, faith-based providers, mental health service providers, and
schools), and members serving persons likely to be unserved, underserved, or
otherwise experiencing unmet needs. This group met virtually on January 17, 2021,
to identify and prioritize significant health needs.
The group reviewed notes from the focus groups and summaries of data reviewed
by the consultant which included SparkMap, ESRI, Illinois Department of Public
Health, CDC, USDA, Illinois Department of Labor, HRSA, County Health Rankings
and Roadmaps, National Cancer Institute, and other resources.
Kirby Medical Center I 59You can also read