23 February 2018, London - FUTURE PUBLIC SECTOR LOGISTICS CONSOLIDATION - Citylab
←
→
Page content transcription
If your browser does not render page correctly, please read the page content below
FUTURE PUBLIC SECTOR LOGISTICS CONSOLIDATION
23 February 2018, London
AGENDA

Time           Item
10:30 – 10:45 Introduction and purpose of the day
10:45 – 11:00 The Department for Transport – Policy context
11:00 – 11:10 Transport Systems Catapult Methodology
11:10 – 12:10 The Southampton Case Study
                 a) Southampton County Council and University of Southampton
                 b) University Hospital Southampton
                 c) Meachers Global Logistics
12:10 – 12:15 Short break
12:15 – 12:30 TSC Research and Results
12:30 – 13:00 Lunch
13:00 – 14:00 Discussion of results and next steps
14:00 – 14:30 Call to action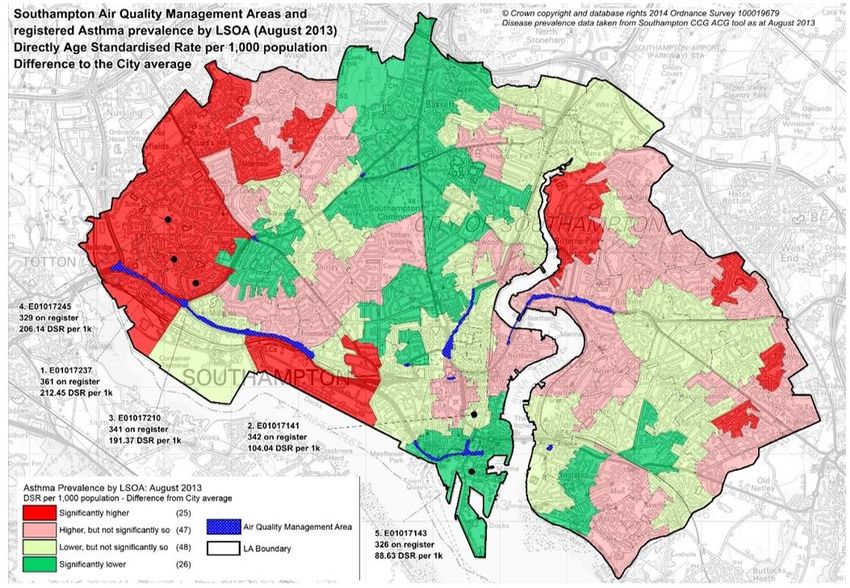
INTRODUCTION AND PURPOSE OF THE DAY

DR ANDREW TRAILL
Principal Technologist – Freight & Logistics
Transport Systems Catapult
INTRODUCTION

• Who are Transport Systems Catapult (TSC)?
  • One of 11 catapults established and overseen by Innovate UK
  • Impartial, not for profit organisation created to drive and
    promote intelligent mobility
  • Using new emerging technologies to transport people and goods

• Purpose of the day
  • Setting the scene and origins of the project
  • Who is involved and why
  • Project methodology and research
  • Outcome of the project
  • Feedback on results and next steps
Consolidating Public Sector
                                           Logistics Operations
               Duncan Price, Head of Freight, Operator Licensing &
                                                  Roadworthiness

Moving Britain Ahead   Consolidating Public Sector Logistics Operations   23 February 18
                                          Freight Carbon Review                        5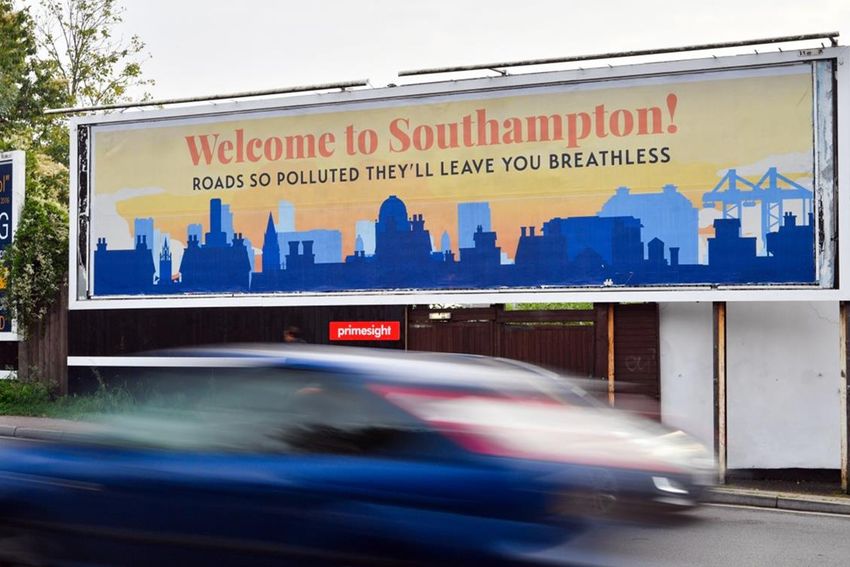
Background
The road freight sector is a major
contributor to the UK economy,
generating £11.9bn annually and
employing around 248,000 people.
But the sector is also a significant
source of UK greenhouse gas and air
pollutant emissions.
Need to address air quality and
climate change commitments:
Short-term challenge on air
quality
Ongoing carbon budget
obligations and long-term 80%
2050 Climate Change Act target
(cf. 1990 levels)
6 Consolidating Public Sector Logistics Operations Moving Britain Ahead
February 18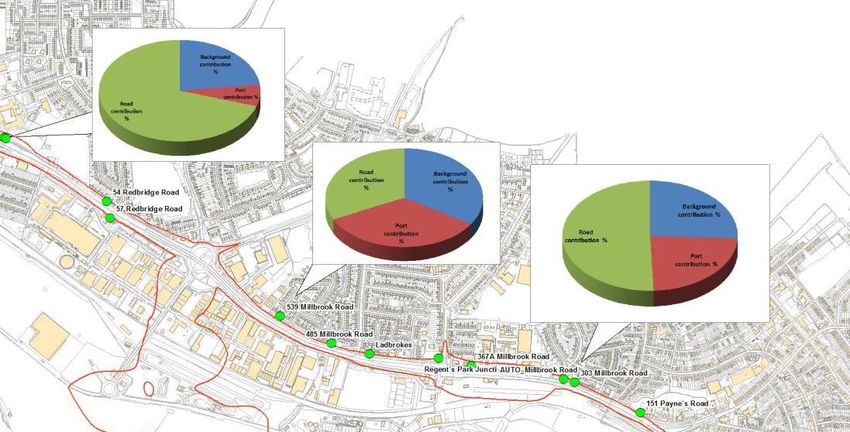
Greenhouse Gas Emissions
Road transport greenhouse gas emissions
1990-2015
In 2016, HGVs accounted for 18% of
road transport GHG emissions. 80
HGVs are second largest source of road 70
transport GHG emissions (after 32% Cars - petrol
passenger cars).
Million tonnes of CO2e
60
In 2016, vans accounted for 17% of UK
road transport GHG emissions. 50
Vans are third largest and fastest 40
growing source of road transport GHG
emissions.
30
2017 Clean Growth Strategy notes 18% HGVs
30% Cars - diesel
significant reduction in HGV emissions is 20
16% Vans
needed.
10
CCC strong interest in freight. 3% Buses and Coaches
1% Other
0
1990 1995 2000 2005 2010 2015
7 Consolidating Public Sector Logistics Operations Moving Britain Ahead
February 18
Air Quality
Road transport NOx emissions 1990-2015
In 2015, HGVs contributed 16%
to road transport NOx emissions.
Positive downward trend due to
success of heavy duty Euro VI
standard in tackling NOx.
In 2015, vans contributed 30% to
road transport NOx emissions.
Second highest source (after
diesel cars).
8 Consolidating Public Sector Logistics Operations Moving Britain Ahead
February 18
Clean Air Zones
Air Quality Plan for Tackling NO2 in urban areas was
published in 2017.
28 LAs must submit plans this year setting out how
they will meet NOx limits - identifying measures to
achieve legal compliance in shortest possible time.
One option is to introduce a Clean Air Zone,
restricting operation of certain vehicle types.
Leeds, Birmingham, Nottingham, Derby and
Southampton are expected to implement CAZ by end
of 2019.
£255m Implementation Fund for LAs to prepare and
deliver their plans.
Clean Air Fund will provide £220 million for English
LAs to support people and businesses to adapt as
measures to improve air quality are implemented.
9 Consolidating Public Sector Logistics Operations Moving Britain Ahead
February 18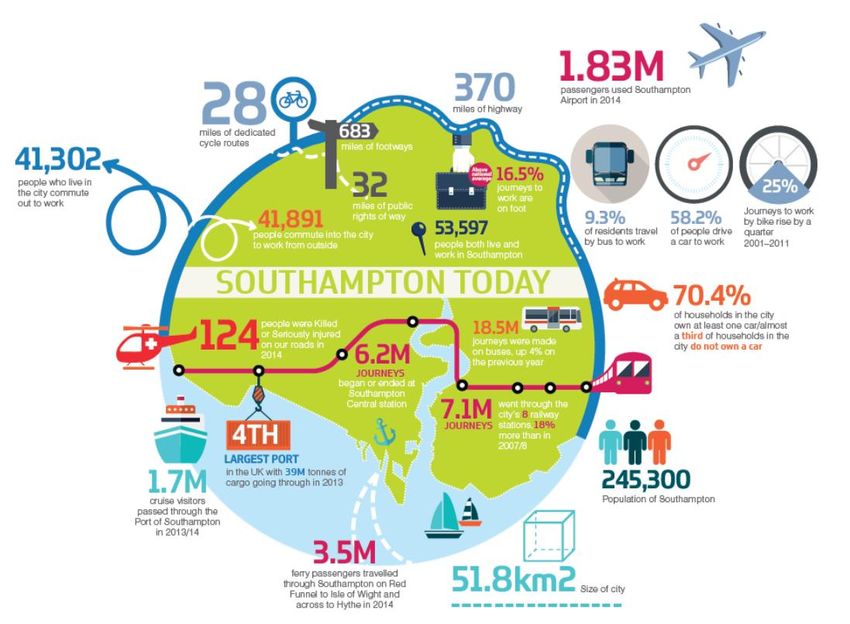
Key Challenges
HGV sector is very diverse: 3.5t - 44t, different duty cycles (e.g. long-haul, urban) and vehicle
types (e.g. RCVs and construction).
Diversity in fleet sizes – ranging from owner operators to major supermarket fleets.
No ‘magic bullet’ – range of measures will be needed.
Zero emission options not yet viable for heavy trucks.
Forthcoming DfT / OLEV Strategy for reducing tailpipe emissions of greenhouse gases and air
pollution from road vehicles.
Will include short, medium and long term measures for HGVs.
Focus on zero emission solutions, including long-term technology options.
Aim to agree voluntary GHG target with industry (including through demand side
measures, alternative fuels and new technologies).
10 Consolidating Public Sector Logistics Operations Moving Britain Ahead
February 18Existing Support
Up to £4m OLEV funding for low emission
vans and HGVs between 3.5 and 44 tonnes
through Plug-in Van Grant.
£20m Low Emission Freight and Logistics
Trial is supporting trials of new technologies
and low and zero emission vehicles in UK
fleets.
£22m funding for a ‘Future Fuels for Flight
and Freight’
Recent consultation on proposals to seek an
EC derogation for Category B driving licence
holders to operate alternatively fuelled
vehicles up to 4.25 (rather than 3.5) tonnes.
Development of Freight Portal with Energy
Saving Trust – credible information on fuel
efficiency measures.
11 Consolidating Public Sector Logistics Operations Moving Britain Ahead
February 18Freight Carbon Review
Gathered evidence on opportunities for and barriers to road freight decarbonisation.
Also focussed on air quality.
Looked at medium-term options (2030s – 5th Carbon Budget), and also considered
longer term options (2050s).
Holistic approach – covering vehicle technologies, fuels, driver behaviour and
operational efficiency.
New research on efficient driving (AECOM) and industry collaboration (TRL).
Found scope to improve the efficiency of freight operations and reduce emissions
through wider industry collaboration if existing barriers can be addressed.
Identified that further work was needed to understand the costs and benefits of
available measures to support wider industry collaboration.
TSC project is gathering further evidence and attempting to address barriers to
freight consolidation.
12 Consolidating Public Sector Logistics Operations Moving Britain Ahead
February 18Next Steps
Today’s presentations will provide a detailed
overview of the project.
Opportunity to test results of the study – outputs
from today will feed into the final report.
Opportunity to share best practice and challenges
- and promote greater awareness of benefits of
UCCs.
Intend to publish outputs of this work later this
year.
Further dissemination of project results via future
workshops and seminars.
Wider discussion will also consider scope for
further work and evidence gathering –
opportunities to explore further application of
approach.
13 Consolidating Public Sector Logistics Operations Moving Britain Ahead
February 18TRANSPORT SYSTEMS CATAPULT
Methodology
TOM GADSBY
Freight & Logistics Specialist
Transport Systems CatapultTSC METHODOLOGY • Literature review to understand why uptake of UCC’s is low
TSC METHODOLOGY

                          Hypothesis:

            Greater visibility of the cost and benefits to
             all stakeholders, but in particular for the
                client organisation, would generate
                           greater interest
CASE STUDY IDENTIFICATION
CASE STUDY IDENTIFICATION
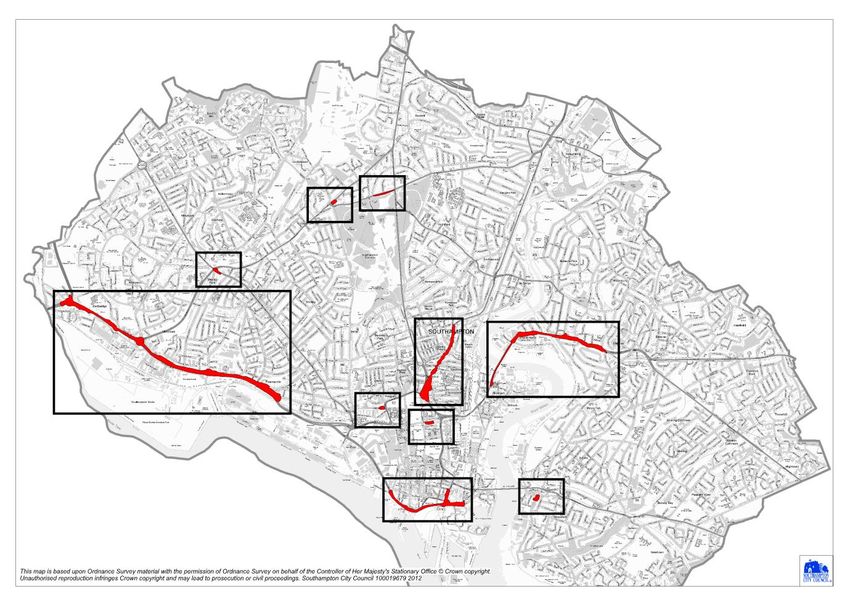
Clean Air Zone
Challenges in Southampton
Air Quality in Southampton

         Close correlation between
         AQMA’s and asthma prevalence
EU Air Quality Directive Exceedance
• Southampton identified in
2015 and 2017 National AQ
plan as exceeding annual mean
NO2 objective
• 1 of 5 worst performing cities
in the UK
• 2017 Revised National AQ Plan
identified an extension of the
exceedance into NFDC.
Highest point of exceedanceSource Apportionment
Western Approach (% of Modelled NOx) (Western Approach AQ Assessment 2014)
Road contribution (%)
Port contribution (%)
Background contribution (%)Source apportionment
HGV’s visiting Southampton
Clean Air Zone
Penalty Charging Classes
Clean Air Zone class                        Vehicles included
          A             Buses, coaches and taxis (including private hire)

          B             Buses, coaches, taxis and heavy goods vehicles (HGVs)
                        Buses, coaches, taxis, HGVs and light goods vehicles
          C
                        (LGVs)
          D             Buses, coaches, taxis, HGVs, LGVs and cars

Clean Air Zone emission standards

Vehicle type                  NOx emissions limit

Bus/coaches                   Euro VI

HGV                           Euro VI
Car/light commercial (up to
                              Euro 6 (diesel) Euro 4 (petrol)
1305kg)
Local Plan Objectives Primary Objective “The overall spending objective of the local plan is to deliver a scheme that leads to compliance with NO2 concentration limits in the shortest possible time.” – JAQU Options Appraisal Guidance Proposed Secondary Objectives • Ongoing improvements to public health • Likelihood of compliance with LAQM (i.e. AQMAs revoked) • Addressing exceedances beyond boundary • Supporting existing measures and sustainable travel communications • Supporting transformation to low emission economy • Affordability
CITYLAB -
City Logistics in Living Laboratories

            Tom Cherrett
      University of Southampton
CITYLAB
• Horizon 2020, Mobility for Growth
• Topic MG-5.2-2014 Reducing impacts and costs
of freight and service trips in urban areas
• Budget 4 Mill Euro
• 1 May 2015 – 30 Apr 2018
• 25 partners, 7 countries
31Objectives
• Improve knowledge and understanding about the
impacts of freight distribution and service trips in
urban areas;
• Implement and test 7 innovative solutions that
reduce the negative impacts of freight vehicles
whilst enhancing business profitability
• Provide a platform to aid the replication and roll
out of the solutions in other cities
Emission free city logistics in urban centres by 2030
32The living labs
LONDON: New distribution hub
concepts and clean vehicles
ROME: Integration of direct
and reverse logistics
BRUSSELS: Increasing load factors
by utilizing free van capacity
ROTTERDAM: Floating depot
PARIS: Logistics hotel
OSLO: Common logistics functions
for shopping centres
SOUTHAMPTON: Joint procurement and
consolidation for large public institutions
33Southampton – consolidation for large public institutions
University hall post consolidation
                             • 162 UK HEIs
                             • 1.75m UGs
                             • 385,000 UGs in halls

• Cities with >1 HEI might
  have > 8000 UGs in halls
• Consolidation estimate
  £17.88/yr/student
Hospital delivery consolidation
• St Mary’s Isle of Wight
• Planned use of SSDC
• Southampton General
Hospital
• Using SSDCExperiences from
University Hospital
Southampton
Chris Meayers-NorkettThe views expressed in this presentation are those of the Author and not necessarily those of the University Hospital of Southampton Foundation Trust
What do we need to do?
Consolidation – External Factors
                               900 vehicles a week to 4 Yards:
                               Catering
                               Clinical Materials (Supplies, Drugs, Equipment)
                               Facilities and Estates
                               Food Retail
                               Waste
                               Pathology
                               Etc.

 Challenges we face:
• Clean Air Zone 2019
• Site Safety
• Patient & Staff experience
• Growth and service expansion
• Local infrastructure - internal and external
• Impact on environment and local residents
• Oversight & competing priorities – DoH FOM, NHS E
  – ZCM , NHS I - Carter, STP, Acute Alliance
Consolidation? – Internal Factors
Staff
Visiting Patient
Core Hours Arriving/Dep Patient Rest Theatre Lists Clinics Waste Dirty Linen
Hours Meals
arting
Receipt and Distribute (per day): 06:00
Over 900 direct items (couriers etc) 07:00
08:00
70 roll cages 09:00
10:00
To 600+ internal Deliver to Locations 11:00
Distribution Operatives walking on average 18 miles a day 12:00
13:00
14:00
15:00
16:00
Challenges we face: 17:00
18:00
19:00
• Systems enablement 20:00
• Corridors and lift capacity
• Internal Storage – point of care only
• Patient Experience
• Internal Culture, awareness and competing
priorities
• Site SafetyIllustration of Non Clinical Support Services
at the POCBenefits and Potential • Creation of a Pull system for the supply chain – optimised sequencing • Significant reduction in Goods Vehicles on site • Significant reduction on environmental impact and impact to local residents • Improved patient experience • Control over the last mile enabling out of hours put away for non inpatient areas • Consolidated deliveries (Supplies, Pharmacy, EBME,) – making every journey count • Consolidated deliveries (Supplies, Pharmacy, EBME,) – ensuring optimised utilisation
Benefits and Potential…. continued

• Enhanced service performance and site safety
• Reduction in waste on site
• Enabling for future growth plans – release of space
• Expansion beyond Supply Chain
• Scalability for collaboration
• Sustainability and Commercialisation?
Meachers Global Logistics
Running a successful Consolidation
Centre

Gary Whittle – Commercial Director
▪   Who are Meachers Global Logistics?
                    ▪   Transport, Warehousing and Freight Forwarding

Introduction        ▪

                    ▪
                        Employ 200 people

                        Turn over 26mill

                    ▪   Been located in Southampton since 1958

               ▪   What is a Sustainable Distribution Centre?
                    ▪   Freight Consolidation

                    ▪   Storage – Long term and Short term

                    ▪   Reworking and Ancillaries

                ‘Freight consolidation involves grouping individual consignments or part-
               loads that are destined for the same locality so that a smaller number of full
                                loads are transported to their destination’

               ▪   What qualifies us to run a SDC?
                    ▪   Shared Warehouse space

                    ▪   Locality

                    ▪   Fleet of appropriate vehicles

                    ▪   Warehouse Management System
Why did Meachers get involved?
▪ Recognition of ongoing issues in the following areas:
▪ Congestion:
▪ In 2007, it was predicted that the level of traffic on
the Southampton road network would increase by
up to 40% by 2026.
▪ Pollution/ Air Quality – Running a full Euro VI Fleet
▪ Commercial Opportunity within Meachers
▪ Geographically and operationally appropriateHow does the current SDC operate?
▪ Freight Consolidation: ▪ Sustainability:
▪ Inbound Shipments ▪ Reduction in Movements/ Congestion.
▪ Reduction in Pollution
▪ Outbound Groupage
▪ Out of Hours Utilisation
▪ Scheduled Collections/
Deliveries - Timed ▪ Consolidated Deliveries
▪ Last mile Logistics/ Pre Solent
Logistics
▪ Storage Requirements:
▪ Short/ Medium/ Long Term
▪ Rework/ Out of Gauge/ Inventory
Management
▪ Shared user/Multi FunctionalParticular benefits for public sector?
▪ Time saved through framework agreement as procurement
already taken place for any public body in a 20 mile radius of the
SDC
▪ Opportunity for savings through joint procurement (bulk buying)
▪ Potential savings through variable rates (only pay for what you
use on a weekly basis)
▪ Factory Gate Pricing becomes possible
▪ By reducing the need for council properties
▪ Demonstrate that you are trying to improve economy and
environment at the same timeHow successful has it been so far?
▪ 83,000 vehicle movements off the roads per
year
▪ 33,424,930g/km emissions total annual saving
▪ £701,116 Operational cost savings for
suppliers
▪ £5,255,030 potential saving in clean air zone
penalty fees when introduced
* Internal and Independent Research completed by Catapult Transport SystemsSo why has it worked so well in Southampton?
▪ Multi User:
▪ The SDC is now being used by:
▪ Southampton City Council Corporate
▪ Records Management
▪ Southampton Hospital
▪ Solent GO
▪ New Forest District Council
▪ Solent University
▪ Southampton University
▪ Range of Private companies
▪ Range of services
▪ Political Support – Early adopters
▪ Specific Geographic issues
▪ High Public Sector densityFuture projection based on current evidence
▪ The SDC is currently reducing the number of
HGV travelling into Southampton City Centre
by a minimum of 83,000 vehicle movements
per annum (based on the current data) – We
hope to increase this
▪ The SDC will reduce Southampton’s Carbon
footprint by up to 75% and decrease the output
of other harmful gases caused by HGVs –
totaling 33,424,930g/km omissions per annum
(based on current data)
▪ The SDC will also reduce general congestion in
and around the city especially the port areaChallenges faced and lessons learned
▪ Public sector lead times and
existing contracts
▪ Clear and concise
procurement message
▪ Identifying triggers for end
user
▪ Public and Private sector
commercial activity
▪ Flexible business modelTSC RESEARCH AND RESULTS MANUEL MARTINEZ Transport Economist Transport Systems Catapult
THE BUSINESS CASE – ECONOMIC MODELLING
DATA IDENTIFICATION & COLLECTION

The Freight Economicmodel was calibrated for the UHS case study
using mainly the following datasets:

Additional Costs
  o Meachers’ Fleet & Admin Operating Costs data
Operating Savings & Opportunity Cost
  o RHA Freight Costs
  o UHS Delivery and Servicing Plan (DSP) data
  o Automatic Number Plate Recognition (ANPR) Traffic Data
  o UHS Business as usual internaloperations
Wider Benefits
  o Sub-Regional Transport Model (SRTM)
PROVISIONAL RESULTS – BASE YEAR
Total Present Values (£ p/a)                                                                       Low           Central         High

                                                                           Freight Operator
                                                                               (Running
  Additional Costs
                                                                            Consolidation
                                                                                               -£ 468,870 -£     520,967 -£      573,063
                                                                                Model)

                                                                            Freight Industry
                                                                           (Operating Costs)
                                                                                               £   157,698   £    175,220    £   192,742

                                                                           Freight Industry
Operating Savings                                                           (Penalty Fees)
                                                                                               £   791,072   £   988,840     £ 1,186,608

                                                                       University Hospital
                                                                         Southampton           £   458,594   £   509,548     £   560,503
                                                                       (Opportunity Cost)

                                                                       Improved Journey
                                                                           Times -
                                                                         Decongestion
                                                                                               £   221,081   £    245,327    £   270,665
                                                                          Benefits (*)

                                                                            Environmental
                                                                             Benefits (**)
                                                                                               £     2,792   £       5,017   £     7,898

   Wider Benefits

                                                                      Accidents reduction      £ 2,247,781   £ 2,497,534     £ 2,747,288
                                                                                  (*)

                                                                       Other 'Soft' Social
                                                                      Benefits (Reduction
                                                                        Sick days incl.
                                                                                               £    37,341   £     41,490    £    45,639
                                                                            stress)
(*) Southampton Wide Area covered by Sub Regional Transport Model (SRTM)
(**) Include CO2, NOx and Noise quantification
PROVISIONAL RESULTS - FORECAST (2017 - 2030)
Total Present Values (£ p/a) 2017 2030
Freight Operator
(Running
Additional Costs
Consolidation
-£ 520,967 -£ 946,677
Model)
Freight Industry
(Operating Costs)
£ 175,220 £ 503,960
Freight Industry
Operating Savings (Penalty Fees)
£ 988,840 £ 19,662
University Hospital
Southampton £ 509,548 £ 958,074
(Opportunity Cost)
Improved Journey
Times -
Decongestion
£ 245,327 £ 201,354
Benefits (*)
Environmental
Benefits (**)
£ 5,017 £ 6,239
Wider Benefits
Accidents reduction £ 2,497,534 £1,400,328
(*)
Other 'Soft' Social
Benefits (Reduction
Sick days incl.
£ 41,490 £ 69,103
stress)
(*) Southampton Wide Area covered by Sub Regional Transport Model (SRTM)
(**) Include CO2, NOx and Noise quantificationECONOMIC FORECAST – UHS CAPACITY CONSTRAINTS
RESULTS DISCUSSION

DR ANDREW TRAILL
Principal Technologist – Freight & Logistics
Transport Systems Catapult
DISCUSSION

1. Feedback on methodology

2. Feedback on results

3. Potential next steps:
   o Carry out more case studies to test model further on different
     organisations and in different locations?
   o Provide organisations with economic modelling tool along with
     user guide so they can undertake analysis themselves?
   o Further research to look at collaborative procurement and the
     use of this model within collaborative procurement?
You can also read