Avinor AS Debt Investor Presentation - April 2015
←
→
Page content transcription
If your browser does not render page correctly, please read the page content below
Avinor AS
Debt Investor Presentation
April 2015
Petter Johannessen, CFO
Agenda

1. Avinor in brief

2. Group performance overview

3. Business segments

4. Financial review and strategy

Appendix

 Page 1

Avinor’s mission
- To develop and operate a safe, effective and sustainable aviation system
in Norway
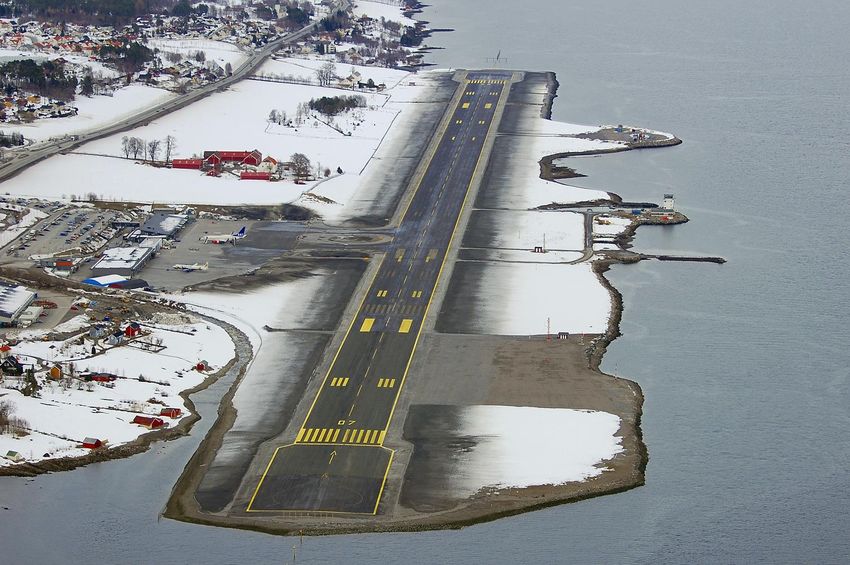
Molde airport, Årø
Page 2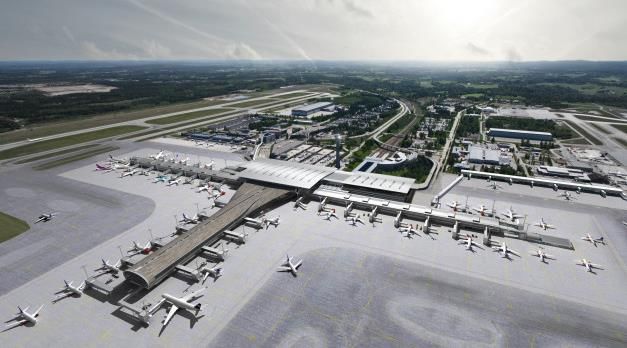
Key credit highlights

1. The main airport operator and air navigation service provider in Norway with near
monopoly position

2. 100% government ownership (covenant) & strategic importance to Norway

3. Supportive regulatory environment

4. Well-diversified revenue base from operations

5. Diversified portfolio of 46 airports under full ownership with Oslo as major hub

6. Solid long term growth prospects

7. Resilient margins with high cash conversion rates

8. Conservative capital structure & stable ratings from S&P and Moody´s (AA-/A1)

  Page 3
Key developments since the previous EUR bond issue
in March 2014
• An early stage of a cost efficiency programme to meet the structural changes in the
aviation industry
• Restructuring of the legal structure of the Avinor group
Established new legal entities Avinor Flysikring AS (Air Navigation Services) and
Avinor Utvikling AS (Real estate holding company)
• In process of selling of Radisson Blu hotel at Oslo Airport, to strengthen equity for the
Avinor group while building a new terminal at Bergen airport
• Avinor has again been appointed as the operator of Norwegian national en route
traffic control services until 2024 and tower and approach control services until 2017
• Issued 7 year EUR bond and 5 year NOK FRN bond in 2014. Planning to issue 10
year EUR bonds in 2015, and to revert to the EUR market in 2016
Page 4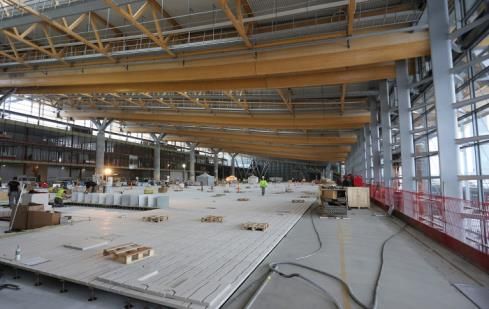
The importance of Avinor
Availability:                                               Importance to commerce:
•     Two out of three Norwegians have access to an         •   Great importance for business travel and transport of
      airport within an hour's travel                           time-critical goods and high-value spare parts
•     99.5% of the population can visit Oslo and return     •   Over 200 direct connections between Avinor's airports
      home the same day                                         and abroad
•     Due to the layout of the country and the              •   Direct intercontinental travel is expected to triple in the
      geographical dispersion of the population, flights        next 10 years
      is of great importance to regional growth and
      accessibility to regional centres                     Tourism:
Employment:                                                 •   Of all tourists who visit Norway, 34% arrive by air, which
                                                                is the form of transport that is increasing the most
•     Aviation provides approx. 60,000 jobs
                                                            •   Spending by air tourists in Norway amounts to around
•     Its importance is particularly great in non-urban
                                                                NOK 14bn
      areas
•     Overall, the impact of aviation is equivalent to      Transport of patients:
      approx. 2% of Norway’s GDP
                                                            •   Around 325,000 patients are transported on scheduled
                                                                flights each year. Aviation’s importance to the health
Importance to the oil and gas sector:                           sector is greatest in Northern Norway
•     13% of all domestic flights are connected with this   •   More than 30,000 ambulance aircraft movements
      sector                                                    annually
•     50,000 helicopter trips and 700,000 passengers        •   Assisted travel (for passengers with reduced mobility,
      annually to the installations on the continental          etc.) covers approx. 170,000 trips annually
      shelf

    Page 5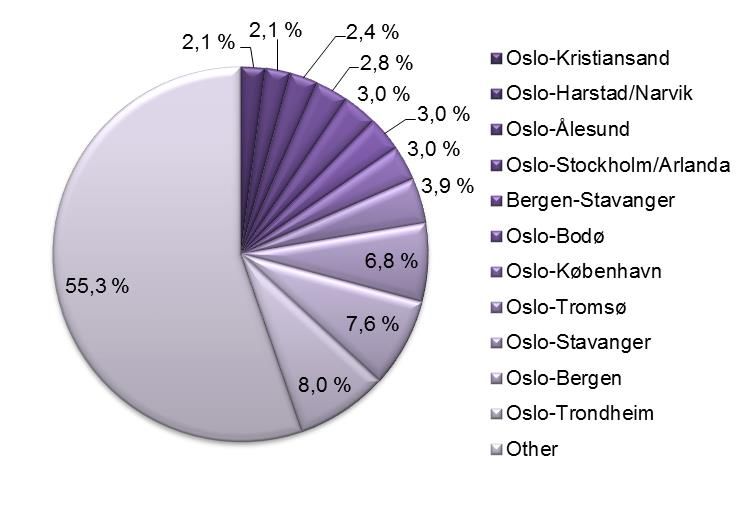
Government ownership and strategic importance to
Norwegian infrastructure
     Category 1:                            Category 2:                           Category 3:                          Category 4:
  Commercial objectives                 Commercial objectives                 Commercial and other                Regulatory and political
                                           and domestic                        defined objectives                       objectives
                                           headquarter
         Baneservice                                DNB                            Eksportkreditt
              Entra                             Kongsberg                                NSB                             Norsk Tipping
              SAS                             Norsk Hydro                               Posten                                 NRK
            Flytoget                               Statoil                             Statkraft                              Petoro
             Mesta                                Telenor                                                                    Statnett
                                                    Yara                                                                    Statskog
                                                                                                                         Vinmonopolet

                                          Importance of «government related entity»
A Category 4 company* fulfils national sectorial political objectives. The Norwegian government sets guidelines for a number of
conditions, including airport structure, emergency preparedness, aviation fees and duties imposed by society.

* Norsk Tipping (state lottery); NRK (national broadcaster); Petoro (government ownership in oilfields); Statnett (grid owner); Statskog
(forestry); Vinmonopolet (wholly owned by the state and has a monopoly of sale of wine, spirits and strong beer)

  Page 6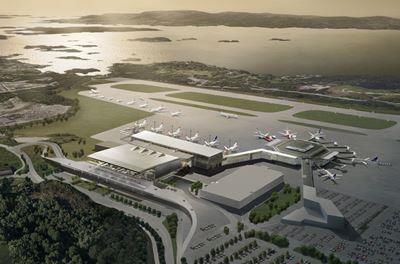
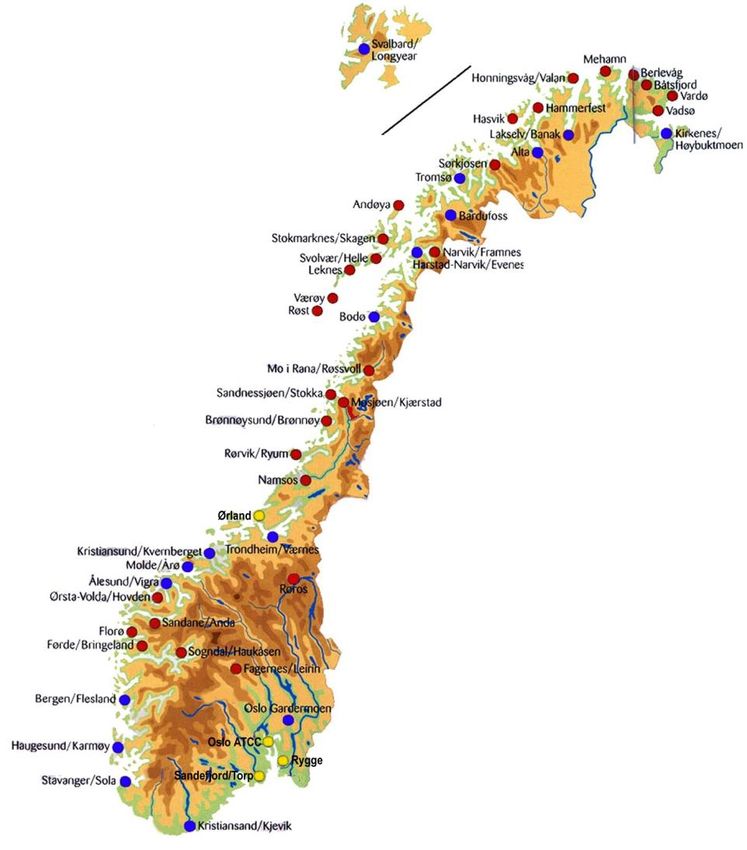
Aviation in Norway
Norwegian air traffic per capita is five times higher than the European average

•     2,650 km mainland coast line
•     Avinor operates 46 airports in Norway
•     3 air traffic control centres for civil and military
      aviation
•     50.1 million passengers annually
•     0.85 million aircraft movements annually
•     > 30,000 air ambulance and medical assistance
      movements annually
•     > 0.7 million passengers to offshore oil and gas
      installations per year
•     Extensive air cargo operations supporting key
      industries (e.g. seafood export)
•     Avinor market share in Norway 2014:
       •     97% of domestic passengers
       •     86% of international passengers
                                                                    •   Short runway
                                                                    •   Long runway
                                                                    •   Tower and Air Traffic Control
                                                                        Center

    Page 7
Group legal structure

                                                         Avinor AS

Avinor Flysikring                      Hell Eiendom     Flesland     Værnes     Sola Eiendom         Avinors         Avinor Utvikling
                    Oslo Lufthavn AS
       AS                                   AS        Eiendom AS   Eiendom AS        AS        Parkeringsanlegg AS         AS

                                                                                                                         Hotell Østre AS

                                                                                                                          Hotell Østre
  •      The Group’s parent company is Avinor AS with eight 100% directly owned                                         Tomteselskap AS
         subsidiaries
  •      The real estate companies (outlined in green) are single purpose companies formed                               Hotell Vestre AS

         for the purpose of owning and financing real estate. These companies were created
         with their own financing structure and have no employees                                                         Hotell Vestre
                                                                                                                          Tomteselskap
  •      The legal structure is mainly applied for following up financial and tax related                                     AS

         matters. Establishing Avinor Flysikring AS prepares the Group for new regulations
                                                                                                                           Flyporten AS
         related to Single European Sky and for competition related to Air Navigation Services
  •      All new debt is raised by Avinor AS
                                                                                                                           Flyporten
                                                                                                                        Tomteselskap AS

      Page 8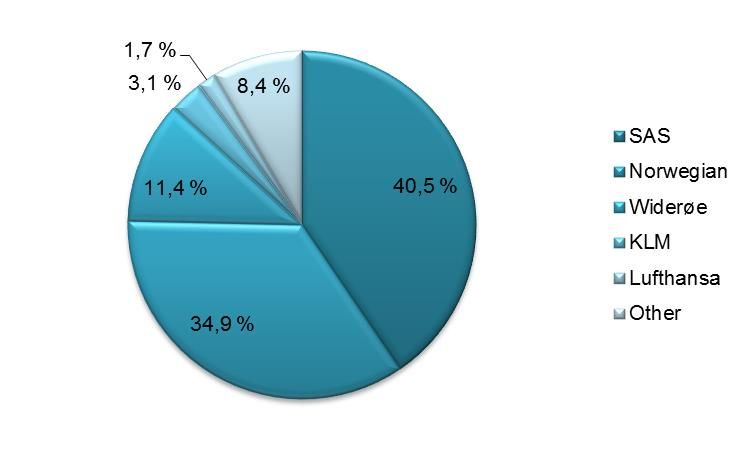
Agenda

1. Avinor in brief

2. Group performance overview

3. Business segments

4. Financial review and strategy

Appendix

 Page 9
Strong revenue growth over the last 6 years

                                    Drivers of Revenue Growth 2009 – 2014 (MNOK)

12 000                                                                                         2 103
10 000
             7 356                                                               615
                                          461          182           180
 8 000
                           226
 6 000                                                                                                     10 671

 4 000
 2 000
    -
         Revenues 2009   Take-off      Passenger   Route charges   Security    Terminal     Sales- and Revenues 2014
                         charges        charges                    charges    navigation   Rental income
                                                                               charges

 Page 10
Well-diversified revenue base from operations
• Balanced portion of regulated vs.
Revenue Distribution 2014
commercial revenues: Avinor has a
diversified revenue base as traffic income
through aviation charges only accounted for
49,7% of revenue in 2014, a small
Takeoff
decrease of 0,3% from 2013 charges
11,2%
Terminal
• Diversified other income: The balance charges
comprises the facilities and services 12%
provided at the airports to passengers and Commercial En route
others and stems from commercial Income charges
50,3% 9,5%
activities such as car parking and hotel
operations, leasing of commercial areas Security
charges
and tax-free shops and restaurants 11%
Terminal
navigation
charges
6%
Page 11Strong passenger growth
68 000 000
58 000 000
48 000 000
38 000 000
28 000 000
18 000 000
8 000 000
Passenger 2014e Passenger 2015e
* 1981 - 2014: Official figures from Avinor
* 2015 - 2030: Forecast from Avinor / Institute of Transport Economics (“TØI”)
Page 12Agenda 1. Avinor in brief 2. Group performance overview 3. Business segments 4. Financial review and strategy Appendix Page 13
Avinor is a critical enabler for successful operation of
    Norwegian aviation

                                                 PASSENGER
                                       Time, information, customer service

                                                   Landside facilities
                                                   and security
      Ground transport                                                                             Airlines operators
      and services
                                                   Check-in and
                                                   baggage handling*
  Capacity, frequency, costs               Customer service, quality

                                Airline                                         Ground                  Airside
                                                                                                       facilities         Air traffic
                               operator                                         handling                                 management
                                                                                                      and safety

            Ground                                  Airport                          Safety, capacity, cost efficiency
            handling                               operator
                                                                                                         Scope of Avinor

                                 Air
                              navigation
* Avinor provides some infrastructure such as Common-Use Self Service (CUSS) terminals and baggage self scan equipment

      Page 14
Airport operations
Service areas:
• Airside operations
• Landside operations and security
• Commercial services
Revenue drivers:
• Number of passengers
• Aircraft movements / take-off weight
• Commercial penetration
Cost drivers:
• Safety requirements
• Security requirements
• Operating hours
Page 15Operating performance of Avinor airports
Evolution of EBITDA (MNOK)
37,2% 36,6% 36,9% 36,6% 37,9%
35,1%
3 620
3 250
3 050
2 839
2 596
2 316
2 769 2 833 2 885
2 530 2 597
2 326
916 981 1 145 1 193 1 396 1 612
-927 -916 -902 -913 -936 -878
2009 2010 2011 2012 2013 2014
Total Airports OSL Large Airports National, Regional and Local Airports EBITDA Margin
• The very strong performance of OSL and other Large Airports allows to fund the
deficit of smaller airports and support the system and societal objectives of the
government
• Overall performance has improved demonstrating the robustness of the system
Page 16Split of traffic income reflects large share of domestic
business and demonstrates limited reliance on specific
routes and airlines
Split of traffic income by airline (2014)
• Top 5 airline customers are SAS, Norwegian, Widerøe,
KLM and Lufthansa and contributed to 81% of 2014
traffic income revenues on scheduled route and charter
flights
• SAS alone represents approx. 40% of traffic income (up
from 36% for 2013) and Norwegian represents approx.
35% of passenger traffic in 2014 (down from 38.8% in
2013)
• Commercially, all customers are treated equally when
considering the charges and incentives programmes
• Domestic passengers represented 42.6% of total Split of traffic income by route (2014)
passengers at OSL in 2014 (down from 45% in 2013)
• The key catchment area of Avinor’s network of airports
is the entire Norwegian territory, although Oslo region
represents the most important catchment area. The
population of Norway is forecasted to increase by 5%
between 2013 and 2017 from 5.05m to 5.3m which will
support air travel demand*
• Our main route accounted for only 8% of our traffic
income for passenger flights in 2014 and top 10 routes
accounted for 42.6%
*source: Statistics Norway («SSB»)
Page 17Air Navigation Services (ANS)
Service areas:
• En route
• Approach/Tower
• Communications, navigation and surveillance (CNS)
Revenue drivers:
• En route service units
(flown distance / aircraft weight)
• Aircraft movements
Cost drivers:
• Safety requirements
• Capacity requirements
• Operating hours
Page 18High share of origin & destination traffic supports
credit quality
Evolution of O&D share of passengers in Avinor airports
• O&D represented 84% of total passengers in 2014
• For international passengers, the proportion of transfers averaged only 12% over the past 5 years
• Avinor is less dependent on transfer traffic than other traffic airport operators
• Strong domestic demand for air transport
• Avinor is well positioned to take market share in transfer due to growth potential in international traffic
Page 19Commercial operations
Almost 50% of Avinor’s revenue comes from
commercial operations.
• Duty Free sale is the most important revenue driver
The Group has established a real estate portfolio
of hotels and car parks that are organised as
wholly owned SPV’s.
• The Real estate companies develop and build airport
hotels
• The operation is outsourced to external operators such as
Choice, Rezidor and Scandic
• There is considerable potential for further development of
real estate surrounding the largest airports
• Process initiated to sell the “Radisson Blu Airport hotel” at
Oslo Airport, Gardermoen
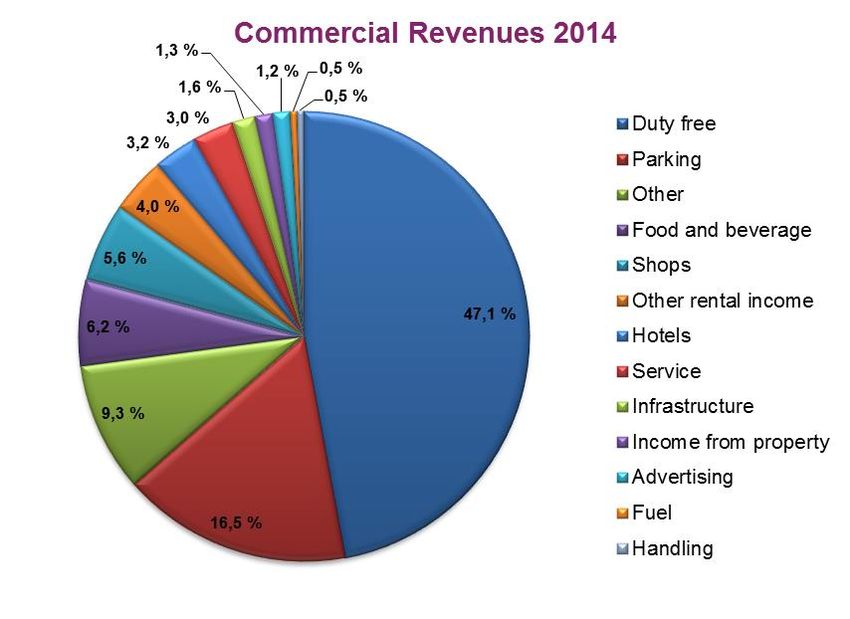
Page 20Commercial revenues are a key source of existing
revenues and future growth
Commercial Revenues (MNOK) 2013 2014 2015
Advertising 60.9 66.3 8,9 %
Duty free 2 342.7 2 526.1 7,8 %
Food and beverage 313.9 331.1 5,5 %
Fuel 20.0 25.6 28,0 %
Handling 26.4 25.1 -4,9 %
Hotels 190.3 170.0 -10,7 %
Income from property 62.4 69.7 11,7 %
Infrastructure 90.9 87.4 -3,9 %
Parking 813.4 884.0 8,7 %
Service 148.4 159.4 7,4 %
Shops 276.1 302.9 9,7 %
Other rental income 176.1 215.9 22,6 %
Other 471.5 501.5 6,4 %
Total 4 939.0 5 365.0 7,5
• Commercial revenues offer the highest potential growth rates for Avinor
• Due to high taxes on items such as cigarettes and alcohol in Norway, there is a strong incentive
to purchase duty free goods upon leaving and arriving in the country via Avinor airports
Page 21Agenda 1. Avinor in brief 2. Group performance overview 3. Business segments 4. Financial review and strategy Appendix Page 22
Historical summary of income statement
MNOK                            2009      2010      2011      2012      2013       2014

Total operating income        7,355.5   7,870.8   8,621.8   9,152.1   9,977.6   10,671.0

Operating expense             6,163.7   5.072,1   5,841,9   6,233,9   6,984.6    7,022.8

Changes in values and other      -8.4     36.2      -35.8     -20.3       0.1       -2.8
losses/gains, net
Operating profit              1,183.4   1,744.8   1,485.4   1,562.2   1,619.6    2,305.3

EBITDA                        2,183.3   2,798.6   2,779.9   2,918.2   2,993.0    3,648.3

EBITDA margin                  29.7%     35.6%     32.2%     31.9%     30.0%      34.2%

Net finance costs              324.5     325.6     295.0     355.9     346.0      368.6

Profit before income tax       858.9    1,419.2   1,190.4   1,206.3   1,273.6    1,936.7

Income tax expense             254.0     411.1     346.8     351.6     382.7      538.0

Profit for the year            604.9    1,008.1    843.6     854.7     890.9     1,398.7

  Page 23
Resilient margins with high cash conversion rates
      •       Avinor’s margins have proven very resilient through the cycle, despite the global
              financial crisis and the ash cloud air traffic disruption

      •       The cash conversion rate* has also historically been very high at an average 94%
              over the last 6 years

     Cash                                                                                                          87%
conversion
      rate                                                                       88%               95%          3 648
                                     85%                  104%
                104%                                                                                                    3 165
                                                                             2 918              2 993
                                 2 799                 2 778   2 844                                    2 850
                                                                                     2 582
                                         2 404
             2 183   2 276
                                    35,6%                                                                          34,2%
   MNOK

                                                          32,2%                 31,9%
                29,7%                                                                              30,0%

                2009                2010                  2011                  2012               2013            2014
                                                  EBITDA               OCF      EBITDA Margin
           *OCF (cash flow from operations) / EBITDA
          Page 24
Historical summary of balance sheet 2009 - 2014
MNOK 2010 2011 2012 2013 2014 MNOK 2010 2011 2012 2013 2014
Assets Equity and
liabilities
Total intangible 2,090.3 2,473.0 2,577,4 2,068.4 2,053.9
Total equity 10,999.0 10,414.3 10,356.7 11,969.4 12,222.6
assets
Total property, plant 18,706.3 20,060.5 22,854.2 25,578.7 28,954.5 Total provisions 1,941.7 3,276.6 4,065,3 2,600.8 3,050.3
and equipment
Total non-current 8,207.5 9,096.5 10,109.8 11,102.7 14,067.0
liabilities
Total financial 29.4 74.3 101.9 138.3 350.8
assets of which debt 8,131.0 8,978.2 9,967.0 10,989.4 13,938.5
Total non-current 20,826.0 22,607.8 25,533.5 27,785.4 31,359.2 Total Current 2,326.6 3,061.1 3,577.4 4,232,7 4,396.6
assets liabilities
Cash and cash 1,570.4 2,109.7 1,315.7 673,7 932.0 of which debt 513.5 774.5 1,220.9 1,745,5 1,351,9
equivalents
Total liabilities 12,475.8 15,434.2 17,752.5 17,941.6 21,513,9
Total current assets 2,648.8 3,240.7 2,575.7 2,125.6 2,377.3
Total equity and 23,474.8 25,848.5 28,109.2 29,911.0 33,736.5
Total assets 23,474.8 25,848.5 28,109,2 29,911.0 33,736.5 liabilities
Page 25Investments
Average of NOK 4.5 billion per year up to 2030
Page 26Avinor’s main investments
Largest ongoing project:
Extended terminal capacity at Oslo Airport
Scheduled for completion 27 April 2017
Allocated funds: NOK 14bn ex finance cost, includes CAPEX and
OPEX for the project
Bergen Airport, Flesland, new terminal
Scheduled for completion within 2017
Allocated funds: NOK 4.7bn ex finance cost, includes CAPEX and
OPEX for the project
Both projects are on schedule in terms of progress and budget.
Page 27Debt maturity profile (per 31.12.2014 excluding commercial paper)
MNOK
• Avinor’s loans are unsecured with negative pledge and 100% change of
control clause
• Liquidity reserve > 12 month funding needs
Page 28Funding strategy
Long term funding preferred. Available sources of funding include:
• Eurobonds
• Norwegian bond market
• Commercial paper (with credit facilities as backstop)
• Nordic Investment Bank, European Investment Bank
• Bank loans (mainly for project companies)
• Other bond markets
• US Private Placement
• Capital injection from owner
• Drawdown on credit facilities
2015-2019: approximately NOK 12 bn funding needed, assuming:
• Re-financing of maturing debt NOK 5.5 bn (including NOK 1.2bn commercial paper)
• Yearly dividends not to exceed NOK 500 million for 2015 - 2018
• Realisation of approved projects as well as a number of currently non-approved projects
• Sale of Radisson Blu Airport Hotel at Oslo Airport is in process
Page 29Summary Leading airport operator and air navigation service Diversified portfolio of airports under full ownership provider in Norway with near monopoly position with Oslo as major hub Government ownership and strategic importance to the infrastructure of Norway Solid long term growth prospects Supportive regulatory environment Resilient margins with high cash conversion rates Well-diversified revenue base Conservative capital structure Strong cash flow generation from recurring revenue model, long-term customer relationships and substantial passenger growth opportunity Ample liquidity and comfortable covenant headroom Commitment to prudent financial policies and reasonable leverage Substantial deleveraging over the long-term plan horizon Long-term investments to support Norway’s sustainable development and serve Norwegian society Page 30
Agenda

1. Avinor in brief

2. Group performance overview

3. Business segments

4. Financial review and strategy

Appendix

 Page 31
Supportive regulatory environment
Regulatory and industrial objectives                                     Shareholder policies and objectives

          Ministry of Transport and Communications                                      Ministry of Transport and Communications

                                                           Alignment of
                                                         Shareholder and
                                                        Regulator objectives

•   A portion of revenues is regulated: The Ministry determines special duties imposed on the Group by society,
    the required rate of return and dividends. In addition, the Ministry of Transport and Communications (i.e. the State)
    regulates the aviation fees on an annual basis
      •    “Regulations Relating to Charges at Avinor AS’s airports” regulate airport charges
      •    “Regulations Relating to Charges for Air Navigation Services Provided by Avinor AS” regulate En Route and Terminal Navigation
           charges. This regulation implements an EU Regulation (1794/2006)
•   Avinor is regulated using a “Single till” approach (all commercial income is used to keep air traffic charges low)

Page 32
Shareholder financial policy and objectives
St.meld.nr.36 St.meld.nr.15 St.meld.nr.48 St.meld.nr.38
Objective
(2003-2004) (2006-2007) (2008-2009) (2012-2013)
Return on average capital
7.0% 6.45% 7.6% 6.1%
employed after tax
Return on equity after tax 10.3% 9.7% 10.4% 9.5%
Dividend policy Risk free interest Risk free interest 50% of group net 50% of group
rate times market rate times equity income net income**
equity value, value, limited to
limited to 40% of 75% of group net
parent company income
net income
Equity ratio* Min 40% Min 40% Min 40% Min 40%
Interest bearing debt Max NOK 10.5bn Max NOK 10.5bn No limitation No limitation
NOK 8.3bn NOK 8.3bn NOK 10.3bn
Market equity value Not valued
(Deloitte) (Ernst & Young) (Ernst & Young)
* Equity / Equity + interest bearing debt, ref. article 11 in company by-laws
** Dividends later capped by Government at 0,5 bn yearly for fiscal years 2014-2017 (with cash effect 2015-2018) to allow Avinor
to retain more funds while investing in new capacity both at Bergen and Oslo airports
Page 33Disclaimer Avinor AS has exercised utmost care in compiling and editing the contents of this document. Nevertheless it is possible that some information is incorrect or incomplete. Avinor AS accepts no responsibility for any consequences, including interpretation and or use of the provided information. Avinor AS gives no guarantee regarding the content of this document. Page 34
You can also read