2Q22 Investor Presentation - July 19, 2022 - SEC.gov

Page created by Patrick Fuller
 
CONTINUE READING
2Q22 Investor Presentation - July 19, 2022 - SEC.gov
2Q22 Investor Presentation
       July 19, 2022
2Q22 Investor Presentation - July 19, 2022 - SEC.gov
Important Information For Shareholders and Investors
This presentation contains information related to a proposed merger of United Community Banks, Inc. ("United") with Progress Financial Corporation
             . In connection with the proposed merger, United has filed with the Securities and Exchange Commission           a registration statement on Form
S-4 that includes the proxy statement of Progress to be sent to             shareholders seeking their approval of the merger. The registration statement also
contains a prospectus of United to register the shares of United common stock to be issued in connection with the merger. A definitive proxy
statement/prospectus will also be provided to            shareholders as required by applicable law. INVESTORS AND SHAREHOLDERS OF PROGRESS
ARE ENCOURAGED TO READ THE APPLICABLE REGISTRATION STATEMENT, INCLUDING THE DEFINITIVE PROXY STATEMENT/PROSPECTUS
THAT IS A PART OF THE REGISTRATION STATEMENT AND ANY OTHER RELEVANT DOCUMENTS FILED BY UNITED WITH THE SEC, INCLUDING
ANY AMENDMENTS OR SUPPLEMENTS TO THE REGISTRATION STATEMENT AND THOSE OTHER DOCUMENTS, BECAUSE THEY CONTAIN
IMPORTANT INFORMATION ABOUT UNITED, PROGRESS AND THE PROPOSED TRANSACTION.

The registration statement and other documents filed with the SEC may be obtained for free at the       website (www.sec.gov). You may also obtain these
documents, free of charge, from United at the                    section of          website at www.UCBI.com or from Progress at the
section of           website at www.myprogressbank.com. Copies of the definitive proxy statement/prospectus are also available, free of charge, by contacting
United Community Banks, Inc., P.O. Box 398, Blairsville, GA 30514, Attn: Jefferson Harralson, Telephone: (864) 240-6208 and Progress Financial Corp., 201
Williams Avenue, Huntsville, Alabama 35801, Attn: Dabsey Maxwell, Telephone: (256) 319-3641.

This communication does not constitute an offer to sell, the solicitation of an offer to sell or the solicitation of an offer to buy securities, nor shall there be any
sale of securities in any jurisdiction in which such offer, solicitation or sale would be unlawful prior to registration or qualification under the securities laws of such
jurisdiction. This communication is also not a solicitation of any vote or approval with respect to the proposed transaction or otherwise.

PARTICIPANTS IN THE SOLICITATION
Progress and UCBI and certain of their respective directors and executive officers, under the rules of the SEC, may be deemed to be participants in the
solicitation of proxies from Progress shareholders in favor of the approval of the Merger. Information about the directors and officers of UCBI and their ownership
of UCBI common stock can also be found in             definitive proxy statement in connection with its 2022 annual meeting of shareholders, as filed with the SEC
on April 6, 2022, and other documents subsequently filed by UCBI with the SEC. Information about the directors and executive officers of Progress and their
ownership of Progress capital stock, as well as information regarding the interests of other persons who may be deemed participants in the transaction, may be
obtained by reading the proxy statement/prospectus regarding the Merger with Progress. Additional information regarding the interests of these participants is
also included in the proxy statement/prospectus pertaining to the Merger. Free copies of this document may be obtained as described above.

                                                                                                                                                                          2
2Q22 Investor Presentation - July 19, 2022 - SEC.gov
Disclosures
CAUTIONARY STATEMENT
This communication contains              -looking            within the meaning of Section 27A of the Securities Act of 1933, as amended, and Section 21E of the
Securities Exchange Act of 1934, as amended. In general, forward-looking statements usually may be identified through use of words such as
                                                                                             and            or the negative of these terms or other comparable
terminology, and include statements related to the expected timing of the closing of the merger with Progress (the                   the expected returns and other
benefits of the merger to shareholders, expected improvement in operating efficiency resulting from the merger, estimated expense reductions resulting from the
transaction and the timing of achievement of such reductions, the impact on and timing of the recovery of the impact on tangible book value, and the effect of the
merger on             capital ratios. Forward-looking statements are not historical facts and represent                 beliefs, based upon information available at
the time the statements are made, with regard to the matters                     they are not guarantees of future performance. Actual results may prove to be
materially different from the results expressed or implied by the forward-looking statements. Forward-looking statements are subject to numerous assumptions,
risks and uncertainties that change over time and could cause actual results or financial condition to differ materially from those expressed in or implied by such
statements.

Factors that could cause or contribute to such differences include, but are not limited to (1) the risk that the cost savings from the merger may not be realized or
take longer than anticipated to be realized, (2) disruption from the merger with customer, supplier, employee or other business partner relationships, (3) the
occurrence of any event, change or other circumstances that could give rise to the termination of the merger agreement, (4) the failure to obtain the necessary
approval by the shareholders of Progress, (5) the possibility that the costs, fees, expenses and charges related to the merger may be greater than anticipated,
(6) the ability by United to obtain required governmental approvals of the merger, (7) reputational risk and the reaction of the                   customers, suppliers,
employees or other business partners to the merger, (8) the failure of the closing conditions in the merger agreement with Progress to be satisfied, or any
unexpected delay in closing the merger, (9) the risks relating to the integration of             operations into the operations of United, including the risk that such
integration will be materially delayed or will be more costly or difficult than expected, (10) the risk of potential litigation or regulatory action related to mergers,
(11) the risks associated with           pursuit of future acquisitions, (12) the risk of expansion into new geographic or product markets, (13) the dilution caused
by            issuance of additional shares of its common stock in mergers, and (14) general competitive, economic, political and market conditions. Further
information regarding additional factors which could affect the forward-looking statements can be found in the cautionary language included under the headings
              Note Regarding Forward-Looking                  and                   in         Annual Report on Form 10-K for the year ended December 31, 2021,
and other documents subsequently filed by United with the SEC.

Many of these factors are beyond              and         ability to control or predict. If one or more events related to these or other risks or uncertainties
materialize, or if the underlying assumptions prove to be incorrect, actual results may differ materially from the forward-looking statements. Accordingly,
shareholders and investors should not place undue reliance on any such forward-looking statements. Any forward-looking statement speaks only as of the date
of this communication, and United undertakes no obligation to update or revise any forward-looking statements, whether as a result of new information, future
events or otherwise, except as required by law. New risks and uncertainties may emerge from time to time, and it is not possible for United to predict their
occurrence or how they will affect United or Progress.

United qualifies all forward-looking statements by these cautionary statements.

                                                                                                                                                                       3
2Q22 Investor Presentation - July 19, 2022 - SEC.gov
Disclosures
NON-GAAP MEASURES
This Investor Presentation includes financial information determined by methods other than in accordance with generally accepted accounting principles
          . This financial information includes certain operating performance measures, which exclude merger-related and other charges that are not considered
part of recurring operations. Such measures include:                  per share                    earnings per share                          book value per
                  on common equity                          on tangible common equity                      on assets operating             on assets pre-tax
pre-provision, excluding merger-related and other                Efficiency ratio                     ratio operating, excluding PPP fees and MSR
              operating and               common equity to tangible assets.

Management has included these non-GAAP measures because it believes these measures may provide useful supplemental information for evaluating
underlying performance trends. Further, management uses these measures in managing and evaluating               business and intends to refer to them in
discussions about our operations and performance. Operating performance measures should be viewed in addition to, and not as an alternative to or substitute
for, measures determined in accordance with GAAP, and are not necessarily comparable to non-GAAP measures that may be presented by other companies.
To the extent applicable, reconciliations of these non-GAAP measures to the most directly comparable GAAP measures can be found in the              -GAAP
Reconciliation        included in the exhibits to this Presentation.

                                                                                                                                                             4
2Q22 Investor Presentation - July 19, 2022 - SEC.gov
United Community Banks, Inc.                                                                                      Company Overview
 Committed to Service Since 1950
                                                                                                           $24.2                          $14.5
                                                                                                           BILLION IN                   BILLION IN
                                                                                                         TOTAL ASSETS                  TOTAL LOANS

                                                             Regional Full Service Branch Network
                                                             National Navitas and SBA Markets

                                                                                                             $4.1                         $20.9
                                                                                                                                         BILLION IN
                                                                                                         BILLION IN AUA               TOTAL DEPOSITS

                                                                                                                                  100 BEST BANKS IN
     Banking Offices                                                                                       12.5%                       AMERICA
                                                                                                          TIER 1 RBC                 in 2022 for the ninth
                                                                                                                                   consecutive year - Forbes

                                                                                                                                     #2 Highest Net
Premier Southeast Regional Bank                                                                            $0.21                     Promoter Score
  Metro-focused branch network with locations in the fastest-growing MSAs in the Southeast          QUARTERLY DIVIDEND            among all banks nationwide
                                                                                                        UP 11% YOY                  in 2021 J.D. Power
  185 branches, 10 LPOs, and 4 MLOs across six Southeast states
  Top 10 market share in GA, SC and TN
  Proven ability to integrate 12 acquisitions completed over the past 10 years
  Pending deal with Progress Financial Corporation will add 14 branches and $1.1 billion in AUA              195                      BEST BANKS
                                                                                                       BANKING OFFICES
Extended Navitas and SBA Markets                                                                         ACROSS THE                and #3 in the United
  Offered nationwide                                                                                     SOUTHEAST                    States - Forbes
  SBA business has both in-footprint and national business (5 specific verticals)
  Navitas subsidiary is a technology enabled small-ticket, essential-use commercial equipment        #1 IN CUSTOMER
  finance provider                                                                                                                 BEST BANKS TO
                                                                                                      SATISFACTION                   WORK FOR
                                                                                                    in 2022 with Retail Banking
                                                                                                                                      in 2021 for the fifth
                                                                                                       in the Southeast J.D.
 Note: See glossary located at the end of this presentation for reference on certain acronyms                                         consecutive year
                                                                                                               Power                   American Banker
                                                                                                                                                              5
2Q22 Investor Presentation - July 19, 2022 - SEC.gov
$0.61                         9.3%
Diluted earnings per share   Return on common equity
         - GAAP
        $0.66
                                     - GAAP
                                     14.2%                                                                              2Q22 Highlights
Diluted earnings per share   Return on tangible common
         operating(1)           equity operating(1)

                                                                    Diluted Earnings Per Share                                 Return on Average Assets

                                                                $0.78 $0.79                                              1.46% 1.48%

       1.08%                          7.0%                                              $0.50
                                                                                                  $0.61
                                                                                                           $0.66

                                                                                                                                             0.89%
                                                                                                                                                      1.08%
                                                                                                                                                           1.17%

Return on average assets       Annualized 2Q EOP core                           $0.43                                                   0.78%
        - GAAP               loan growth, excluding PPP

                                                                    2Q21          1Q22               2Q22                   2Q21           1Q22          2Q22
                                                                                                         (1)                                             (1)
                                                                           GAAP           Operating                                GAAP       Operating

       1.17%                         53.2%
Return on average assets          Efficiency ratio
      - operating(1)                 operating(1)                         Book Value Per Share                            PTPP Return on Average Assets
                                                                                $24.38            $23.96
                                                                 $22.81
                                                                                                                          1.64% 1.67%                          1.60%
                                                                                                                                              1.52%    1.49%
                                                                       $18.49                                                            1.37%
                                                                                         $17.08                $16.68

       1.60%                          70%
 PTPP return on average         Loan-to-Deposit ratio
  assets operating(1)
                                                                    2Q21           1Q22              2Q22                    2Q21           1Q22           2Q22

                               Other 2Q notable                            GAAP           Tangible
                                                                                                   (1)
                                                                                                                                 PTPP        Operating PTPP
                                                                                                                                                                   (1)

                                    items:
       0.08%                  $2.1 mm MSR Gain
     Cost of deposits
                              $0.7 mm BOLI Gain
         39%
  DDA / Total Deposits          $1.4 mm SBA               (1) See non-GAAP reconciliation table slides in the Appendix for a reconciliation of
                                                              operating performance measures to GAAP performance
                               Servicing Write-down                                                                                                            6
2Q22 Investor Presentation - July 19, 2022 - SEC.gov
Long-Term Financial Performance & Shareholder Return
                                                                               (1)(2)                                                                                      (1)(2)
                                                     ROA - Operating                                                                                  ROTCE - Operating
                                                        1.51%                                                                                                                   17.33%
                                             1.40%                                      1.42%                                                15.69%    15.81%

                                                                                                                                                                                              13.89% 14.20%
                                                                                                                  1.17%                                           12.24%
                                                                       1.07%                            1.13%                       12.02%
  1.06%    1.09%                                                                                                           11.86%

  2016      2017                             2018       2019           2020             2021       1Q22          2Q22        2016     2017     2018     2019       2020         2021          1Q22    2Q22

                                                          UCBI            KRX                                                                             UCBI            KRX

                                                      Performance for                   KBW Nasdaq
                                                                      United Community
                                                     the period ended                  Regional Bank
                                                                          Banks, Inc.
                                                       July 15, 2022                    Index (KRX)
                                             $500
                                             $450          1-YEAR                          4%                    -7%                                                                  $462
                Total Shareholder Return $

                                             $400          3-YEAR                         22%                    19%
                                             $350          5-YEAR                         25%                    14%                                                 UCBI
                                             $300         10-YEAR                         358%                  151%                                            Outperformance
                                             $250                                                                                                                                      $248
                                             $200
                                             $150
                                             $100
                                              $50
                                               $0
                                                 2012           2013            2014             2015           2016      2017      2018     2019      2020        2021             2022

(1) See non-GAAP reconciliation table slides in the Appendix for a reconciliation of operating performance measures to GAAP performance
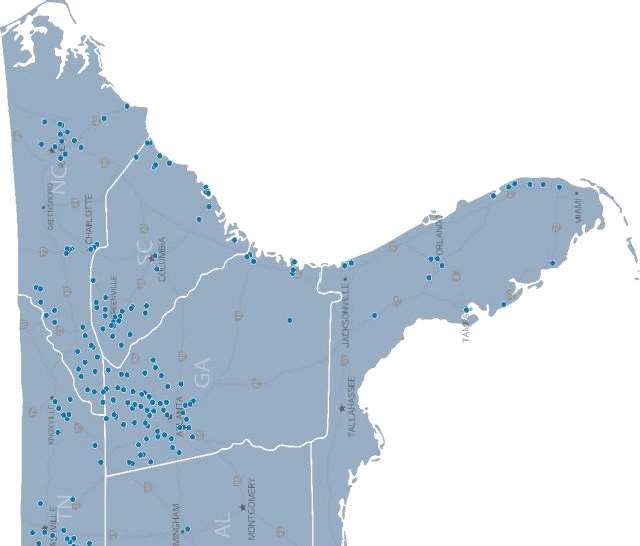
(2) UCBI 1Q22 excludes the impact of the $18.3 million initial provision to establish the reserve for Reliant loans                                                                                    7
Footprint Focused on High-Growth MSAs in Southeast

             United MSA Presence            Progress MSA Presence

                  Projected Population Growth(2) (2022-2027)                                    Projected Household Income Growth (2) (2022-2027)
                          4.9%                                                                              11.9%              12.1%
                                                3.2%

                                              National                                                                         National
                                               Avg.                                                                             Avg.

(1) Includes MSAs with a population of greater than 1,000,000
(2) Includes MSAs with a population between 200,000 and 1,000,000                                                                                   8
(3) Market Rank and (%) of Total Deposits pro forma for pending acquisition of Progress Financial Corporation
Outstanding Deposit Franchise
                       2Q22 Total Deposits $20.9 billion

                                Time                                                  Total deposits were down $183 million
                Savings              8%                                               from 1Q22 but up $4.5 billion YOY
                              7%
                                                             DDA                           Excluding Reliant and Aquesta, total
                                                     39%                                   deposits were up $1.4 billion, or 8.5% YOY
                         24%                                                          Core transaction deposits were down
                MMDA
                                                                                      $156 million from 1Q22 and up $3.9
                                                                                      billion YOY
                                       22%
                                                NOW
                                                                                           Excluding Reliant and Aquesta, core
                                                                                           transaction deposits were up $1.1 billion, or
                            Cost of Deposits Trend                                         8.8% YOY
 0.40%
           0.38%                                                                      Cost of deposits remained nearly flat at
 0.35%
                                                                                      0.08%; up 2 bps from 1Q22, with a 63
 0.30%                                                                                bps increase in the average Fed Funds
 0.25%              0.25%                                                             rate, equating to a 3% deposit beta
 0.20%
                            0.17%
                                     0.14%
 0.15%
                                             0.09%
 0.10%                                               0.07%                 0.08%
                                                             0.06% 0.06%
 0.05%

 0.00%
         2Q20    3Q20    4Q20       1Q21     2Q21    3Q21    4Q21   1Q22   2Q22

Note: Core transaction accounts include demand deposits, interest-bearing demand, money market and savings accounts, excluding public funds
deposits                                                                                                                                      9
10

     Well-Diversified Loan Portfolio
                     2Q22 Total Loans $14.5 billion                                          Quarter Highlights

                             Residential
                                                                                                Loans increased $225 million, or 6.3%
                            Construction     Manufactured Housing                               annualized; core loan growth of 7.0%
                   Home Equity        3% 2%                                                     annualized, excluding PPP
                                 5%
                                                                                                Strong organic growth was driven by
     Residential
                                                                                                Residential Mortgage and Residential
      Mortgage                                                                                  Construction, with 2Q22 annualized
                   14%
                                                                                  C&I           growth of 37% and 14%, respectively
                                                                          42%
   Other                                                                                     Granular Loan Portfolio
 Consumer     1%
                                                                                                Construction & CRE ratio as a
                                                                                                percentage of total RBC = 74% / 202%
                                                                                                Top 25 relationships totaled $661 million,
                                                                                                or 4.5% of total loans
                      23%
              CRE                                                                               SNCs outstanding of $263 million, or
                                                                                                1.8% of total loans
                                                  10%
                                                                                                Project lending limit of $25 million
                                                  Commercial
                                                  Construction                                  Relationship lending limit of $40 million

     Note: C&I includes commercial and industrial loans, owner-occupied CRE loans and Navitas (equipment finance) loans
                                                                                                                                       10
11

     Deposit Growth Creates Remix Opportunity
     $ in billions

             $25.0
                                                                          Loans and Deposits
                     97%

             $20.0                                                                                                                   $21.1                     $20.9

                     87%
                                                                                                   $18.2
             $15.0                          $16.3                        $16.9
                                                                                   $0.1                              $14.3                     $14.5
                            $0.5                         $0.2
                                                                                   $11.8
                     77%

             $10.0                                       $11.0
                            $10.9
                                    70%                                                                                                                  70%
                                                                                                                              68%
              $5.0   67%

                                                                 66%
                                                                                            64%

              $0.0   57%

                           Loans           Deposits     Loans           Deposits   Loans          Deposits           Loans          Deposits   Loans          Deposits
                                    2Q21                         3Q21                      4Q21                              1Q22                      2Q22
                     47%

                                                      Loans excluding PPP          PPP Loans                 Loans / Deposits %

                                                                    2Q21             3Q21                    4Q21                   1Q22          2Q22
                       Annualized Core Loan Growth %                    5%            4%                      7%                    9%            7%
                       Loan Yield %                                 4.40%           4.54%                    4.18%              4.18%            4.33%
                       Annualized Core Deposit Growth %                 8%           13%                     17%                    13%           -4%
                       Deposit Cost %                               0.09%           0.07%                    0.06%              0.06%            0.08%

     Note: Loan growth excludes PPP loans and adjusts for the Aquesta acquisition that closed October 1, 2021 and the Reliant acquisition that closed
     January 1, 2022. Deposit growth also adjusts for the Aquesta and Reliant acquisitions.                                                                              11
Capital

             Quarterly dividend of $0.21 per share, an increase of 11% YOY
             Net unrealized securities losses in AOCI increased by $90.9 million to $268 million
             in 2Q22
             There were no share repurchases during 2Q22

*2Q22 regulatory capital ratios are preliminary
                                                                                                   12
(1)
Net Interest Revenue / Margin
$ in millions
                                      $178.9
                       $163.8
                                                                                               0.18%
        $138.4                                                                 0.05%                            (0.00%)       (0.01%)     3.19%

                                                                    2.97%

          3.19%                        3.19%
                         2.97%
                                       3.13%
          2.81%          2.90%

         2Q21           1Q22           2Q22                        1Q22 NIM   Mix Change   Higher Interest   Loan Accretion   PPP Fees   2Q22 NIM
                Net Interest Revenue ($ in millions)                                           Rates
                Net Interest Margin (1) (2)
                Core Net Interest Margin                                                      2Q22 NIM Expansion

        Net interest margin increased 22 bps from 1Q22, primarily driven by increased interest rates
        Core net interest margin of 3.13%, which excluded PPP fees and purchased loan accretion, was up 23 bps in 2Q22 from 2.90%
        in 1Q22
        Purchased loan accretion totaled $3.0 million and contributed 5 bps to the margin, flat from 1Q22
        PPP fees contributed 1 bp in 2Q22 compared to 2 bps in 1Q22
        48% of total loans were floating rate, but 5% were priced at their floors; with 50 bps of rate hikes, 95% of loans priced at their
        floors will be floating
        25% of securities were floating rate

(1) Net interest margin is calculated on a fully-taxable equivalent basis
(2) Core net interest margin excludes PPP fees and purchased loan accretion                                                                13
14

     Historical Deposit Beta
       3.00%                                                                                                         2.88%
                                                                                                    2.76%    2.80%
                                                                                            2.53%                            2.47%
                                                                                                                                     2.40%
       2.50%
                                                                                                                     2.22%
                                                                                  2.07%                                      2.40%     2.12%
                                                         1.94%                                               1.92%
       2.00%                                                      1.80%   1.81%
                                                                                                    1.73%
               1.58%                            1.61%
                                                                                            1.45%
       1.50%            1.37%
                                1.24%                                             1.20%
                                        1.12%                             1.15%
                                                                  0.95%
       1.00%
                                                         0.70%

                                        0.39%   0.45%                                                                        0.62%   0.65%
       0.50%            0.36%   0.37%                                                                                0.55%
                                                                                                             0.44%
               0.16%                                                                                 0.33%
                                                                                  0.24%     0.26%
                                                                  0.17%   0.20%
               0.12%    0.11%   0.12%   0.12%    0.14%    0.14%
       0.00%

                                   Average Cost of Deposits %         Average Fed Funds %           Average 5-YR UST %

                       4Q15      2Q19 UCBI total deposit beta (including DDA) equal to 24%
                       Deposit beta for the first 100 bps increase was equal to 8%

                                                                                                                                             14
Noninterest Income                                                   Linked Quarter
$ in millions
                                                                       Fees were down $5.5 million
                    $40.1                                                Mortgage fees were down $9.1 million from
                                                $39.0                    1Q22 primarily due to lower lock volume and
                     $2.4       $37.2
      $35.8                                         $3.2                 $4.3 million less in MSR gains
                                    $3.8                    $33.5          Rate locks were down with $597 million compared to
        $4.1                                                               $757 million in 1Q22
                     $13.8
                                                             $3.8          79% of locks were floating in 2Q22, up from 69% in
                                                                           1Q22, these loans are going onto the balance sheet
                                    $10.9           $16.1                  rather than being sold
       $11.1                                                 $7.0          MSR gain of $2.1 million in 2Q22, down $4.3 million
                                                                           from 1Q22
                                                                           Mortgage gain on sale was 3.7% on $160 million of
                     $5.5                                                  mortgage loans sold
                                    $6.1                     $6.0
        $3.8                                                               2Q22 mortgage production purchase/refi mix was
                                                    $5.9                   79%/21%
                     $9.0
                                                                         Gain on sale of SBA and USDA loans was $3.1
                                                             $6.7
        $8.4                        $7.8                                 million on $39.1 million of loan sales
                                                    $4.7
                                                                         Gain on sale of equipment finance loans was
                                                                         $694 thousand on $20.5 million of loan sales
                                                                         Other noninterest income included a $0.7 million
                     $9.4                           $9.1     $10.0
        $8.4                        $8.6                                 BOLI gain and a $1.4 million SBA servicing write-
                                                                         down
       2Q21          3Q21           4Q21            1Q22     2Q22
                                                                     Year-over-Year
          Service Charges                   Other                      Fees were down $2.3 million
          Brokerage / Wealth Mgmt           Mortgage                     Mortgage rate locks were down 15% compared
          Loan sale gains                                                to last year ($597 million in 2Q22 compared to
                                                                         $702 million in 2Q21)

                                                                                                                        15
Disciplined Expense Management
$ in millions
                                                                  $120.8
                                                                                   Linked Quarter
                                                    $119.3

                                                                        $113.6
                                                                                     GAAP and operating expenses increased
                                   $109.2                $110.3                      1.3% and 3.1%, respectively
                                                                                            The majority of the increase was driven by $2.2
                                            $99.2                                           million of compensation merit increases, offset
                   $96.7
    $95.5 $94.5            $95.3                                                            by Reliant cost savings
                                     62.1%
                                                                                   Year-over-Year
                                                                                     GAAP and operating expenses increased
                                                                                     26.4% and 20.3%, respectively
                                                     57.4%                                  The majority of the increase was driven by the
                                                                  56.6%
                                                                                            Reliant acquisition, which closed on January 1,
                                     56.5%
                                                                                            2022, the Aquesta acquisition, which closed on
        54.5%
                                                                                            October 1, 2021 and the FinTrust acquisition,
                      53.1%                                                                 which closed on July 6, 2021
        53.9%
                                                     53.1%        53.2%                We made two additional adjustments to the
                      52.3%
                                                                                       efficiency ratio operating by excluding PPP
                                                                                       fees and MSR marks; this adjusted efficiency
                                                                                       ratio moved from 57.7% in 2Q21 to 53.9% in
       2Q21           3Q21           4Q21             1Q22          2Q22               2Q22 as merger cost savings were realized
        Expenses                     Efficiency Ratio
                  GAAP                                  GAAP

                  Operating (1)                         Operating (1)

(1) See non-GAAP reconciliation table slides at the end of the exhibits for a reconciliation of operating performance measures to GAAP performance
measures                                                                                                                                             16
Credit Quality
                                  Net Charge-Offs as % of Average Loans

0.20%
                                                                                                                             2Q22 net recoveries of $1.07
0.15%                                                                                                                        million, or 0.03% of average loans,
                                                                                                                             annualized
0.10%                                                                                           0.08%

           0.05%
0.05%
                                                                 0.02%
                                                                               0.01%
0.00%                        -0.01%
                                            -0.02%
                                                                                                                    -0.03%

-0.05%
            4Q20           1Q21               2Q21               3Q21            4Q21            1Q22          2Q22

                         Provision for Credit Losses & NCOs ($ in millions)

                         Provision for Credit Losses $                        Net Charge-Offs $                              The provision for credit losses was
                                                                                                                             $5.6 million in 2Q22
$21.4                                                                                         $23.1
$16.4                                                                                                                        The 1Q22 provision for credit
$11.4                                                                                                                        losses included $18.3 million to
 $6.4                                                                                                 $3.0
                                                                                                                             establish the Reliant initial loan
                $1.5
 $1.4    $2.9
                                                                       $0.6            $0.2                  $5.6
                                                                                                                             loss reserve
 -$3.6                           ($0.3)             ($0.5)                    ($0.6)                                ($1.1)

 -$8.6                                                       ($11.0)
                       ($12.3)
                                          ($13.6)
-$13.6
           4Q20            1Q21               2Q21               3Q21            4Q21            1Q22          2Q22

                                                                                                                                                            17
Higher-Risk Loan Trends
 Special Mention & Substandard Accruing Loans as a % of Total Loans
3.5%    3.2%
                                                                         Special mention loans improved by 0.12%
3.0%
                         2.5%        2.6%                                (from $298 million in 1Q22 to $285 million
2.5%
                                                  2.1%            2.0%   in 2Q22, an improvement of $13 million)
2.0%

1.5%
                                                                         Substandard accruing loans remained flat
        1.7%
1.0%
                         1.6%
                                     1.4%
                                                                         at 1.2% quarter-over-quarter as a % of
                                                  1.2%            1.2%
0.5%
                                                                         total loans
0.0%
        2Q21             3Q21        4Q21         1Q22           2Q22
               Special Mention (%)           Substandard Accruing(%)

            Non-Performing Assets as a % of Total Loans

0.45%
                                                                         Non-performing assets improved by $6.4
0.40%
         0.41%            0.41%                                          million during the quarter and stand at
0.35%

0.30%
                                                                         0.23% of total loans
0.25%                                0.28%        0.29%

0.20%                                                            0.23%
0.15%

0.10%

0.05%

0.00%
          2Q21            3Q21       4Q21         1Q22           2Q22

                                                                                                                 18
Allowance for Credit Losses
                                                      ACL Walk Forward

                                                                                            $2,959                          Reserve build due to loan
                                                    $1,069
                                  $2,652
                                                                         ($7)
                                                                                                              $153,042      growth, net recoveries and
             $146,369
                                                                                                                            model changes reflecting a
                                                                                                                            weaker economic forecast
($000)

            1Q22 ACL          Loan Growth      Net Recoveries      Specific Reserve     Model / Forecast     2Q22 ACL
                                                                                           Changes

                                                Allowance for Credit Losses
                                            1.39%   1.38%
          $160
                                                             1.26%                                                  1.40%   Built reserve in consecutive
          $140                     1.14%                               1.12%
                          0.99%                                                 1.00%     0.97%   1.02%     1.05%   1.20%   quarters with the Reliant
          $120    0.84%                                                                                             1.00%
                                                                                                                    0.80%
                                                                                                                            acquisition in 1Q22, a weaker
          $100

           $80
                                            $146     $148
                                                                $136
                                                                       $123
                                                                                                     $146   $153
                                                                                                                    0.60%   economic forecast and loan
                                    $116                                        $111       $114
           $60             $88
                                                                                                                    0.40%
                                                                                                                            growth in 2Q22
                   $74                                                                                              0.20%
           $40                                                                                                      0.00%
                 1-Jan-20 1Q20      2Q20    3Q20    4Q20     1Q21      2Q21     3Q21      4Q21       1Q22   2Q22

                          ACL - Allowance for Credit Losses $             ACL - Allowance for Credit Losses %

         Note: ACL includes the reserve for unfunded commitments and excludes the impact of PPP
                                                                                                                                                    19
2Q22 INVESTOR PRESENTATION
           Exhibits
21

     Blended Cash and Securities Yield
     $ in billions

                                                    Cash and Securities
           $8.0
                                                                                                                     $1.7           $1.2
           $7.0
                                                                                                      $2.2
           $6.0                                                                        $1.7
                                                                        $1.3
           $5.0                                         $1.2
                                          $1.5
           $4.0
                                $0.9                                                                                                $6.7
           $3.0       $1.2                                                                                           $6.4
                                                                                       $5.3           $5.7
                                                                        $4.9
           $2.0                                         $4.3
                                          $3.6
                      $2.4      $3.1
           $1.0

           $0.0
                      2Q20     3Q20      4Q20          1Q21            2Q21            3Q21           4Q21           1Q22           2Q22

                                           Investments ($)     Fed Funds & Interest Earning Cash ($)

                              2Q20     3Q20        4Q20         1Q21           2Q21           3Q21           4Q21           1Q22       2Q22
       Securities Yield %     2.68%    2.21%       1.83%        1.62%          1.58%          1.51%          1.46%          1.55%      1.81%
       Blended Yield %        2.14%    1.61%       1.36%        1.30%          1.31%          1.19%          1.10%          1.24%      1.62%
       Avg. 5-Yr Treasury %   0.36%    0.27%       0.37%        0.61%          0.83%          0.80%          1.18%          1.84%      2.95%

                                                                                                                                           21
22

     Interest Rate Sensitivity
                                  Net Interest Income Sensitivity
                                                                                  11.36%

                                                    5.77%                         7.29%

                                                    4.81%

                        1.44%

                        1.44%

                       +25 bps                     +100 bps                      +200 bps

                                     % Change - Shocks        % Change - Ramps

        4.81% asset sensitivity in +100 bps ramp
        One 25 bps Fed rate hike is worth approximately 5 bps to net interest margin
            22% Beta assumed for discretionary non-maturity deposits
        Other relevant data points
            Approximately $6.9 billion or 48% of loans are floating rate loans
            Approximately $655 million of loans are at their floor, $625 million of which
            would begin floating after 50 bps of rate hikes

                                                                                            22
Navitas Performance
$ in millions
                                         Navitas Originations
                                                                                                              Navitas 8% of total loans
                  9.54%    9.29%     9.44%    9.61%
 $250    9.26%                                         9.27%     9.15%                      9.13%    10.00%
                                                                                    8.90%
                                                                           8.82%
                                                                                                              Navitas 2Q22 NCOs of 0.31%,
 $200
                                                                            $204
                                                                                     $213    $212    8.00%
                                                                                                              or $0.9 million
                                                       $181       $186
 $150
                                     $145       $148
                                                                                                     6.00%
                                                                                                              Average quarterly losses
                           $134
 $100     $126                                                                                       4.00%    since 2Q20 of $1.1 million
                   $94
  $50                                                                                                2.00%    Navitas ACL - Loans equated
  $-                                                                                                 0.00%    to 1.52% as of 2Q22
          1Q20    2Q20     3Q20      4Q20      1Q21    2Q21      3Q21      4Q21     1Q22     2Q22

                              Navitas Originations $             Origination Yield %
                                                                                                              Economic recovery and
                                                                                                              government intervention
                                             Navitas Portfolio
$1,400    9.39%    9.19%                                                                             10.00%
                                                                                                              driving historically low loss
                             9.12%      9.08%      9.08%      9.01%      8.89%     8.85%    8.80%
                                                                                                              rates
$1,200
                                                                                            $1,211   8.00%
                                                                                   $1,148
$1,000                                                                   $1,083
                                                           $1,017
                                                   $969
                                        $913                                                         6.00%
  $800                       $864
                    $823
           $779
  $600
                                                                                                     4.00%

  $400
                                                                                                     2.00%
  $200

    $0                                                                                               0.00%
          2Q20     3Q20      4Q20       1Q21       2Q21        3Q21      4Q21      1Q22     2Q22

                                    Navitas Loans $            Portfolio Yield %

                                                                                                                                           23
Mortgage Activity Shift to Purchase & Adjustable Rate
Loans
$ in millions
     $1,200                                                                                                                                           6.0%

                                 5.0%          5.0%
     $1,000                                                         4.6%                                                                              5.0%
                       4.0%                                  $993
                                                                                              4.0%
                               $910                                               3.8%                         3.9%
       $800                                                                                                                 3.6%          3.7%        4.0%
                $802                         $792
                                                                                            $731                          $757
                                                                           $702                             $695
       $600                                                                                                                                           3.0%
                                                                                                                                        $597

       $400                                                                                                                                           2.0%
                        $395          $402          $410                          $407
                                                                    $336                           $320
       $200                                                                                                        $285                               1.0%
                                                                                                                                 $207
                                                                                                                                               $160
         $0                                                                                                                                           0.0%
                  2Q20           3Q20          4Q20            1Q21          2Q21             3Q21            4Q21          1Q22          2Q22

                                                      Mortgage locks $       Loans sold $            Gain on sale %

      Gain on sale % remained relatively flat in 2Q22
      Purchase / Refi mix shifted from 60% / 40% in 2Q21 to 79% / 21% in 2Q22
      79% of locked loans were adjustable rate mortgages in 2Q22, up from 69% in 1Q22
      Sold $160 million of mortgage loans in 2Q22, down $47 million from $207 million sold in 1Q22
      Our model primarily is to sell fixed rate mortgages (thereby creating a gain on sale) and to
      hold adjustable rate mortgages on the balance sheet
      While total rate locks declined 21% from 1Q22, rate locks HFS decreased 45% due to mix
      change toward adjustable rate mortgages

                                                                                                                                                        24
Selected Segments                                    Senior Care
$ in millions

                                                    $535           $537           $549
                                                                                                  $520          $518
                $486        $503      $511
      $500
                                                                                                                              $465
                                                                                                           1%
                                                                                                     6%
      $400                                                                                                      20%

      $300

      $200                                                                                  49%
                                                                                  $170             $169                 25%
                                                                    $170                                         $144
                                                     $172                                                                     $135
      $100                             $100

                            $34                                     $64            $73             $73           $66          $59
                $13                    $46           $48
                       $7   $21
        $0
                2Q20        3Q20      4Q20          1Q21            2Q21          3Q21            4Q21           1Q22         2Q22

                                   Nonaccruals $   Substandard Accruing $   Special Mention $     Pass $

             Senior Care lending team are dedicated specialists with significant experience in
             the space
             Senior Care portfolio outstanding totaled $465 million as of 2Q22, or 3.2% of total
             loans
             As of June 30, $6.6 million of Senior Care loans were in nonaccrual
             As of June 30, $135 million of Senior Care loans were special mention and $59
             million were substandard accruing

                                                                                                                                     25
26

     Non-GAAP Reconciliation Tables
     $ in thousands, except per share data

                                             26
27

     Non-GAAP Reconciliation Tables
     $ in thousands, except per share data

                                             27
28

     Glossary

                28
You can also read