Q4 & FY 2014 Results 30 April, 2015 - PRIVATE AND CONFIDENTIAL
←
→
Page content transcription
If your browser does not render page correctly, please read the page content below

Q4 & FY 2014 Results

Q4 & FY 2014 Results
       30 April, 2015
         PRIVATE AND CONFIDENTIAL
Index

                                       Q4 & FY 2014 Results

Executive Summary

Strategy

Key Performance indicators

Quarter 4 & Full Year Financials

Recent Developments

Outlook

                                   2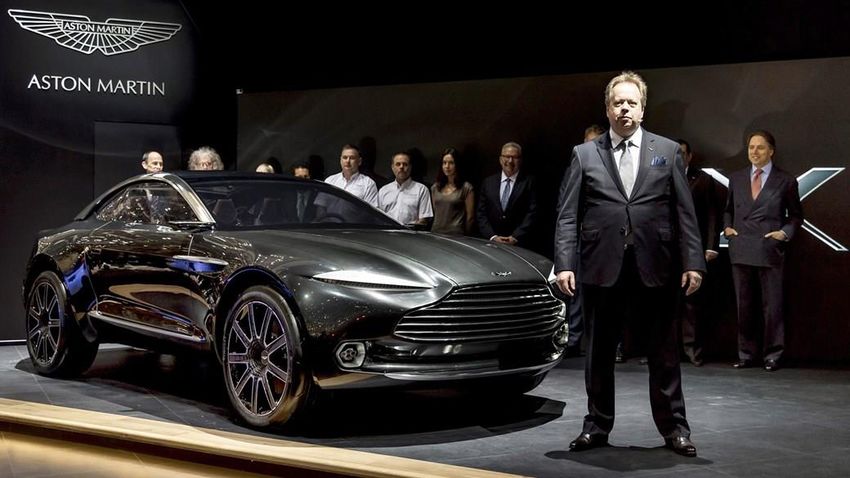
Executive Summary (1 of 2)
Q4 & FY 2014 Results
Aston Martin is pursuing a strategy targeted at building a stable platform
for growth and a sustainable future in the luxury automotive arena – the
‘Second Century Plan’ will enable Aston Martin to thrive for the next 100
years and beyond
The ‘Second Century Plan’ is fully supported by the shareholders who
have together successfully secured the £200m funding required to deliver
the product plan, with the first tranche of additional preferred stock
investment already received
The first phase of the plan is to ensure stability ahead of concluding
development of the next generation of sports cars – Aston Martin will then
introduce new luxury models, which will enable expansion into new
segments and deliver further growth
3
Executive Summary (2 of 2)
Q4 & FY 2014 Results
2014 results reflect a solid underlying performance impacted by
challenging China market conditions
Global wholesale volume for the year totalled 3,685 units
Full year revenue of £468m was delivered
Adjusted EBITDA for the year closed at £66m
New product investment increased to £115m (increase of circa 45% over
last three years), reflecting commitment to the delivery of the next
generation of sports cars
The 2015 full year outlook is for adjusted EBITDA to remain broadly flat
EBITDA weighted towards Q4 inline with previous years, driven by Aston Martin
Vulcan and GT12 sales
As the biggest investment plan in the company’s 102-year history, the
‘Second Century Plan’ will demand continued and increasing investment
in new products through 2015 and beyond
4
Index

                                       Q4 & FY 2014 Results

Executive Summary

Strategy

Key Performance indicators

Quarter 4 & Full Year Financials

Recent Developments

Outlook

                                   5
‘Second Century Plan’ targeted at building stability, growth
and a sustainable future
                                                         Q4 & FY 2014 Results

                        Aston Martin Strategy

 Today                                                              2020

                    Phase 2               Phase 3     Sustainable
   Phase 1
                      Core                Portfolio     Luxury
 Stabilisation
                 Strengthening           Expansion     Business

                                  6
Strategy
Q4 & FY 2014 Results
Today 2020
Phase 2 Phase 3 Sustainable
Phase 1
Core Portfolio Luxury
Stabilisation
Strengthening Expansion Business
7Short term focus is on building strong foundations to create
a stable platform for growth
Q4 & FY 2014 Results
Specialty
Specialty focus:
focus: Vantage
Vantage GT3,
GT12,Project
Aston ‘Vulcan’, Lagonda
Martin Vulcan, super-saloon,
Lagonda Q by AM
super-saloon,
Product
Product
Q by Aston Martin
Cross-carline deployment of Vanquish-style infotainment technology
Drive a Total Customer Satisfaction approach to quality
Quality
Quality Build a cross-functional ethos to ensure quality in everything we do
Build a cross-functional ethos to ensure quality in everything we do
Total delivered Cost (TdC) and Total commercial Cost (TcC) work streams
Cost
Cost Stimulate a value creation and cost effectiveness culture throughout organisation
Build a cross-functional ethos to ensure cost effectiveness in everything we do
Strengthen regional capabilities with a competent and productive dealer network
Sales
Sales
Drive a retail pull through high impact product actions
Grow the purchase funnel with quality leads through regionally relevant activity
Marketing
Maximise impact of specialty products and James Bond association
8Aston Martin DB10
Q4 & FY 2014 Results
9Aston Martin Vantage GT12
Q4 & FY 2014 Results
10Aston Martin Vulcan
Q4 & FY 2014 Results
11Strategy
Q4 & FY 2014 Results
Today 2020
Phase 2 Phase 3 Sustainable
Phase 1
Core Portfolio Luxury
Stabilisation
Strengthening Expansion Business
12Growth underpinned by investment in replacement of core
sports car portfolio with new luxury competitive products
Q4 & FY 2014 Results
SECOND CENTURY PLAN PHASE 2: CORE STRENGTHENING
New state-of- New interior
the-art & exterior
New New powerful
electrical styling with
advanced & efficient
architecture substantial
lightweight powertrain
& cutting differentiation
platform technology
edge between
technology models
New Luxury Competitive Models
13Strategy
Q4 & FY 2014 Results
Today 2020
Phase 2 Phase 3 Sustainable
Phase 1
Core Portfolio Luxury
Stabilisation
Strengthening Expansion Business
14New luxury model introductions, such as DBX, will enable
expansion into new markets and deliver further growth
Q4 & FY 2014 Results
SECOND CENTURY PLAN PHASE 3: PORTFOLIO EXPANSION
15Index
Q4 & FY 2014 Results
Executive Summary
Strategy
Key Performance indicators
Quarter 4 & Full Year Financials
Recent Developments
Outlook
16FY 2014 volume down by 4% due to Chinese market
Q4 & FY 2014 Results
V12
V8 3,804
3,662 -4%
3,662
2,590 2,808 2,590
71% 74% 71%
1,138 -4% 1,185
792 70% 941 79%
1,072 996 1,072
29% 26% 29%
346 30% 244 21%
Q4 2014 Q4 2013 FY 2014 FY 2013 LTM
Cygnet 0 25 23 100 23
17Average wholesale price affected by Chinese market and
model mix
Q4 & FY 2014 Results
Price in Average Wholesale Price
£(000)’s
130
126
-10%
117
114 114
Q4 2014 Q4 2013 FY 2014 FY 2013 LTM
Excludes Cygnet,One-77 and Zagato
18Lower revenues impacted by Chinese market and product
mix
Q4 & FY 2014 Results
Revenue Revenue
£(mil)
519
-10%
468 468
-11% 167
148
Q4 2014 Q4 2013 FY 2014 FY 2013 LTM
19Lower sales results in lower adjusted EBITDA
Q4 & FY 2014 Results
Q4 Q4 FY FY
2014 2013 2014 2013 LTM
(mils) (mils) (mils) (mils) (mils)
Revenue £147.8 £166.5 £468.4 £519.2 £468.4
Gross Profit £47.5 32% £51.1 31% £155.0 32% £167.1 32% £154.9 32%
Operating Profit/(Loss) £2.7 2% £3.8 2% £(18.4) -4% £1.5 0% £(18.4) -4%
Loss after tax £(14.5) -10% £(2.2) -1% £(64.8) -14% £(16.7) -3% £(64.8) -14%
EBITDA £23.7 16% £25.3 15% £62.0 13% £72.9 14% £62.0 13%
Adjusted EBITDA £24.5 17% £30.5 18% £66.3 14% £84.8 16% £66.3 14%
*Percentages refer to revenue
20Index
Q4 & FY 2014 Results
Executive Summary
Strategy
Key Performance indicators
Quarter 4 & Full Year Financials
Recent Developments
Outlook
21Lower volumes and mix resulting in lower operating profits
Q4 & FY 2014 Results
Q4 Q4 FY FY
2014 2013 2014 2013 LTM
(mils) (mils) (mils) (mils) (mils)
V8 Cars 346 244 1,072 996 1,072
V12 Cars 792 941 2,590 2,808 2,590
Cygnet 0 25 23 100 23
Total Wholesales excl.
1,138 1,185 3,662 3,804 3,662
Cygnet
Revenue £147.8 £166.5 £468.4 £519.2 £468.4
Cost of Sales (100.3) -68% (115.3) -69% (313.3) -67% (352.0) -68% (313.3) -67%
Gross Profit £47.5 32% £51.1 31% £155.0 33% £167.1 32% £154.9 33%
Selling & Distribution (9.3) -6% (8.5) -5% (33.4) -7% (34.1) -7% (33.4) -7%
Administrative & Other (35.7) -24% (38.9) -23% (140.0) -30% (131.6) -25% (140.0) -30%
Operating Profit/(Loss) £2.7 2% £3.8 2% £(18.4) -4% £1.5 0% £(18.4) -4%
*Percentages refer to revenue
22Q4 adjustments includes one-off cost of concept cars
Q4 & FY 2014 Results
Q4 Q4 FY FY
2014 2013 2014 2013 LTM
(mils) (mils) (mils) (mils) (mils)
Operating Profit/(Loss) £2.7 2% £3.8 2% £(18.4) -4% £1.5 0% £(18.4) -4%
D&A 21.0 14% 21.5 13% 80.3 17% 71.4 14% 80.3 17%
EBITDA £23.7 16% £25.3 15% £62.0 13% £72.9 14% £62.0 13%
Adjustments
Professional fees relating to
6.7
capital increase
Concept vehicle development
0.8 5.2 6.0 5.2 6.0
costs
Gain on disposal of an
(1.7) (1.7)
associated company
Adj. EBITDA (£m) £24.5 17% £30.5 18% £66.3 14% £84.8 16% £66.3 14%
Note: After discussions with auditors Q3 results have been restated to reflect concept car costs as an adjusting item.
*Percentages refer to revenue
23Removing the China volume and marketing impact, the
2014 adjusted EBITDA is as per 2013
Q4 & FY 2014 Results
£3m 2013 FY
2014 FY
China Lost Additional Adj. EBITDA
China
Adj. EBITDA
Volumes £85m
Marketing Pro-forma
£15m
£84m
2014 FY Adj.
EBITDA
£66m
24Increased net financing expense impacts loss after tax
Q4 & FY 2014 Results
Q4 Q4 FY FY
2014 2013 2014 2013 LTM
(mils) (mils) (mils) (mils) (mils)
Operating Profit/(Loss) £2.7 2% £3.8 2% £(18.4) -4% £1.5 0% £(18.4) -4%
Net Financing Expense (18.0) -12% (5.4) -3% (53.5) -11% (26.9) -5% (53.5) -11%
Loss before tax (15.4) -10% (1.7) -1% (71.8) -15% (25.4) -5% (71.8) -15%
Taxation 0.8 0% (0.5) 0% 7.1 2% 8.7 2% 7.1 2%
Loss after tax £(14.5) -10% £(2.2) -1% £(64.8) -14% £(16.7) -3% £(64.8) -14%
*Percentages refer to revenue
25PIK interest and exchange movements increases net finance
expense
Q4 & FY 2014 Results
Q4 Q4 FY FY
2014 2013 2014 2013 LTM
(mils) (mils) (mils) (mils) (mils)
Bank loans and overdrafts (net) £(10.7) £(8.1) £(40.1) £(32.1) £(40.1)
Net defined benefit (liability)/ asset
0.1 0.3 0.3 0.1 0.3
interest (net)
Net (loss)/gain on financial instruments
recognised at fair value through profit or (3.1) 2.4 (6.9) 5.2 (6.9)
loss
Exchange loss on senior subordinated
(4.4) 0.0 (6.8) 0.0 (6.8)
PIK notes
Net Financing Expense £(18.0) £(5.4) £(53.5) £(26.9) £(53.5)
26Improved operating cashflow in quarter and full year
Q4 & FY 2014 Results
Q4 Q4 FY FY
2014 2013 2014 2013 LTM
(mils) (mils) (mils) (mils) (mils)
Cash generated from
£39.6 £27.9 £57.9 £21.3 £57.9
operating activities
Cash used in investing
£(30.9) £(40.3) £(123.1) £(103.3) £(123.1)
activities
Cash inflow from
£6.6 £24.0 £80.6 £107.2 £80.6
financing activities
Effect of exchange rates on
£(0.5) £(0.6) £(0.8) £(0.9) £(0.8)
cash and cash equivalents
Net cash inflow £14.8 £11.0 £14.6 £24.2 £14.6
Cash at period end £89.3
27Conscious decision to increase product development
investment to renew core luxury sports car portfolio
Q4 & FY 2014 Results
PD Spend
£(mil) £115.3m £115.3m
R&D Expense
Capitalised Engineering 10.1 10.1
Prod Capex
£80.3m
4.9
96.1 96.1
69.4
£32.7m
4.6
£20.7m
0.9
26.6
18.5
9.1 6.0 9.1
1.5 1.3
Q4 2014 Q4 2013 FY 2014 FY 2013 LTM
Note: 2013 intangible development costs do not include £16.7m for the acquisition of technology from Daimler
28Index
Q4 & FY 2014 Results
Executive Summary
Strategy
Key Performance indicators
Quarter 4 & Full Year Financials
Recent Developments
Outlook
29On the 23 April 2015 Aston Marin secured £200m of new
capital in the form of preference shares
Q4 & FY 2014 Results
On 23 April 2015 the company accepted binding subscriptions for £200m
of preference shares
The first tranche of £100m was received on 27 April 2015; the second
tranche may be drawn at any time in the following 12 months
The subscriptions also include warrants for a pro rata allocation of P
shares (non voting ordinary shares) corresponding to 4% of the current
fully diluted share capital of the company
Each preference share entitles the holder to be paid, in priority to the
payment of any dividend of any ordinary shares or D shares, a cumulative
preferential dividend at the rate of 15% per annum on the Paid Up
Amount per preference share (£1.00), which will accrue from the issue
date (29 April 2015), such dividend to compound annually and to be
payable on the Term Redemption Date (28 April 2025) or any other date
on which a preference share is redeemed
30Index
Q4 & FY 2014 Results
Executive Summary
Strategy
Key Performance indicators
Quarter 4 & Full Year Financials
Recent Developments
Outlook
312015 Outlook
Q4 & FY 2014 Results
EBITDA expected to be broadly in-line with prior year
UK & US markets expected to remain relatively strong
China market recovery not as immediate as expected
Other APAC markets showing signs of improvement
Europe not expected to see significant growth
Seasonality of EBITDA expected to be backend weighted influenced by low
volume, high contribution models
Increased product development spend as new model launches approach
Focus on cost reduction programmes for both fixed & variable costs
We are planning to host another Investor Day in 2015 which would include
a presentation of our ‘Second Century Plan’ by Andy Palmer, CEO
32Q4 & FY 2014 Results
Questions
We will initially take written questions and
time permitting move onto verbal questions
33Disclaimer
Q4 & FY 2014 Results
This presentation may include forecasts based on assumptions and estimates by the management of Aston Martin Holdings (UK) Limited. The
actual future development and actual future results may vary considerably from these assumptions and estimates due to numerous factors.
These factors may include, for example, changes in the global economic situation, changes affecting individual markets and exchange rates. We
provide no guarantee that future development and the future results actually achieved will correspond to the assumptions and estimates stated
here and accept no liability if they should fail to do so.
We confirm to the best of our knowledge the condensed set of consolidated financial statements have been prepared in accordance with IAS 34
'Interim Financial Reporting' as adopted by the EU and fairly represent the financial condition and operations of the Aston Martin Holdings (UK)
Limited group as at 31st December 2014.
34You can also read