4Q 2020 Review & 2021 Outlook - Commonwealth Bank & Trust
←
→
Page content transcription
If your browser does not render page correctly, please read the page content below
4Q 2020 Review
                       & 2021 Outlook
WINTER 2021             SUMMARY: Looking on the Bright Side… at least
4350 Brownsboro Rd.
Suite 210
                        the Market Finished Up
Louisville, KY 40207
                        Despite the medical, economic, political, Figure 1: S&P 500 Finishes at All-Time-High
                        and social turmoil in 2020, the S&P 500
p 502.259.2500
f 502.259.1501
                        posted an all-time-high closing price
www.cbandt.com          (3,756) on December 31 - an 18.40% total
                        return. Let’s hope it is a sign of good things
                        to come in 2021. The S&P 500 closed 2019
                        with a 31.49% return placing the index
                        up over 55% for the last two years. It
                        was an extraordinary year for the market
                        (please see Figure 1). The pre-pandemic
                        S&P 500 made a new all-time-high on
                        February 19 (3,393) only to free fall after
                        the first COVID case in New York City was
                        recorded on March 1. The Fed jumped in
                        immediately, eventually cutting rates to
                        zero and enacting more stimulus by the
                        end of March than it did over the first 12 Table 1: Index Returns
                        months of the 2008-2009 Financial Crisis.
                        Nevertheless, the S&P 500 crashed fast,
                        bottoming on March 23 down 34% from
                        the all-time-high made the prior month.
                        On March 27, the CARES Act authorized
                        almost $2 trillion in direct aid (9% of 2019
                        GDP). These two unprecedented actions
                        marked the largest monetary and fiscal
                        stimulus package in U.S. history and Source for Figure 1: CB&T; Thomson Reuters | Source for Table 1: Informa & Bloomberg
                        formed the basis for a strong market recovery in the second and third quarters. Concerns over a contested
                        election result erased gains in October. The market rallied on the approval of highly-effective vaccines from
                        Pfizer and Moderna after the election. Passage of a $908 billion stimulus package in last days of 2020 helped
                        the market to finish on an all-time-high.
                        4Q20 Rotation Reverses Many Extreme Dislocations : Contrary to many bear markets, U.S. large cap
                        growth stocks significantly outperformed most asset classes in the first half of the year, outperforming value
                        stocks by 30%. Despite the rebound in April, the average S&P 500 stock was underperforming the index by
                        12 percentage points in early May. Many of the financial, staples, consumer discretionary, industrial, energy,
                        and materials stocks remained in bear market territory, or down more than 20%. Furthermore, small, mid-cap,
                        international and emerging market equities trailed the S&P by 12% to 14%. After the vaccine announcement,
                        investors rotated into asset classes and industry sectors that were out of favor for the first three quarters of

                       Please Note: Statements made in this commentary are drawn from Commonwealth’s internal research and with the permission of outside
                       research providers. The content of this commentary is copyrighted and reproduction or distribution of this material is prohibited and all rights
    Page 1             are reserved. Nothing herein should be construed as a prediction or guarantee of either investment results or account specific actions. NOT FDIC
                       INSURED / NOT BANK GUARANTEED / MAY LOSE VALUE / NOT GUARANTEED BY ANY GOVERNMENT AGENCY / NOT A BANK DEPOSIT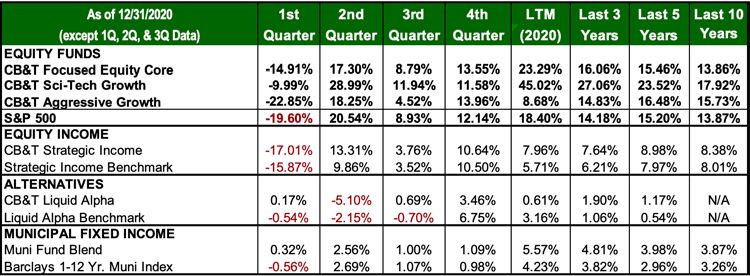
4Q 2020 Review & 2021 Outlook

the year. Small cap, midcap, international and emerging markets                                 Figure 2: Low Quality Stocks Rally on Vaccine News
outperformed the S&P 500 large cap index in the fourth quarter.
Small cap and emerging markets stock performance ended the year
ahead of or in line with the S&P 500, 19.9% and 18.3% vs. 18.4%,
respectively (please see Table 1). Performance of growth stocks
outpaced value stocks earlier in the year, but underperformed value
in the fourth quarter.
Table 2: Sector Returns

Source for Table 2: Informa & Bloomberg

CB&T’S PANDEMIC RESPONSE:                                                                       Source: The Daily Shot, Goldman Sachs
Generating Higher Returns for Clients
                                                                                                and in early 2021. All of these asset classes outperformed the large
CB&T’s client portfolios outperformed in the downturn and sustained                             cap S&P 500 index in the fourth quarter (please see Table 1). Small,
that outperformance through the end of the year. Our investment                                 mid-cap emerging market stocks outperformed large cap stocks
style focuses on buying Quality Growth (companies) at a Reasonable                              during the last nine months of the year.
Price or allocating to managers that invest in these companies.
Quality growth companies include many tech, healthcare, consumer                                Capitalizing on “Fat Pitches”: We look for significant dislocations
and communications firms with large net cash positions, whereas                                 or “Fat Pitches” in asset class values that present a rare profit
value companies often carry significant debt. Many of these                                     opportunity for client portfolios. As in prior crises, high yield and
businesses have been less impacted by the pandemic and in some                                  municipal bonds (munis) sold off sharply setting up a “fat pitch”. We
cases benefited. The S&P 500 growth index outperformed the                                      executed a heavy allocation swap from investment grade to high
S&P 500 value index by 30% through the third quarter, but lower                                 yield and muni bonds or taxable munis in client accounts and the
quality value companies started to outperform after a vaccine was                               pivot was a home run. The muni position generated a 10% to 12%
announced in the fourth quarter (please see Figure 2)..                                         return and the high yield position returned 16% to 18% for accounts
                                                                                                on average, before we closed these positions in late August and early
Rebalancing to Lagging Asset Classes: The rebalancing initiatives                               September.
we took in March and early April, when we bought equities that
had sold off more than 20%, paid off for our customers in 2020. By                              CB&T Common Trust Fund Results: Most of our ideas for individual
May, other market dispersions reached record levels and we made                                 portfolios come from our management of common trust funds
additional advantageous reallocations to portfolios. Initially, U.S.                            (CTFs). Our CTFs delivered significant outperformance in 2020 with
mega cap growth stocks led the recovery by a wide margin, but we                                lower volatility than their indices.
expected other asset classes to catch up and narrow this gap into year                          COVID & RE-OPENING: Surge Begins to
end. For instance, the average S&P 500 stock was underperforming                                Decline in February; Herd Immunity by End
the index by 12 percentage points in early May. We swapped a                                    of 2Q21
portion of large cap holdings for the S&P 500 “equal weight” index
(RSP). The RSP outperformed the S&P by 6 percentage points in the                               The holidays and possibly a more virulent strain of COVID led to a
last half of the year. Small, mid-cap, international and emerging                               surge in cases and hospitalizations in December and January forcing
market equities trailed the S&P by 12% to 14% at the end of the first                           further shutdowns of institutions, businesses and activities across
quarter. We have been adding weight to these asset classes in 2020                              states (please see Figure 3). Problems with last-mile logistics have

 Please Note: Statements made in this commentary are drawn from Commonwealth’s internal research and with the permission of outside research providers. The content of this
 commentary is copyrighted and reproduction or distribution of this material is prohibited and all rights are reserved. Nothing herein should be construed as a prediction or guarantee of
 either investment results or account specific actions. NOT FDIC INSURED / NOT BANK GUARANTEED / MAY LOSE VALUE / NOT GUARANTEED BY ANY GOVERNMENT AGENCY / NOT A BANK DEPOSIT

502.259.2500 | cbandt.com                                                                                                                              Winter 2021 | Page 2
4Q 2020 Review & 2021 Outlook
                                                                                                 Figure 3: COVID Cases Surge over Holidays
 also placed the rollout of immunizations behind schedule. As a
 result economic data for December and January are retreating from
 recent sequentially improving levels, albeit well ahead of forecasts
 made last spring. Cases and hospitalizations are rolling over and
 immunization logistics are improving in mid-January. We expect
 cases and hospitalizations to decline from surge levels in February.
 Despite the disappointing pace of vaccine rollout, models estimate
 the death rate will decline rapidly in coming months (please see
 Figure 4). Epidemiologists believe that 20% of the population has
 been exposed. Even with the slower than expected pace of the early
 vaccine rollout, most experts believe 40% of the population can
 be inoculated by the end of June, which would bring the U.S. near
 the level of herd immunity (60%). We cannot accurately predict the
 timing and magnitude of how the U.S. economy will re-open. Since
 roughly 95% of the U.S. economy was estimated to have been open
 in the fall of 2020 without a vaccine, we would expect 95% to 100%
 of the economy to re-open by the end of summer with hopes for a                                 Figure 4: Death Rate will Drop Faster than Expected
 full re-opening by year end. If death rates fall precipitously by the
 end of March as predicted, it may prompt a stronger re-opening
 sooner.
 MARKET OUTLOOK: Market Melt Up
 Continues, If Fed Can Maintain Rates Near Zero
 Extraordinary low interest rates are supporting high valuations
 for stocks and other assets. Until the economy is restored to full
 employment, the Fed intends to keep rates at current levels. As
 long as short term rates remain near zero (Zero Interest Rate Policy
 or “ZIRP”), we believe equity markets will continue to “melt up” into
 valuations that look high relative to historical multiples (e.g. forward
 P/E multiples > 20x). Troubling for investors, forward earnings

    Table 3: CB&T Common Trust Fund Returns                                                      Source for Figures 3 & 4 : The Bespoke Group

    Source for Table 3: Informa & Bloomberg
 Please Note: Statements made in this commentary are drawn from Commonwealth’s internal research and with the permission of outside research providers. The content of this
 commentary is copyrighted and reproduction or distribution of this material is prohibited and all rights are reserved. Nothing herein should be construed as a prediction or guarantee of
 either investment results or account specific actions. NOT FDIC INSURED / NOT BANK GUARANTEED / MAY LOSE VALUE / NOT GUARANTEED BY ANY GOVERNMENT AGENCY / NOT A BANK DEPOSIT

502.259.2500 | cbandt.com                                                                                                                              Winter 2021 | Page 3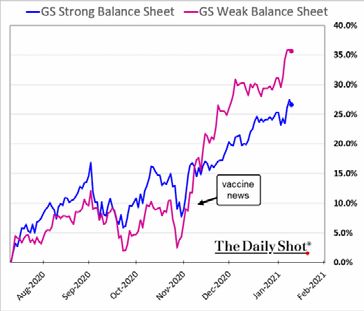
4Q 2020 Review & 2021 Outlook

  Figure 5: Employment Recovery                                                                  governors have stated that the Fed is willing to sustain a period of
                                                                                                 3% inflation readings. The move signals that the Fed will not remain
                                                                                                 on autopilot with traditional inflation policy, lowering the risk of
                                                                                                 raising rates before the economy and employment have recovered,
                                                                                                 which can result in stagflation. Easy monetary policy is probably the
                                                                                                 strongest support for increasing market returns.

                                                                                                 Biden Committed to Massive Fiscal Policy: In March the
                                                                                                 government enacted $2 trillion in legislation to fund vaccine
                                                                                                 development, the manufacturing for ventilators and protective
                                                                                                 medical equipment, direct payments to individuals, forgivable
                                                                                                 loans to businesses (PPP) and extended/enhanced unemployment
                                                                                                 insurance support. Following more than six months of partisan
                                                                                                 bickering and political theater, Congress enacted an additional
  Figure 6: U.S. Stimulus Exceeds Other Economics                                                $900 billion in stimulus funding similar programs in December. On
                                                                                                 January 14, President-elect Biden introduced a $1.9 trillion spending
                                                                                                 proposal to increase and extend benefits until the end of September
                                                                                                 2021. If the Biden proposal is enacted, the government will spend
                                                                                                 $4.8 trillion in stimulus over 18 months or roughly 23% of 2019’s $21
                                                                                                 trillion in GDP. GDP is estimated to have fallen between 2.5% and
                                                                                                 3.5% in 2020, which is much less than the 5.7% drawdown estimated
                                                                                                 in April. Assuming herd immunity is reached by the end of the first
                                                                                                 quarter and almost all of the economy is reopened, we estimate
                                                                                                 that $2.8 trillion new stimulus could overshoot the output gap to
                                                                                                 restore the economy to 2019 levels by $400 to $900 billion. On one
                                                                                                 hand, the large stimulus would be extremely bullish for corporate
                                                                                                 earnings, consumer spending and the market. On the other hand,
   Source for Figures 5 & 6: Moody’s Analytics                                                   overshooting the output gap by 2% to 4% of GDP could result in
                                                                                                 inflation or other unintended consequences (e.g. asset bubbles,
  multiples in excess of 20x are often reached ahead of bear market
                                                                                                 stagflation, etc.).
  (20%+) corrections. While “this time may not be different”, we
  believe there are several factors including those discussed below                              Speed of Recovery Exceeding Estimates: Economic results for
  that could put off such a correction for most of this year or longer                           2020 did not turn out as dire as predicted in March and April. Most
  and lead us to recommend staying the course in equities.                                       importantly, unemployment finished significantly lower at 6.7%,
                                                                                                 but better than early estimates of 9.0% or higher. Additionally, GDP,
  Fed Committed to ZIRP Monetary Policy: The Fed continues to
                                                                                                 manufacturing, and housing have all surprised to the upside. The
  stand by its assertion that it expects to keep rates near zero until
                                                                                                 recent COVID surge and increased unemployment benefits have
  at least the end of 2023. The Fed’s “dual mandate” is “to promote
                                                                                                 caused jobless claims to increase in December and January, but
  goals of maximum employment and stable prices [inflation].”
                                                                                                 are expected to decline in February. We expect economic data
  During the current economic downturn the Fed has made clear that
                                                                                                 to continue to surprise to the upside after January for at least the
  it is strongly committed to restoring full employment. Comments
                                                                                                 remainder of the first half of 2021, until year over year comparisons
  and testimony made by Fed Chairman Powell also indicate a focus
                                                                                                 become more difficult in the second half. With help from Asia,
  on restoring employment to a level where relative wages improve
                                                                                                 global GDP is recovering faster than U.S. GDP (please see Figure7).
  more broadly for U.S. citizens in rural areas and in lower income
                                                                                                 Since about 40% of S&P 500 revenues is generated overseas, global
  brackets. Furthermore, Biden’s choice of Janet Yellen as Treasury
                                                                                                 recovery and a weaker dollar should boost earnings for many S&P
  Secretary further indicates an emphasis on broader employment
                                                                                                 500 heavyweights.
  and income initiatives. Some of Yellen’s economic research papers
  at Berkeley/Haas focused on income inequality and she is viewed                                Incremental Market Flows Resulting from Increased Savings:
  as a leader in unemployment and labor market economic research.                                Even though many lost their jobs and income during the pandemic
  The Fed declared it would relax its inflation target of 2% and permit                          lockdowns, the net savings rate in the U.S. increased significantly.
  inflation to rise higher, or “run hot”. In recent speeches some Fed                            Untargeted helicopter stimulus checks of $1,200 were paid to
 Please Note: Statements made in this commentary are drawn from Commonwealth’s internal research and with the permission of outside research providers. The content of this
 commentary is copyrighted and reproduction or distribution of this material is prohibited and all rights are reserved. Nothing herein should be construed as a prediction or guarantee of
 either investment results or account specific actions. NOT FDIC INSURED / NOT BANK GUARANTEED / MAY LOSE VALUE / NOT GUARANTEED BY ANY GOVERNMENT AGENCY / NOT A BANK DEPOSIT

502.259.2500 | cbandt.com                                                                                                                              Winter 2021 | Page 4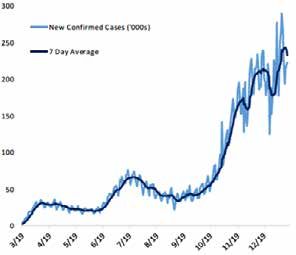
4Q 2020 Review & 2021 Outlook
 Figure 7: Global GDP Recovery in 2021?                                                          and economy on lock down, consumers had less opportunity to
                                                                                                 spend, particularly on services, restaurants, travel, etc. The net result
                                                                                                 has been a surge in savings, which found its way into markets (please
                                                                                                 see Figures 8 and 9). Discount and on-line brokers experienced
                                                                                                 record account openings and on peak trading days in 2020 trading
                                                                                                 volume from individuals accounted for 25% of trading volume vs.
                                                                                                 10% in 2019. It is estimated that $1 trillion in excess savings was
                                                                                                 created prior to the $900 billion stimulus package in December. It
                                                                                                 is possible the $900 billion and $1.9 trillion stimulus, if passed, could
                                                                                                 result in an additional $1 trillion of excess savings to flow into the
                                                                                                 market via retail investors further supporting a market melt-up.

                                                                                                 What Can Derail the Melt-Up in 2021?: We think interest rates
                                                                                                 are the key to market stability for 2021. We believe the market will
                                                                                                 correct if short term rates rise materially or the 10-year treasury
 Figure 8: Possibly $2 Trillion in Excess Savings                                                starts to rise above 1.50%. The market could also correct if the
                                                                                                 Biden administration enacts some of the campaign policies that
                                                                                                 were business or market unfriendly such as those targeted towards
                                                                                                 increasing capital gains and corporate taxes and reducing tax
                                                                                                 deductibility of contributions to 401Ks and IRAs.
                                                                                                 Why do higher rates result in a market correction? A stock price
                                                                                                 represents the future cash flow, earnings and value creation
                                                                                                 discounted back at a risk-appropriate rate for that stock. A market
                                                                                                 index such as the S&P 500 represents the weighted sum of those
                                                                                                 valuations. Price-to-earnings (P/E) and other stock valuation
                                                                                                 multiples are short-hand methods to apply the risk appropriate
                                                                                                 discount rate. That discount rate is made up of the risk-free rate,
 Figure 9: Record Trading for On-line/Discount Brokers                                           usually the 10-year treasury rate or the short-term T-bill rate plus
                                                                                                 an equity risk premium appropriate for the risks related to a given
                                                                                                 company or stock. A P/E multiple is the inverse of the discount
                                                                                                 rate. If the 10-year treasury is 1.0% and the equity risk premium for
                                                                                                 a tech stock is 4.0%, the discount rate would be 5.0%. This would
                                                                                                 equate to a 20.0x P/E multiple (1/0.05 = 20.0). If the 10-year treasury
                                                                                                 rises to 1.50% and is expected to remain at that level, the discount
                                                                                                 rate rises to 5.50% and the P/E multiple falls to 18.2x, which could
                                                                                                 mathematically cause the stock to fall 9%. Collectively, if the market
                                                                                                 trades at 20.0x, the market could also correct by 9%.

                                                                                                 We see three scenarios below that could cause rates to rise to
                                                                                                 levels that could create a market correction:
                                                                                                 1. Unemployment, wages and other fundamental economic
                                                                                                    factors recover much stronger and faster than expected,
                                                                                                    so the Fed decides to raise short-term rates unexpectedly.
                                                                                                    We think this scenario is unlikely in 2021. Its guidance indicate
 Source for Figures 7 & 8: Morgan Stanley | Source for Figure 9: The Daily Shot
                                                                                                    that the Fed believes that fundamental labor and economic
 individuals making less than $75,000 and up to $2,400 to couples                                   improvements will not be achieved until 2023.
 making less than $150,000, even if still employed. In most states,
 unemployment benefits were as much as 50% higher than average                                   2. Inflation, possibly resulting from fiscal stimulus policies, surges
 earnings and in many cases unemployment wages were more than                                       past 3% and appears to be running out of control for a sustainable
 those paid by the lost or furloughed job. With much of the population                              period. In this worst-case circumstance, inflation could force the

 Please Note: Statements made in this commentary are drawn from Commonwealth’s internal research and with the permission of outside research providers. The content of this
 commentary is copyrighted and reproduction or distribution of this material is prohibited and all rights are reserved. Nothing herein should be construed as a prediction or guarantee of
 either investment results or account specific actions. NOT FDIC INSURED / NOT BANK GUARANTEED / MAY LOSE VALUE / NOT GUARANTEED BY ANY GOVERNMENT AGENCY / NOT A BANK DEPOSIT

502.259.2500 | cbandt.com                                                                                                                              Winter 2021 | Page 5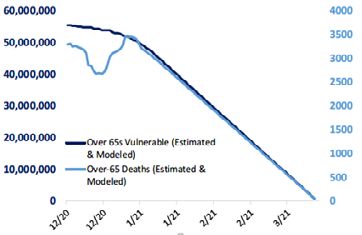
4Q 2020 Review & 2021 Outlook
Figure 10: Largest Tax Increase since LBJ Biden’s Tax Policies Could Also Derail the Market: We remain
concerned that Biden could introduce or enact substantial tax and
spending campaign policies prematurely in 2021. Additionally, Biden
has started to reverse executive orders that relaxed costly Obama-era
regulatory restraints. Even with a 50/50 Senate, tax policies cannot
be legislated independently and will have to be part of budget
reconciliation or continuous resolution bills. We would expect tax
and spending legislation as well as tighter regulatory constraints to
be introduced after a strong recovery in the U.S. economy, which we
think takes until 2022.
Biden’s campaign tax policy would be the largest tax increase
since LBJ established “The Great Society” Medicaid and Medicare
Figure 11: Large Tax Increase + Larger Spending = $2T Deficit programs and permanently boosted social security benefits (please
see Figures 10 and 11). The policy fails to fund $2 trillion of spending
over ten years. Only about $2 trillion of the $7 trillion spending
proposal invests in productivity enhancing policies, and also
disincentivize capital formation for future investment.
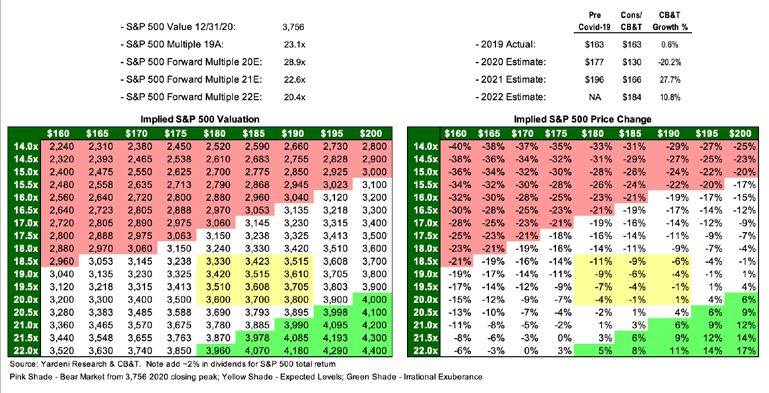
Valuations Stretched, but Few Stocks in Bubble Territory: On
the surface, valuations for the S&P 500 large cap and other indices
look stretched. If one digs a little deeper, however, the analysis shows
that valuations are within reason even for the large tech names and
more reasonable for the median S&P 500 stock (18.7x 2022 P/E).
We believe market volatility leading to a significant correction (>10%)
Source for FIgures 10 & 11: The Daily Shot, Goldman Sachs, U of Pennsylvania led by inflation fears or Biden policies are not likely to lead to a bear
market as long as the Fed remains accommodative. Nevertheless,
Fed’s hand. This seems unlikely given demographics, economic certain industries and stocks are in bubble territory: Electric vehicles
growth and inflation trends of the last few decades. Inflation (EV) and the EV supply chain companies, CRSPR stocks, recent
has not been able to reach 3% in over 25 years, even when the tech IPOs, and COVID stay-at-home stocks (please see Tables 6-9).
Fed wanted to reach those levels to jump start the economy Valuations for some of these stocks are reminiscent of the 1999 to
after the financial crisis. Nevertheless, if this were to happen it 2000 dotcom tech bubble. Furthermore, these stocks are also among
would likely put the brakes on economic growth and usher in the most frequently owned by retail and on-line investors. Some of
a period of stagflation (high inflation with stagnant economic the companies are trading at 20x forward revenues and many are
growth). We think this scenario is least likely, but it could carry not yet profitable. We think a strong period of volatility or significant
the highest probability for a bear market correction (20%+) of correction could pop these asset bubbles causing the stocks to be
the three scenarios. re-rated to more sensible valuations. While valuations are stretched
3. Inflation fears (investor sentiment), likely resulting from for some of the tech giants, their valuations are more reasonable
increasingly higher inflation readings, leads to a sell-off in given their competitive advantages, high profit margins, strong free
Treasuries causing short term and/or long-term rates to rise cash flow generation, and clean balance sheets.
significantly higher. We think this is the most likely of the three Trying to value the market at already stretched valuations presents
scenarios that could cause rates to rise in 2021 and could lead additional challenges. From an inflexible fundamental basis, the S&P
to a short-term, but significant market correction (5% to 15%). 500 has little upside beyond 3,800 (based on consensus earnings
This would likely be manageable via monetary policy and the estimates) - roughly a 3% total return expectation including
Fed could step up targeted purchases of bonds to bring rates dividends. We expect the market to melt up beyond current
back to targets. We would probably buy this dip. We also think fundamental valuations for the next 6 to 12 months as the economy
this scenario may be the catalyst to burst bubbles that have recovers. If the S&P 500 is trading at 20.4x 2022 aggregate estimated
developed in certain parts of the market (please see “Valuations earnings of $184 and the median S&P 500 company is trading at 18.7x,
Stretched, but Few Stocks in Bubble Territory” below). we believe this valuation gap is likely to close as investors rotate into
Please Note: Statements made in this commentary are drawn from Commonwealth’s internal research and with the permission of outside research providers. The content of this
commentary is copyrighted and reproduction or distribution of this material is prohibited and all rights are reserved. Nothing herein should be construed as a prediction or guarantee of
either investment results or account specific actions. NOT FDIC INSURED / NOT BANK GUARANTEED / MAY LOSE VALUE / NOT GUARANTEED BY ANY GOVERNMENT AGENCY / NOT A BANK DEPOSIT
502.259.2500 | cbandt.com Winter 2021 | Page 64Q 2020 Review & 2021 Outlook
Table 4: S&P 500 Valuation
stocks that have lagged for the last year. If median or lower valued
stocks approached a 20.0x valuation and most other stocks hold Table 5: Mega-Cap S&P 500 Stocks vs. the Median Stock
their value as additional funds flow into the market, the S&P 500
could rise by 10% to 4,130. An increase to fundamental earnings
estimates is another area of potential market support. Companies
have been raising guidance and analysts have been raising estimates
as fundamental economic data surprised to the upside in the third
and fourth quarters. Some of the increase in estimates appear
legitimate. Other increases appear to be calibrated to justify a buy
rating on a stock valuation that has overshot its estimates. Large Table 6: Electric Vehicles / Hydrogen / Clean Energy
brokerages and trading desks (wire houses) are in the business to sell
and trade securities. We are already seeing 2022 market estimates
raised above $200 for the S&P 500 by two of the large wire houses. If
the 2022 market multiple remains 20.4x and estimates rise to $200,
the market could rise to 4,080 (8.6%).
Recommendations: The current economic, political and market
backdrop is challenging for asset allocation. Several equity asset
classes have reached stretched valuations. Meanwhile, investing in
fixed income markets is particularly difficult as the Fed maintains
a focus on keeping short-term rates near zero. Money markets
yield around 0.01% as they did after the financial crisis. Ten-year
treasury rates are near 1.00%, so traditional bonds likely offer less Source for Tables 5 & 6: CB&T and Thomson Reuters
ource forPlease
FIguresNote:
10 & 11:Statements made
The Daily Shot, in thisSachs,
Goldman commentary are drawn from Commonwealth’s internal research and with the permission of outside research providers. The content of this
U of Pennsylvania
commentary is copyrighted and reproduction or distribution of this material is prohibited and all rights are reserved. Nothing herein should be construed as a prediction or guarantee of
either investment results or account specific actions. NOT FDIC INSURED / NOT BANK GUARANTEED / MAY LOSE VALUE / NOT GUARANTEED BY ANY GOVERNMENT AGENCY / NOT A BANK DEPOSIT
502.259.2500 | cbandt.com Winter 2021 | Page 74Q 2020 Review & 2021 Outlook
Table 7: Recent IPOs S&P 500 is trading closer to historical norms, when adjusted for
low risk-free rates, versus the mega cap tech and communications
stocks. Those mega caps are trading within the bounds of reason
considering their growth rates, pricing power, profitability and net
cash positions versus stocks we view at bubble valuations. Adjusted
for earnings growth, mega cap tech stocks are less expensive than
the median S&P 500 stock (please see Table 5). Nevertheless, for
the next 6 to 12 months, we are incrementally reallocating to value
stocks over growth stocks, preferring quality cyclical and “re-open”
names. Periods of economic acceleration correspond to quicker
earnings growth for value stocks, which are typically rebuilding
off of depressed levels. Financials, industrials, energy and other
Table 8: Stay-at-Home Stocks
sectors are still down or trailing since the March sell-off. Small,
mid-cap and emerging market stocks caught up to the S&P 500
at year end and are leading it in 2021. International stocks and the
median S&P 500 stock significantly lagged U.S. large cap returns at
year end. Selectively rotating into lagging asset classes and sectors,
particularly those that may get a boost from a vaccine / re-opening
scenario, created incremental returns for our portfolios last year and
should generate stronger returns over the next six to twelve months.
Small cap and international indices have substantial underweights
in healthcare and tech names versus the S&P 500. Accordingly, these
Table 9: CRSPR equity classes have heavier weights to cyclical and value relative to
large-cap benchmarks.
We believe the growth prospects of select emerging markets and a
lower dollar will make them more attractive than equities of most
advanced international economies. We have been increasing our
allocation to emerging markets. Furthermore, we have been adding
Source for Tables 7, 8 & 9: CB&T and Thomson Reuters to emerging market bond allocations, which look like a better risk/
reward than high yield or advanced economy bonds. As the yield
diversification protection from an equity bear market. Stimulus and curve steepens, we have been reducing the duration of our fixed
Biden polices are inflationary, but inflation may not be able to make income holdings.
a sustainable surge past 3% if it takes several years for employment
to recover. Nevertheless, inflation will likely rise and even a little
upward pressure on rates at these low levels can result in material
losses for bonds of longer duration. The market is back to the “There
Is No Alternative” aka “TINA” scenario. This time rates are lower than
after the financial crisis and fixed income presents higher potential
risk, giving investors little choice than to allocate more to equities
and other risk assets. Furthermore, active monetary stimulus coupled
with fiscal stimulus should continue to act like a “put” option, which
limits the downside risk of a security. In this case, the Fed Put is
expected to “put” a floor in the overall stock market. Nevertheless,
an active Fed, would probably limit a pull back to around the 3,200
level (-15%). Given the low expected returns for bonds and inflation
risk, we think investors will be better off remaining in equity markets.
As previously discussed there are pockets of opportunity within
equity markets. For instance, the average large cap stock in the
Please Note: Statements made in this commentary are drawn from Commonwealth’s internal research and with the permission of outside research providers. The content of this
commentary is copyrighted and reproduction or distribution of this material is prohibited and all rights are reserved. Nothing herein should be construed as a prediction or guarantee of
either investment results or account specific actions. NOT FDIC INSURED / NOT BANK GUARANTEED / MAY LOSE VALUE / NOT GUARANTEED BY ANY GOVERNMENT AGENCY / NOT A BANK DEPOSIT
502.259.2500 | cbandt.com Winter 2021 | Page 84Q 2020 Review & 2021 Outlook
ASSET ALLOCATION OUTLOOK
LAST QUARTER THIS QUARTER
WE BELIEVED → ACTIONS TAKEN → RESULTS WE BELIEVE → ACTIONS WE ARE TAKING
DOMESTIC EQUITIES DOMESTIC EQUITIES
We believed that small and mid- We maintained model weights Large Cap +12.1% underper- We believe that small and mid- We have been increasing model
cap stocks will close much of the for small and mid-cap stocks and formed small +31.4% and mid-cap cap stocks will continue to out weights in 1Q21.
performance gap with large cap let positions drift beyond targets +24.4%. Small cap outperformed perform large cap stocks in the
stocks in the next 6 - 12 months. as the asset classes outperformed the S&P 500 for 2020 20.0% vs. next 6 - 12 months.
in 4Q. 18.4%.
INTERNATIONAL EQUITIES INTERNATIONAL EQUITIES
We believed the dollar would re- We maintained our international International equities (+16.1%) and As the dollar remains lower, we We are increasing our internation-
mains lower and EM would show and EM weights. We let positions EM (+19.7%) outperformed U.S. believe that EM should continue al and EM allocations in 1Q21.
strong recovery and developed drift beyond targets as the asset large cap as the dollar declined. EM to outperform and developed
international will have a period classes outperformed in 4Q. results were in line with (18.3%), international will have a period of
of catch up to U.S. indices. We but developed international under- catch up to U.S. indices. We expect
expect active managers with performed U.S. large cap (18.4%) in active managers with skillful
skillful security selection will 2020. Our developed international security selection will outperform
outperform indices. and EM selections outperformed indices.
the S&P 500 and their benchmarks
during 2020.
FIXED INCOME FIXED INCOME
We continue to believe the Fed We cut our exposure to high yield The BBG Aggregate returned The Fed will keep rates low until As the 10-year rises above 1.0%
will keep rates low until 2023. with a 16%-18% average profit in +0.7%. Local currency interna- 2023. It relaxed its inflation policy, on stimulus expectations, we are
Returns likely between 1% and portfolios. We have a little weight tional and emerging market bonds which enables Fed to use judg- lowering the duration of our fixed
2% for core investment grade via shorter duration high yield. gained 3.3% and 8.2%, respective- ment on raising rates as inflation income portfolios.
bonds. We increased weight to EM bonds ly. Our bond selections significantly rises. Returns likely between 1%
and changed exposure from outperformed the aggregate bond and 2% for core investment grade
hedged to local currency as the index during the quarter. bonds.
dollar dropped.
We think munis are about equally We started reducing an Munis outperformed core bonds in We think munis are about equally We are continuing to reduce
attractive investment grade overweight to munis during the the quarter (+1.8% vs. +0.7%) on attractive investment grade muni exposure, but most will be
bonds, considering the risks. quarter. We still held some munis an absolute basis and tax-effective bonds, considering the risks. reduced in early April once gains
so as not to recognize short-term basis. Our fixed income selections become long-term.
gains. outperformed the benchmark.
ALTERNATIVE ASSETS ALTERNATIVE ASSETS
We believed volatility will remain We maintained a 10% allocation Our alternatives funds generated We believe volatility will remain We are maintaining our 10%
elevated as new COVID cases rise, to alternative strategies. reasonable returns (appx 3% for elevated as new COVID cases allocation and continue to focus
through the November election, the quarter) despite close to zero remain elevated, the vaccine is on strategies with no structural
and/or until a coronavirus vaccine exposure to the stock market, as rolled out, and new stimulus is correlation to equities. We expect
is widely available. the market rallied but volatility introduced. near term deflation due to growth
remained elevated. stalled by COVID. Longer term
inflation risks are rising upon
recover due to record monetary &
fiscal policy.
For more details on CBandT’s investment outlook, please visit our Investment Commentary page at: https://cbandt.com/wealth-trust/resources/.
Please Note: Statements made in this commentary are drawn from Commonwealth’s internal research and with the permission of outside research providers. The content of this
commentary is copyrighted and reproduction or distribution of this material is prohibited and all rights are reserved. Nothing herein should be construed as a prediction or guarantee of
either investment results or account specific actions. NOT FDIC INSURED / NOT BANK GUARANTEED / MAY LOSE VALUE / NOT GUARANTEED BY ANY GOVERNMENT AGENCY / NOT A BANK DEPOSIT
502.259.2500 | cbandt.com Winter 2021 | Page 9You can also read