A General Method to Find Highly Coordinating Communities in Social Media through Inferred Interaction Links
←
→
Page content transcription
If your browser does not render page correctly, please read the page content below
Social Network Analysis and Mining manuscript No.
                                        (will be inserted by the editor)

                                        A General Method to Find Highly Coordinating
                                        Communities in Social Media through Inferred
                                        Interaction Links

                                        Derek Weber · Frank Neumann

                                        Received: date / Accepted: date
arXiv:2103.03409v1 [cs.SI] 5 Mar 2021

                                        Abstract Political misinformation, astroturfing and organised trolling are online
                                        malicious behaviours with significant real-world effects. Many previous approaches
                                        examining these phenomena have focused on broad campaigns rather than the
                                        small groups responsible for instigating or sustaining them. To reveal latent (i.e.,
                                        hidden) networks of cooperating accounts, we propose a novel temporal window
                                        approach that relies on account interactions and metadata alone. It detects groups
                                        of accounts engaging in various behaviours that, in concert, come to execute dif-
                                        ferent goal-based strategies, a number of which we describe. The approach relies
                                        upon a pipeline that extracts relevant elements from social media posts, infers
                                        connections between accounts based on criteria matching the coordination strate-
                                        gies to build an undirected weighted network of accounts, which is then mined
                                        for communities exhibiting high levels of evidence of coordination using a novel
                                        community extraction method. We address the temporal aspect of the data by
                                        using a windowing mechanism, which may be suitable for near real-time appli-
                                        cation. We further highlight consistent coordination with a sliding frame across
                                        multiple windows and application of a decay factor. Our approach is compared
                                        with other recent similar processing approaches and community detection meth-
                                        ods and is validated against two relevant datasets with ground truth data, using
                                        content, temporal, and network analyses, as well as with the design, training and
                                        application of three one-class classifiers built using the ground truth; its utility is
                                        furthermore demonstrated in two case studies of contentious online discussions.
                                        D.C. Weber
                                        School of Computer Science,
                                        University of Adelaide /
                                        Defence Science and Technology Group
                                        Adelaide, South Australia, Australia
                                        ORCID ID: 0000-0003-3830-9014
                                        E-mail: derek.weber@{adelaide.edu.au,dst.defence.gov.au}
                                        F. Neumann
                                        School of Computer Science,
                                        University of Adelaide
                                        Adelaide, South Australia, Australia
                                        ORCID ID: 0000-0002-2721-3618
                                        E-mail: frank.neumann@adelaide.edu.au
2                                                        Derek Weber, Frank Neumann

Keywords Coordinated Behaviour · Online Social Networks · Influence
Operations

1 Introduction

Online social networks (OSNs) have established themselves as flexible and accessi-
ble systems for activity coordination and information dissemination. This benefit
was illustrated during the Arab Spring (Carvin 2012) but inherent dangers are in-
creasingly apparent in ongoing political interference and disinformation (Bessi and
Ferrara 2016; Howard and Kollanyi 2016; Ferrara 2017; Keller et al. 2017; Neudert
2018; Morstatter et al. 2018). Modern information campaigns are participatory
activities, which aim to use their audiences to amplify their desired narratives,
not just receive it (Starbird et al. 2019). Through cyclical reporting (i.e., social
media feeding stories and narratives to traditional news media, which then sparks
more social media activity), social media users can unknowingly become “unwit-
ting agents” as “sincere activists” of state-based operations (Starbird and Wilson
2020). The use of political bots to influence the framing and discussion of issues in
the mainstream media (MSM) remains prevalent (Bessi and Ferrara 2016; Woolley
2016; Woolley and Guilbeault 2018; Rizoiu et al. 2018). The use of bots to am-
plify individual voices above the crowd, known as the megaphone effect, requires
coordinated action and a degree of regularity that may leave traces in the digital
record.
    Relevant research has focused on high level analyses of campaign detection
and classification (Lee et al. 2013; Varol et al. 2017; Alizadeh et al. 2020), the
identification of botnets and other dissemination groups (Vo et al. 2017; Gupta
et al. 2019; Woolley and Guilbeault 2018), and coordination at the community
level (Kumar et al. 2018; Hine et al. 2017; Cresci 2020). Some have considered
generalised approaches to social media analytics (e.g., Lim et al. 2019; Weber 2019;
Pacheco et al. 2020b; Graham et al. 2020a; Nizzoli et al. 2020), but unanswered
questions regarding the clarification of coordination strategies remain.
    Expanding on our work presented at ASONAM’20 (Weber and Neumann
2020), we present a novel approach to detect groups engaging in potentially co-
ordinated activities, revealed through anomalously high levels of coincidental be-
haviour. Links in the groups are inferred from behaviours that, when used inten-
tionally, are used to execute a number of identifiable coordination strategies. We
use a range of techniques to validate our new technique on two relevant datasets,
as well as comparison with ground truth and a synthesized dataset, and show it
successfully identifies coordinating communities.
    Our approach infers ties between accounts to construct latent coordination net-
works (LCNs) of accounts, using criteria specific to different coordination strate-
gies. These are sometimes referred to as user similarity networks (e.g., Nizzoli
et al. 2020). The accounts may not be directly connected, thus we use the term
‘latent’ to mean ‘hidden’ when describing these connections. The inference of con-
nections is performed solely on the accounts’ activity, i.e., not their content, only
metadata and temporal information, though it could be expanded to make use of
these, similar to Pacheco et al. (2020b) and Graham et al. (2020a). Highly coordi-
nating communities (HCCs) are then detected and extracted from the LCN. We
propose a variant of focal structures analysis (FSA, Şen et al. 2016) to do this,
Finding Highly Coordinating Communities in Social Media                                3

in order to take advantage of FSA’s focus on finding influential sets of nodes in
a network, while also reducing the computational complexity of the algorithm. A
window-based approach is used to enforce temporal constraints.
    The following research questions guided our evaluation:

RQ1    How can HCCs be found in an LCN?
RQ2    How do the discovered communities differ?
RQ3    Are the HCCs internally or externally focused?
RQ4    How consistent is the HCC messaging?
RQ5    What evidence is there of consistent coordination?
RQ6    How well can HCCs in one dataset inform the discovery of HCCs in another?

    This paper expands upon Weber and Neumann (2020) by providing further
methodological detail and experimental validation, and case studies in which the
technique is applied to new real world datasets relating to contentious political
issues, as well as consideration of algorithmic complexity and comparison with
several similar techniques. Prominent among the extra validation provided is the
use of machine learning classifiers to show that our datasets contain similar co-
ordination to our ground truth, and the application of a sliding frame across the
time windows as a way to search for consistent coordination.
    This paper provides an overview of relevant literature, followed by a discus-
sion of online coordination strategies and their execution. Our approach is then
explained, and its experimental validation is presented1 . Following the validation,
the algorithmic complexity and performance of the technique is presented, two case
studies are explored, demonstrating the utility of the approach in two real-world
politically-relevant datasets, and we compare our technique to those of Pacheco
et al. (2020b), Graham et al. (2020a), Nizzoli et al. (2020) and Giglietto et al.
(2020b).

1.1 A Motivating Example

In the aftermath of the 2020 US Presidential election, a data scientist noticed a
pattern emerging on Twitter2 . Figure 1a shows a tweet by someone who was so
upset with their partner voting for Joe Biden in the election that they decided to
divorce them immediately and move to Pakistan (in the midst of the COVID-19
pandemic). This might seem an extreme reaction, but the interesting thing was
that the person was not alone. The researcher had identified dozens of similar,
but not always identical, tweets by people leaving for other cities but for the
same reason (Figure 1b). Analysis of these accounts also revealed they were not
automated accounts. This kind of pattern of tweeting identical text is sometimes
referred to as “copypasta” and can be used to give the appearance of a genuine
grassroots movement on a particular issue. It had been previously used by ISIS
terrorists as they approached the city of Mosul, Iraq, in 2014, which they took
over and occupied for several years when the local forces believed a giant army
was on its way based on the level of relevant online activity (Brooking and Singer
2016).
 1   See https://github.com/weberdc/find hccs for code and data.
 2   Tweeted 2020-11-17: https://twitter.com/conspirator0/status/1328479128908132358
4                                                            Derek Weber, Frank Neumann

     It is unclear whether this “copypasta” campaign is a deliberate information
operation, designed to damage trust in the electoral system and ability of Ameri-
cans to accept the loss of a preferred political party in elections, or simply a group
of like-minded jokers starting a viral gag or engaging in a kind of flashmob. At the
very least, it is important to be able to identify which accounts are participating
in the event, and how they are coordinating their actions.

            (a) One upset partner.                       (b) Many upset partners.

Fig. 1 Copypasta tweets noticed in the aftermath of the 2020 US Presidential election, which
may bely a coordinated campaign to undermine confidence in American society’s ability to
accept electoral outcomes, or may just be a prank similar to a flashmob.

1.2 Online Information Campaigns and Related Work

Social media has been increasingly used for communication in recent years (par-
ticularly political communication), and so the market has followed, with media
organisations using it for cheap, wide dissemination and consumers increasingly
looking to it for news (Shearer and Grieco 2019). Over that same time period,
people have begun to explore how to exploit the features of the internet and social
media that bring us benefits: the ability to target marketing to specific audiences
that connects businesses with the most receptive customers also enables highly tar-
geted non-transparent political advertising (Woolley and Guilbeault 2018) and the
ability to expose people to propaganda and recruit them to extremist organisations
(Badawy and Ferrara 2018); the anonymity that supports the voiceless in society to
express themselves also enables trolls to attack others without repercussions (Hine
et al. 2017; Burgess and Matamoros-Fernández 2016); and the automation that
enables news aggregators also facilitates social and political bots (Ferrara et al.
2016; Woolley 2016; Cresci 2020). In summary, targeted marketing and automa-
tion coupled with anonymity provide the tools required for potentially significant
influence in the online sphere, perhaps enough to swing an election.
    Effective influence campaigns relying on these capabilities will somehow coor-
dinate the actions of their participants. Early work on the concept of coordination
by Malone and Crowston (1994) described it as the dependencies between the
tasks and resources required to achieve a goal. One task may require the output of
another task to complete. Two tasks may share, and require exclusive access to, a
resource or they may both need to use the resource simultaneously.
Finding Highly Coordinating Communities in Social Media                              5

    At the other end of the spectrum, sociological studies of influence campaigns
can reveal their intent and how they are conducted, but they consider coordination
at a much higher level. Starbird et al. (2019) highlight three kinds of campaigns:
orchestrated, centrally controlled campaigns that are run from the top down (e.g.,
paid teams, Chen 2015; King et al. 2017); cultivated campaigns that infiltrate
existing issue-based movements to drive them to particular extreme positions;
and emergent campaigns arising from enthusiastic communities centred around
a shared ideology (e.g., conspiracy groups and other fringe movements). Though
their strategies differ, they use the same online interactions as normal users, but
their patterns differ.
    Disinformation campaigns effectively trigger human cognitive heuristics, such
as individual and social biases to believe what we hear first (anchoring) and what
we hear frequently and can remember easily (availability cascades) (Tversky and
Kahneman 1973; Kuran and Sunstein 1999); thus the damage is already done by
the time lies are exposed. Recent experiences of false information moving beyond
social media during Australia’s 2019-2020 bushfires highlight that identifying these
campaigns as they occur can aid OSN monitors and the media to better inform
the public (Graham and Keller 2020).
    In between task level coordination and entire campaigns, at the level of social
media interactions, as demonstrated by Graham and Keller (2020), we can directly
observe the online actions and effects of such campaigns, and infer links between
accounts based on pre-determined criteria. Relevant efforts in computer science has
focused on detecting information operations on social media via automation (Fer-
rara et al. 2016; Grimme et al. 2017; Davis et al. 2016; Cresci 2020), campaign
detection via content (Lee et al. 2013; Assenmacher et al. 2020; Alizadeh et al.
2020), URLs (Ratkiewicz et al. 2011; Cao et al. 2015; Giglietto et al. 2020b) and
hashtags (Ratkiewicz et al. 2011; Burgess and Matamoros-Fernández 2016; Varol
et al. 2017; Weber et al. 2020), temporal patterns (Chavoshi et al. 2017; Hine et al.
2017; Nasim et al. 2018; Mazza et al. 2019; Pacheco et al. 2020a), and commu-
nity detection (Vo et al. 2017; Morstatter et al. 2018; Gupta et al. 2019). Other
studies have explored how bots and humans interact in political settings (Bessi
and Ferrara 2016; Rizoiu et al. 2018; Woolley and Guilbeault 2018), including
exploring how deeply embedded bots appear in the network and their degree of
organisation (Woolley and Guilbeault 2018). There is, however, a research gap:
the computer science study of the “orchestrated activities” of accounts in general,
regardless of their degree of automation (Grimme et al. 2018; Alizadeh et al. 2020;
Nizzoli et al. 2020; Vargas et al. 2020). It must be noted that bot activity, even
coordinated activity, may be entirely benign and even useful (Ferrara et al. 2016;
Graham and Ackland 2017).
    Though some studies have observed the existence of strategic behaviour in
and between online groups (e.g., Keller et al. 2017; Kumar et al. 2018; Hine et al.
2017; Keller et al. 2019; Giglietto et al. 2020b), the challenge of identifying a broad
range of strategies and their underpinning execution methods remains relatively
unstudied.
    Inferring social networks from OSN data requires attendance to the tempo-
ral aspect to understand information (and influence) flow and degrees of activ-
ity (Holme and Saramäki 2012). Real time processing of OSN posts can enable
tracking narratives via text clusters (Assenmacher et al. 2020), but to process net-
works requires graph streams (McGregor 2014) or window-based pipelines (e.g.,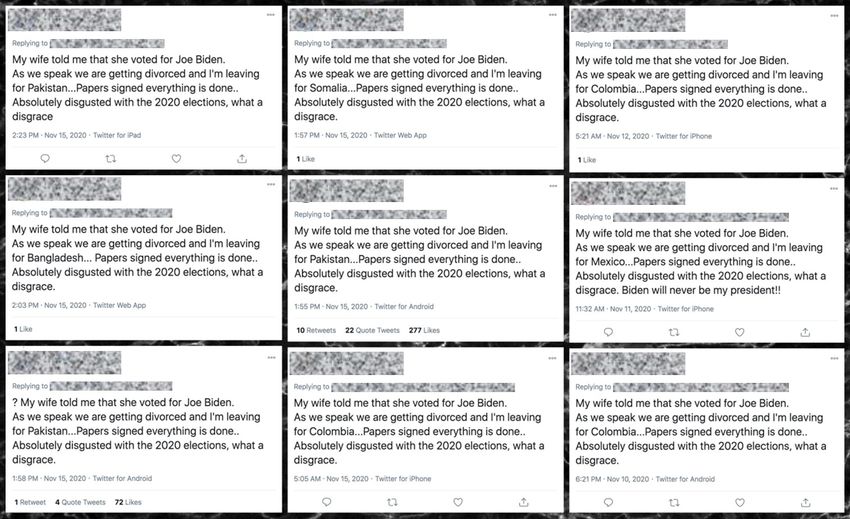
6                                                                  Derek Weber, Frank Neumann

Fig. 2 Patterns matching the mentioned coordination strategies. Green posts and avatars are
benign, whereas red or maroon ones are malign.

Weber 2019), otherwise processing is limited to post-collection activities (Graham
et al. 2020a; Pacheco et al. 2020b).
    This work contributes to the identification of strategic coordination behaviours,
along with a general technique to enable detection of groups using them.

2 Coordination Strategies

Online influence relies on two primary mechanisms: dissemination and engage-
ment. For example, an investigation of social media activity following UK ter-
rorist attacks in 20173 identified accounts promulgating contradictory narratives,
inflaming racial tensions and simultaneously promoting tolerance to sow division.
By engaging aggressively, the accounts drew in participants who then spread the
message.
    Dissemination aims to maximise audience, to convince through repeated ex-
posure and, in the case of malicious use, to cause outrage, polarisation and confu-
sion, or at least attract attention to distract from other content.
    Engagement is a subset of dissemination that solicits a response. It relies
on targeting individuals or communities through mentions, replies and the use of
hashtags as well as rhetorical approaches that invite responses (e.g., inflammatory
comments or, as present in the UK terrorist example above, pleas to highly popular
accounts).
    A number of online coordination strategies have been observed in the literature
making use of both dissemination and engagement, including:

1. Pollution: flooding a community with repeated or objectionable content, caus-
   ing the OSN to shut it down (Ratkiewicz et al. 2011; Woolley 2016; Hegelich
   and Janetzko 2016; Hine et al. 2017; Nasim et al. 2018; Fisher 2018; Mariconti
   et al. 2019)
2. Boost: heavily reposting content to make it appear popular (Ratkiewicz et al.
   2011; Cao et al. 2015; Varol et al. 2017; Vo et al. 2017; Gupta et al. 2019; Keller
   et al. 2019; Graham et al. 2020b; Assenmacher et al. 2020);
3. Bully: groups of individuals harassing another individual or community (Burgess
   and Matamoros-Fernández 2016; Hine et al. 2017; Kumar et al. 2018; Datta
   and Adar 2019; Mariconti et al. 2019); and

    3   https://crestresearch.ac.uk/resources/russian-influence-uk-terrorist-attacks/
Finding Highly Coordinating Communities in Social Media                             7

Table 1 Social media interaction equivalents

OSN         POST     REPOST      REPLY         MENTION      TAG          LIKE
Twitter     tweet    retweet     reply tweet   @mention     #hashtags    favourite
Facebook    post     share       comment       mention      #hashtag     reactions
Tumblr      post     repost      comment       @mention     #tag         heart
Reddit      post     crosspost   comment       /u/mention   subreddit    up/down vote

4. Metadata Shuffling: groups of accounts changing, and even swapping, metadata
   to hide their identities (Mariconti et al. 2017; Ferrara 2017).

    Different behaviour primitives (e.g., Table 1) can be used to execute these
strategies. Dissemination can be carried out by reposting, using hashtags, or men-
tioning highly connected individuals in the hope they spread a message further.
Accounts doing this covertly will avoid direct connections, and thus inference is
required for identification. Giglietto et al. (2020b) propose detecting anomalous
levels of coincidental URL use as a way to do this; we expand this approach to
other interactions.
    Some strategies require more sophisticated detection: detecting bullying through
dogpiling (e.g., as happened during the #GamerGate incident, studied by Burgess
and Matamoros-Fernández (2016), or to those posing questions to public figures
at political campaign rallies4 ) requires collection of (mostly) entire conversation
trees, which, while trivial to obtain on forum-based sites (e.g., Facebook and Red-
dit), are difficult on stream-of-post sites (e.g., Twitter, Parler and Gab). Detecting
metadata shuffling requires long term collection on broad issues to detect the same
accounts being active in different contexts.
    Figure 2 shows representations of several strategies, giving clues about how
they might be identified. To detect Pollution, we match the authors of posts men-
tioning the same (hash)tag. This way we can reveal not just those who are using
the same hashtags with significantly greater frequency than the average but also
those who use more hashtags than is typical. To detect Boost, we match authors
reposting the same original post, and can explore which sets of users not only re-
post more often than the average, but those who repost content from a relatively
small pool of accounts. Alternatively, we can match authors who post identical, or
near identical text, as seen in our motivating example (Section 1.1); Graham et al.
(2020a) have recently developed open sourced methods for this kind of match-
ing. Considering reposts like retweets, however, it is unclear whether platforms
deprioritise them when responding to stream filter and search requests, so spe-
cial consideration may be required when designing data collection plans. Finally,
to detect Bully, we match authors whose replies are transitively rooted in the
same original post, thus they are in the same conversation. This requires collec-
tion strategies that result in complete conversation trees, and also stipulates a
somewhat strict definition of ‘conversation’. On forum-based OSNs, the edges of
a ‘conversation’ may be relatively clear: by commenting on a post, one is ‘joining’
the ‘conversation’. Delineating smaller sets of interactions within all the comments
on a post to find smaller conversations may be achieved by regarding each top-
level comment and its replies as a conversation, but this may not be sufficient.
 4   https://www.bbc.co.uk/bbcthree/article/72686b6d-abd2-471b-ae1d-8426522b1a97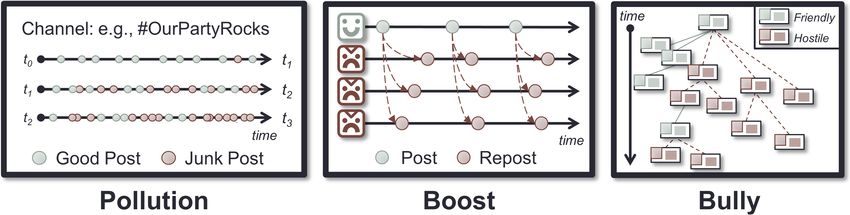
8                                                         Derek Weber, Frank Neumann

Similarly, on stream-based OSNs, a conversation may be engaged in by a set of
users if they all mention each other in their posts, as it is not possible to reply to
more than one post at a time.

2.1 Problem Statement

A clarification of our challenge at this point is:

    To identify groups of accounts whose behaviour, though typical in nature,
    is anomalous in degree.

There are two elements to this. The first is discovery. How can we identify not just
behaviour that appears more than coincidental, but also the accounts responsible
for it? That is the topic of the next section. The second element is validation.
Once we identify a group of accounts via our method, what guarantee do we have
that the group is a real, coordinating set of users? This is especially difficult given
inauthentic behaviour is hard for humans to judge by eye (Cresci et al. 2017).

3 Methodology

The major OSNs share a number of features, primarily in how they permit users to
interact. By focusing on these commonalities, it is possible to develop approaches
that generalise across the OSNs that offer them.
    Traditional social network analysis relies on long-standing relationships be-
tween actors (Wasserman and Faust 1994; Borgatti et al. 2009). On OSNs these
are typically friend/follower relations. These are expensive to collect and quickly
degrade in meaning if not followed with frequent activity. By focusing on active
interactions, it is possible to understand not just who is interacting with whom,
but to what degree. This provides a basis for constructing (or inferring) social
networks, acknowledging they may be transitory.
    LCNs are built from inferred links between accounts. Supporting criteria re-
lying on interactions alone, as observed in the literature (Ratkiewicz et al. 2011;
Keller et al. 2019), include retweeting the same tweet (co-retweet), using the same
hashtags (co-hashtag) or URLs (co-URL), or mentioning the same accounts (co-
mention). To these we add joining the same ‘conversation’ (a tree of reply chains
with a common root tweet) (co-conv ). As mentioned earlier, other ways to link
accounts rely on similar or identical content (e.g., Lee et al. 2013; Keller et al.
2019; Pacheco et al. 2020a; Graham et al. 2020a) or metadata (Mariconti et al.
2017; Ferrara 2017).

3.1 The LCN / HCC Pipeline

The key steps to extract HCCs from raw social media data are shown in Figure 3
and documented in Algorithm 1. The example in Figure 3 is explained after the
algorithm has been explained, in Section 3.1.2.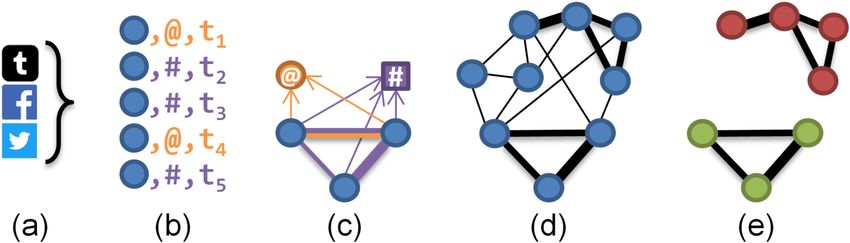
Finding Highly Coordinating Communities in Social Media                                   9

Fig. 3 Conceptual LCN construction and HCC discovery process.

Algorithm 1 FindHCCs
Input: P : Social media posts, C: Coordination criteria, θ: Extraction parameter
Output: H: A list of HCCs
 1: Iall ← ParseInteractionsFrom(P )
 2: IC ← FilterInteractions(Iall , C)
 3: M ← FindCoordination(IC , C)
 4: L ← ConstructLCN(M )
 5: H ← ExtractHCCs(L, θ)

Step 1. Convert social media posts P to common interaction primitives, Iall . This
step removes extraneous data and provides an opportunity for the fusion of sources
by standardising all interactions (thus including only the elements required for the
coordination being sought).

Step 2. From Iall , filter the interactions, IC , relevant to the set C={c1 , c2 , ..., cq }
of criteria (e.g., co-mentions and co-hashtags).

Step 3. Infer links between accounts given C, ensuring links are typed by criterion.
The result, M , is a collection of inferred pairings. The count of inferred links
                                                      c
between accounts u and v due to criterion c ∈ C is β{u,v}  .

Step 4. 4 Construct an LCN, L, from the pairings in M . This network L=(V, E)
is a set of vertices V representing accounts connected by undirected weighted edges
E of inferred links. These edges represent evidence of different criteria linking the
adjacent vertices. The weight of each edge e ∈ E between vertices representing
accounts u and v for each criterion c is wc (e), and is equal to β{u,v}
                                                                  c
                                                                        .
    Most community detection algorithms will require the multi-edges be collapsed
to single edges. The edge weights are incomparable (e.g., retweeting the same tweet
is not equivalent to using the same hashtag), however, for practical purposes, the
inferred links can be collapsed and the weights combined for cluster detection
using a simple summation, e.g., Equation (1), or a more complex process like
varied criteria weighting.
                                             q
                                                   wc (e)
                                             X
                                    w(e) =                                              (1)
                                             c=1

    Some criteria may result in highly connected LCNs, even if its members never
interact directly. Not all types of coordination will be meaningful – people will co-
use the same hashtag repeatedly if that hashtag defines the topic of the discussion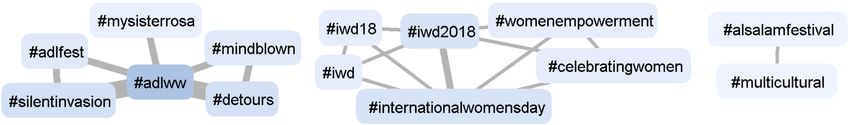
10                                                       Derek Weber, Frank Neumann

(e.g., #auspol for Australian politics), in which case it is those accounts who co-
use it significantly more often than others which are of interest. If required, the
final step filters out these coincidental connections.

Step 5. Identify the highest coordinating communities, H, in L (Figure 3e), using
a suitable community detection algorithm, such as Blondel et al. (2008)’s Louvain
algorithm (used by Morstatter et al. 2018; Nasim et al. 2018), k nearest neighbour
(kN N ) (used by Cao et al. 2015), edge weight thresholding (used by Lee et al.
2013; Pacheco et al. 2020b), or FSA (Şen et al. 2016), an algorithm from the Social
Network Analysis community that focuses on extracting sets of highly influential
nodes from a network. Depending on the size of the dataset under consideration,
algorithms suitable for very large networks may need to be considered Fang et al.
(2019). Some algorithms may not require the LCN’s multi-edges to be merged
(e.g., Bacco et al. 2017). We present a variant of FSA (Şen et al. 2016), FSA V
(Algorithm 2), because it is designed to take advantage of FSA’s benefits, while
addressing some of its costs. FSA does not just divide a network into communi-
ties (so that every node belongs to a community), but extracts only sets of nodes
that form influential communities within the overall network. FSA V reduces the
computational complexity introduced by FSA, which recursively applies Louvain
to divide the network into smaller components and then, under certain circum-
stances, stitches them back together. The reason for this is to make it more suitable
for application to a streaming scenario, in which execution speed is a priority.
     Similar to FSA, FSA V initially divides L into communities using the Louvain
algorithm but then builds candidate HCCs within each, starting with the ‘heaviest’
(i.e., highest weight) edge (representing the most evidence of coordination). It then
attaches the next heaviest edge until the candidate’s mean edge weight (MEW)
is no less than θ (0 < θ ≤ 1) of the previous candidate’s MEW, or is less than
L’s overall MEW. In testing, edge weights appeared to follow a power law, so θ
was introduced to identify the point at which the edge weight drops significantly;
θ requires tuning. A final filter ensures no HCC with a MEW less than L’s is
returned. Unlike in FSA (Şen et al. 2016), recursion is not used, nor stitching of
candidates, resulting in a simpler algorithm.
     This algorithm prioritises edge weights while maintaining an awareness of the
network topology by examining adjacent edges, something ignored by simple edge
weight filtering. Our goal is to find sets of strongly coordinating users, so it is
appropriate to prioritise strongly tied communities while still acknowledging co-
ordination can also be achieved with weak ties (e.g., 100 accounts paid to retweet
a single tweet).
     The complexity of the entire pipeline is low order polynomial due primarily
to the pairwise comparison of accounts to infer links in Step 3, which can be
constrained by window size when addressing the temporal aspect. For large net-
works (meaning networks with many accounts), that may be too costly to be of
practical use; the solution for this relies on the application domain inasmuch as
it either requires a tighter temporal constraint (i.e., a smaller time window) or
tighter stream filter criteria, causing a reduction in the number of accounts, po-
tentially along with a reduction in posts. The complexity of the pipeline and HCC
extraction is discussed in more detail in Section 3.3.
Finding Highly Coordinating Communities in Social Media 11
Algorithm 2 ExtractHCCs (FSA V)
Input: L=(V, E): An LCN, θ: HCC threshold
Output: H: Highly coordinating communities
1: E 0 ← MergeMultiEdges(E)
2: g mean ← MeanWeight(E 0 )
3: louvain communities ← ApplyLouvain(L)
4: Create new list, H
5: for l ∈ louvain communities do
6: Create new community candidate, h = (Vh , Eh )
7: Add heaviest edge e ∈ l to h
8: growing ← true
9: while growing do
10: Find heaviest edge ~e ∈ l connected to h not in h
11: old mean ← MeanWeight(Eh )
12: new mean ← MeanWeight(Concatenate(Eh , ~e))
13: if new mean < g mean or
new mean < (old mean × θ) then
14: growing ← false
15: else
16: Add ~e to h
17: if MeanWeight(Eh ) > g mean then
18: Add h to H
3.1.1 Addressing the Temporal Aspect
Temporal information is a key element of coordination, and thus is critical for ef-
fective coordination detection. Frequent posts within a short period may represent
genuine discussion or deliberate attempts to game trend algorithms (Grimme et al.
2018; Varol et al. 2017; Assenmacher et al. 2020). We treat the post stream as a
series of discrete windows to constrain detection periods. An LCN is constructed
from each window (Step 4), and these are then aggregated and mined for HCCs
(Step 5). As we assume posts arrive in order, their timestamp metadata can be
used to sort and assign them to windows.
3.1.2 A Brief Example
Figure 3 gives an example of searching for co-hashtag coordination across Face-
book, Twitter, and Tumblr posts. The posts are converted to interaction primitives
in Step 1, shown in Figure 3a. The information required from each post is the iden-
tity of the post’s author5 , the timestamp of the post for addressing the temporal
aspect, and the hashtag mentioned (there may be many, resulting in separate
records for each). This is done in Figure 3b, which shows the filtered mentions (in
orange) and hashtag uses (in purple), ordered according to timestamp.
Step 3 in Figure 3c involves searching for evidence of coordination through
searching for our target coordination strategies through pairwise examination of
accounts and their interactions. Here, three accounts co-use a hashtag while only
two of them co-mention another account.
By Step 4 in Figure 3d, the entire LCN has been constructed, and then Fig-
ure 3e shows its most highly coordinating communities.
5 Linking identities across social media platforms is beyond the scope of this work, but the
interested reader is referred to Adjali et al. (2020) for a recent contribution to the subject.12 Derek Weber, Frank Neumann
As mentioned above, to account for the temporal aspect, the LCNs produced
for each time window in Figure 3d can be aggregated and then mined for HCCs,
or HCCs could be extracted from each window’s LCN and then they can be ag-
gregated, or analysed in near real-time, as dictated by the application domain.
3.2 Validation Methods
As mentioned in Section 2.1, the second element of addressing our research chal-
lenge is that of validation. Once HCCs have been discovered, it is necessary to
confirm that what has been found are examples of genuine coordinating groups.
This step is required before the further question of whether the coordination is
authentic (e.g., grassroots activism) or inauthentic (e.g., astroturfing).
3.2.1 Datasets
In addition to relevant datasets, we make use of a ground truth (GT), in which we
expect to find coordination (cf., Keller et al. 2017; Vargas et al. 2020). By com-
paring the evidence of coordination (i.e., HCCs) we find within the ground truth
with the coordination we find in the other datasets, we can develop confidence
that: a) our method finds coordination where we expect to find it (in the ground
truth); and b) our method also finds coordination of a similar type where it was
not certain to exist. Furthermore, to represent the broader population (which is
not expected to exhibit coordination), similar to Cao et al. (2015), we create a
randomised HCC network from the non-HCC accounts in a given dataset, and
then compare its HCCs with the HCCs that had been discovered by our method.
3.2.2 Membership Comparison Across Variables
Our primary factors include the HCC extraction method (using FSA V, kN N , or
thresholds), the window size, γ, and the strategy being targeted (Boost, Pollution
or Bully). Given our interest prioritises the sets of accounts over how they are
connected, for each pair of variations we compare the membership of the HCCs
discovered, as a whole, and the number of HCCs discovered, as well as the edge
count. Also included are the exact numbers of HCC members common to each
pair. These figures provide further context for the degree of overlap between the
HCC members identified under different conditions (i.e., factor values). We use
Jaccard and overlap similarity measures (Verma and Aggarwal 2020) to compare
the accounts appearing in each (ignoring their groupings) and render them as
heatmaps. The Jaccard similarity coefficient, J, is a value between 0.0 and 1.0
which represents the similarity between two sets of items, X and Y :
|X ∩ Y | |X ∩ Y |
J(X, Y ) = = . (2)
|X ∪ Y | |X| + |Y | − |X ∩ Y |
If there is significant imbalance in the sizes of X and Y , then their similarity
may be low, even if one is a subset of the other. An alternative measure, the
Overlap or Szymkiewicz-Simpson coefficient (Verma and Aggarwal 2020), takes
this imbalance into account by using the size of the smaller of the two sets as the
denominator:Finding Highly Coordinating Communities in Social Media 13
|X ∩ Y |
overlap(X, Y ) = . (3)
min(|X|, |Y |)
In a circumstance such as ours, it is unclear whether a longer time window
will garner more results after HCC extraction is applied. The Jaccard and overlap
coefficients can be used to quickly understand two facts about the sets of accounts
identified as HCC members with different values of γ:
– Is one set a subset of the other? If so, the overlap coefficient will reach 1.0,
while the Jaccard coefficient may not, if the two sets differ in size. If they are
disjoint, it will be 0.0, along with the Jaccard coefficient.
– Do the sets differ in size? If the sets are different sizes, but one is a subset of
the other, the overlap coefficient will hide this fact, while the Jaccard coefficient
will expose it. If both coefficients have values close to 0.0, then the sets are
clearly different in membership and potentially also in size. If the coefficient
values are very close, then the sets are close in size, because the denominators
are similar in size, meaning |X ∪ Y | = min(|X|, |Y |), but this will only occur
if they share many members (i.e., |X ∩ Y | is high).
The exact numbers of common accounts complement the degree of overlap visible
in the heat maps to provide the reader a basis to easily compare how different
variations compare with each other beyond examining them only as pairs and
therefore illuminates the influence each particular factor has overall. For example,
by being able to compare the results using each value for γ, it is possible to see
the progression of results as the window size increases (both in raw numbers and
with a colour scale in the heatmaps).
3.2.3 Network Visualisation
A second subjective method of analysis for networks is, of course, to visualise
them. We use two visualisation tools, visone (https://visone.info) and Gephi
(https://gephi.org), both of which make use of force directed layouts, which help to
clarify clusters in the network structure. In particular, Gephi provides access to the
Fruchterman-Reingold (FR) algorithm (Fruchterman and Reingold 1991), which
is force directed, but constrains the layout within a circle. This enables us to see to
what degree individual clusters dominate the overall graph, in a way that standard
force-directed layouts do not. Node colour is used to represent cluster membership.
Clusters are identified with the Louvain method (Blondel et al. 2008). Node size
can be used to represent degree or, for nodes representing accounts, the number
of posts an account contributes to a corpus. Edge thickness and colour (darkness)
are used to represent the weight of the edges. As HCCs are weighted undirected
networks and each connected component is an HCC, node colour can be used to
represent the number of posts, and edge weight can be represented by thickness
and, depending on the density of the network, colour darkness. Node shape can be
also employed to represent a variable; for analyses that involve multiple criteria
(e.g., co-conv and co-mention), we use shape to represent which combination of
criteria an HCC is bound by (e.g., just co-mention or a combination of co-mention
and co-conv or just co-conv).
By extending the HCC account networks with nodes to represent the ‘reasons’
or instances of evidence that link each pair of nodes, e.g., the tweets they retweet in14 Derek Weber, Frank Neumann
common, or accounts they both mention or reply to, creating a two-level account-
reason network in doing so, we can investigate how HCCs relate to one another.
In this case, the two-level network has two types of nodes (accounts and reasons)
and two types of edges (‘coordinates with’ links between accounts and ‘caused
by’6 links between ‘reasons’ and accounts). Visualising the two-level network by
colouring nodes by their HCC and using a force-directed layout highlights how
closely associated HCCs are with each other, not only revealing what reasons
draw many HCCs together (i.e., many HCCs may be bound by a single reason, or
an HCC may be entirely isolated from others in the broader community), but also
how many reasons may bind them (i.e., many reasons may bind an HCC together).
Deeper insights can be revealed from this point using multi-layer network analyses.
3.2.4 Consistency of Content
To help answer RQ2, it is helpful to look beyond network structures and consider
how consistent the content within an HCC7 is relative to other HCCs and the
population in general. This will be most applicable when the type of strategy the
HCC is suspected to have engaged in requires repetition, e.g., co-retweeting or
copypasta. If HCCs are boosting a message, it is reasonable to assume the content
of HCCs members will be more similar internally that when compared externally,
to the content of non-members. To analyse this internal consistency of content,
we treat each HCC member’s tweets as a single document and create a doc-term
matrix using 5 character n-grams for terms. Comparing the members’ document
vectors using cosine similarity in a pairwise fashion creates a n · n matrix where
n is the number of accounts in the HCC network. This approach was chosen for
its performance with non-English corpora (Damashek 1995), and because using
individual tweets as documents produced too sparse a matrix in a number of tests
we conducted. The pairwise account similarity matrix can be visualised, using a
range of colours to represent similarity. By ordering the accounts on both the x
and y axes to ensure they are grouped within their HCCs, if our hypothesis is right
that similarity within HCCs is higher than outside, then we should observe clear
bright squares extending from the diagonal of the matrix. The diagonal itself will
be the brightest because it represents each account’s similarity with itself.
If HCCs contribute few posts, which are similar or identical to other HCCs,
then bright squares may appear off the diagonal, and this would be evidence similar
to clusters of account nodes around a small number of reason nodes in the two-level
account-reason networks mentioned in the previous section.
This method offers no indication of how active each HCC or HCC member
is, so displays of high similarity may imply low levels of activity as well as high
content similarity, just because of the lower likelihood that highly active accounts
are highly similar in content (by contributing more posts, there are simply more
opportunities for accounts’ content to diverge). The use of the 5-character n-gram
approach is designed to offset this because each tweet in common between two
accounts will yield a large number of points of similarity, as will the case when the
6 Or other appropriate phrasing to indicate that the account is linked to the reason, by
which it is indirectly linked to other accounts. N.B. The reason itself may be an account, e.g.,
in the context of co-mentions, but for the purpose of the two-level network, the mentioned
account is treated as a reason.
7 I.e., the content produced by the HCC’s members.Finding Highly Coordinating Communities in Social Media 15
same two tweets are posted in the same order (i.e., two accounts both post tweet
t1 and then t2 ), because the overlap between the tweets will yield at least 4 points
of similarity.
3.2.5 Variation of Content
Converse to the consistency of content within HCC is the question of content vari-
ation, and how does the variation observed in detected HCCs differ from that of
RANDOM groupings. Highly coordinated behaviour such as co-retweeting involves
reusing the same content frequently, resulting in low feature variation (e.g., hash-
tags, URLs, mentioned accounts), which can be measured as entropy (Cao et al.
2015). A frequency distribution of each HCC’s use of each feature type is used
to calculate each entropy score. Low feature variation corresponds to low entropy
values. As per Cao et al. (2015), we compare the entropy of features used by de-
tected HCCs to RANDOM ones and visualise their cumulative frequency. Entries
for HCCs which did not use a particular feature are omitted, as their scores would
inflate the number of groups with 0 entropy.
3.2.6 Hashtag Analysis
Hashtags can be used to define discussion groups or chat channels (Woolley 2016),
so hashtag analysis can be used to study those communities. It is another aspect to
content analysis that relies upon social media users declaring the topic of their post
through the hashtags they include. At the minimum, we can plot the frequency
of the most frequently used hashtags as used by the most active HCCs. In doing
so, we can quickly see which hashtags different HCCs make use of, and how they
relate by how they overlap. Some hashtags will be unique to HCCs, while others
will be used by many. This exposes the nature of HCC behaviour: they may focus
their effort on a single hashtag, perhaps to get it trending, or they may use many
hashtags together, perhaps to spread their message to different communities.
To further explore how hashtags are used together, we perform hashtag co-
occurrence analysis, creating networks of hashtags linked when they are mentioned
in the same tweet. These hashtag co-occurrence networks are sometimes referred
to as semantic networks (Radicioni et al. 2020). When visualised it is possible to
see themes in the groupings of hashtags, and to gain insights from how the theme
clusters are connected (including when they are isolated from one another). To
extend this approach, Louvain clustering (Blondel et al. 2008) can be applied and
hashtag nodes can be coloured by cluster, providing a statistical measure to how
related the hashtags are.
3.2.7 Temporal Patterns
Campaign types can exhibit different temporal patterns (Lee et al. 2013), so we
use the same temporal averaging technique as Lee et al. (2013) (dynamic time
warping barycenter averaging) to compare the daily activities of the HCCs in
the GT and RANDOM datasets with those in the test datasets. The temporal
averaging technique produces a single time series made from the time series of
all activities of each member in a set of accounts. Using this technique avoids16 Derek Weber, Frank Neumann
averaging out of time series that are off-phase from one another, by aligning them
before averaging them.
Another aspect of temporal analysis is the comparison of HCCs detected in dif-
ferent time windows, including specifically observing whether any HCCs between
time windows share members and what the implications are for the behaviour of
those members. This is non-trivial for any moderately large dataset, but exami-
nation of the ground truth can provide some insight into the behaviours exhibited
by accounts known to be coordinating.
3.2.8 Focus of Connectivity
Groups that retweet or mention themselves create direct connections between their
members, meaning if one is discovered, it may be trivial to find its collaborators.
To be covert, therefore, it would be sensible to have a low internal retweet and
mention ratios (IRR and IMR, respectively). Formally, if RTint and Mint are the
the sets of retweets and mentions of accounts within an HCC, respectively, and
RText and Mext are the corresponding sets of retweets and mentions of accounts
outside the HCC, then, for a single HCC,
|RTint |
IRR = (4)
|RTint | + |RText |
and
|Mint |
IM R = . (5)
|Mint | + |Mext |
3.2.9 Consistency of Coordination
The method presented Section 3.1 highlights HCCs that coordinate their activity
at a high level over an entire collection period. Further steps can be taken to de-
termine which HCCs are coordinating their behaviour repeatedly and consistently
across adjacent time windows. In this case, for each time window, we consider not
just the nodes and edges from the current LCN, but additionally from previous
windows, applying a degrading factor the contribution of their edge weights. To
build an LCN from a sliding frame of T time windows, the new LCN includes
the union of the nodes and edges of the individual LCNs from the current and
previous windows, but to calculate the edge weights, we apply a decay factor, α,
to the weights of edges appearing in windows before the current one. In this way,
we apply a multiplier of αx to the edge weights, where x is the number of win-
dows into the past: the current window is 0 windows into the past, so its edges
are multiplied by α0 = 1; the immediate previous window is 1 window back, so
its edge multiplier is α1 ; the one before that uses α2 , and so on until the farthest
window back uses αT −1 . Generalising from Step 4, the weight wc,t (e) for an edge
e ∈ E between accounts u and v for criterion c at window t and a sliding window
T windows wide is given by
T −1
wc,t (e) = wc,(t−x) (e) · αx .
X
(6)
x=0Finding Highly Coordinating Communities in Social Media 17
In this way, to create a baseline in which the sliding frame is only one window
wide, one only need choose T =1, regardless of the value of α. As α → 1, the
contributions of previous windows’ are given more consideration.
3.2.10 Machine Learning with One-Class Classifiers
An approach that aids in the management of data with many features is classi-
fication through machine learning. This is an approach that has been used ex-
tensively in campaign detection, in which tweets are classified, rather than ac-
counts (e.g., Lee et al. 2013; Chu et al. 2012; Wu et al. 2018). As our intent
is to determine whether HCCs detected in datasets are similar to those detect-
ing in ground truth, it is acceptable to rely on one-class classification (i.e., an
HCC detected in a dataset is recognised as COORDINATING/positive, or NON-
COORDINATING/unknown). The more common binary classification approach
was used by Vargas et al. (2020), however our approach has two distinguishing
features:
1. We rely on one-class classification because we have positive examples of what
we regard as COORDINATING from the ground truth, and everything else
is regarded as unknown, rather than definitely ‘not coordinating’. A one-class
classifier can, for example, suggest a new book from a wide range (such as
a library) based on a person’s reading history. In such a circumstance, the
classifier designer has access to positive examples (books the reader likes or has
previously borrowed) but all other instances (books here) are either positive
or negative. When our one-class classifier recognises HCC accounts as positive
instances, it provides confidence that the HCC members are coordinating their
behaviour in the same manner as the accounts in the ground truth.
2. We rely on features from both the HCCs and the HCC members and use the
HCC members as the instances for classification, given it is unclear how many
members an HCC may have, and accounts that are members of HCCs may have
traits in common that are distinct from ‘normal’ accounts. For this reason
the feature vectors that our classifier is trained and tested on will comprise
features drawn from the individual accounts and their behaviour as well as
the behaviour of the HCC of which they are a member. Feature vectors for
members of the same HCC will naturally share the feature values drawn from
their grouping.
Regarding the construction of the feature vector, at a group level, we consider
not just features from the HCC itself, which is a weighted undirected network
of accounts, but of the activity network built from the interactions of the HCC
members within the corpus. The activity network is a multi-network (i.e., sup-
ports multiple edges between nodes) with nodes and edges of different types. The
three node types are account nodes, URL nodes, and hashtag nodes. Edges rep-
resent interactions and the following types are modelled: hashtag uses, URL uses,
mentions, repost/retweets, quotes (cf. comments on a Facebook or Tumblr post),
reply, and ‘in conversation’, meaning that one account replied to a post that was
transitively connected via replies to an initial post by an account in the corpus.
This activity network therefore represents not just the members of the HCC but
also their degree of activity.18 Derek Weber, Frank Neumann
Classifier algorithms. We use the GT to train three classifiers. Two were well-
known classifiers drawn from the scikit-learn Python library (Pedregosa et al.
2011): Support Vector Machine (SVM) and Random Forest (RF). The SVM and
RF classifiers were trained with two-fold validation and the RF was configured
to use 1, 000 trees (estimators). The third classifier was a bagging PU classifier
(BPU, Mordelet and Vert 2014)8 also configured to use a 1, 000 RF classifier inter-
nally. Contrasting “unlabeled” training instances were created from the RANDOM
dataset. Feature vector values were standardised prior to classification and upsam-
pling was applied to create balanced training sets.
The classifiers predict whether instances provided to them are in the positive
or unlabeled classes, which we refer to, to aid readability, as ‘COORDINATING’
and ‘NON-COORDINATING’, respectively.
Performance metrics. The performance metrics used include the classifier’s ac-
curacy, F1 scores for each class, and the Precision and Recall measures that the F1
scores are based upon. High precision implies the classifier is good at recognising
samples correctly, and high Recall implies that a classifier does not miss instances
of the class they are trained on in any testing data. For example, a good apple
classifier will successfully recognise an apple when it is presented with one, and
when presented with a bowl of fruit, it will successfully find all the apples in it.
The F1 score combines these two measures:
P recision · Recall
F1 = 2 · (7)
P recision + Recall
and provides insight into to the balance between the classifiers precision and
recall. The accuracy of a classifier is the proportion of instances in a test data set
that the classifier labeled correctly. In this way, the accuracy is the most coarse
of these measures, because it offers little understanding of whether the classifier
is missing instances it should find (false negatives) or labeling non-matching in-
stances incorrectly (false positives). The F1 score begins to address this failing,
but direct examination of the Precision and Recall provides the most insight into
each classifier’s performance.
3.2.11 Bot Analysis
Although coordinated behaviour in online campaigns is often conducted without
automation (Starbird et al. 2019), automation is still commonly present in cam-
paigns, especially in the form of social bots, which aim to present themselves as
typical human users (Ferrara et al. 2016; Cresci 2020). For this reason, the tech-
nique presented here is a valid tool for exposing teams of cooperating bot and
social bot accounts. We use the Botometer (Davis et al. 2016) service to evaluate
selected accounts for bot-like behaviour, which provides a detailed assessment of
an account’s botness based on over 1, 000 features in six categories. Each category
is assigned a value from 0, meaning human, to 1, meaning automated. Although
other studies have relied on 0.5 as a threshold for labelling an account as a bot,
there is a a significant overlapping area between humans that act in a very bot-like
8 Thanks to Roy Wright for his implementation: https://github.com/roywright/pu learning/
blob/master/baggingPU.pyFinding Highly Coordinating Communities in Social Media 19
manner, and bots that are quite human-like, so we adopt the approach of Rizoiu
et al. (2018) and regard scores below 0.2 to be human and scores above 0.6 to be
bots.
3.3 Complexity Analysis
The steps in processing timeline presented in Section 3.1 are reliant on two primary
factors: the size of the corpus of posts, P , being processed, and the size of the set
of accounts, A, that posted them. Therefore |A| ≤ |P | Then the complexity of
Step 1 is linear, O(|P |), because it requires processing each post, one-by-one. The
set of interactions, Iall , it produces may be larger than |P |, because a post may
include many hashtags, mentions, or URLs, but given posts are not infinitely long
(even long Facebook or Tumblr posts only include several thousand words), the
number of interactions will also be linear, even if it |I| = k|P |, for some constant
k. Step 2 filters these interactions down to only the ones of interest, IC , based
on the type of coordinated activity sought, C, so |Iall | ≥ |IC |, and again the
complexity of this step is also linear, O(|Iall |), as it requires each interaction to be
considered. Step 3 seeks to find evidence of coordination between the accounts in
the dataset, and so requires examining each filtered interaction and building up
data structures to associated each account with their interactions (O(|Iall |)), then
emitting pairs of accounts matching the coordination criteria, producing the set
M , which requires the pairwise processing of all accounts, and so is |A|2 with a
complexity of O(|A|2 ). This, however, also depends on the pairwise comparison of
each account’s interactions, which is likely to be small, practically, but theoretically
could be as large as |IC | if one user is responsible for every interaction in the corpus
(but then |A| would be 1). On balance, as a result, we will regard the processing
of each pair of users’ interactions as linear with a constant factor k (i.e., O(k|A|2 )
= O(|A|2 )). In Step 4, producing the LCN, L, from the criteria is a matter of
considering each match one-by-one, so is again linear (though potentially large,
depending on |M |). The final step (5) is to extract the HCCs from the LCN, and
its performance and complexity very much depend upon the algorithm employed,
but significant research has been applied in this field (as considered in, e.g., Bedru
et al. 2020). For FSA V, which relies on the Louvain algorithm with complexity
O(|A| log 2 |A|) (Blondel et al. 2008), it considers edges within each community to
build its HCC candidates, so has a complexity of less than O(|E|), where |E| is the
number of edges in the LCN, meaning its complexity is linear. FSA V’s complexity
is therefore O(|A| log 2 |A| + |E|).
We regard the computation complexity of the entire pipeline as the highest
complexity of its steps, which are:
1. Extract interactions from posts: O(|P |)
2. Filter interactions: O(|Iall |)
3. Find evidence of coordination: O(|A|2 )
4. Build LCN from the evidence: O(|M |)
5. Extract HCCs from LCN using, e.g., FSA V: O(|A| log 2 |A| + |E|)
The maximum of these is Step 3, the search for evidence of coordination, O(|A|2 ).
Though in theoretical terms the method is potentially highly costly, in practical
terms, we are bound by the number of accounts in the collection (which is highlyYou can also read