BRIEF COMMUNICATIONS A Replication Study of the Neural Correlates of Deception
←
→
Page content transcription
If your browser does not render page correctly, please read the page content below
Behavioral Neuroscience                                                                                                  Copyright 2004 by the American Psychological Association
2004, Vol. 118, No. 4, 852– 856                                                                                          0735-7044/04/$12.00 DOI: 10.1037/0735-7044.118.4.852

                                                            BRIEF COMMUNICATIONS

                     A Replication Study of the Neural Correlates of Deception

                            Frank Andrew Kozel                                                                      Tamara M. Padgett
   Medical University of South Carolina and Ralph H. Johnson                                               Medical University of South Carolina
   Veterans Affairs Medical Center, Charleston, South Carolina

                                                                            Mark S. George
         Medical University of South Carolina and Ralph H. Johnson Veterans Affairs Medical Center, Charleston, South Carolina

                                  The authors attempted to replicate prior group brain correlates of deception (F. Kozel et al., in press) and
                                  improve on the consistency of individual results. Healthy, right-handed adults were instructed to tell the
                                  truth or to lie while being imaged in a 3T magnetic resonance imaging (MRI) scanner. Blood oxygen
                                  level-dependent functional MRI significance maps were generated for subjects giving a deceptive answer
                                  minus a truthful answer (lie minus true) and the reverse (true minus lie). The lie minus true group analysis
                                  (n ⫽ 10) revealed significant activation in 5 regions, consistent with a previous study (right orbitofrontal,
                                  inferior frontal, middle frontal cortex, cingulate gyrus, and left middle frontal), with no significant
                                  activation for true minus lie. Individual results of the lie minus true condition were variable. Results show
                                  that functional MRI is a reasonable tool with which to study deception.

   Understanding the neurocircuitry involved in deception could                             graph to accurately detect deception, however, has been ques-
have a profoundly beneficial impact on society. Deception, defined                          tioned (Brett, Phillips, & Beary, 1986; Lykken, 1998; Steinbrook,
as the purposeful misleading of another, is ubiquitous in society                           1992). In addition, a recent National Science Foundation report
and in medicine. Understanding the brain basis of deception could                           concluded that the polygraph lacked evidence to support its use in
lead to both a method in which deception is accurately detected                             detecting deception and highlighted the critical need for new
and to a better understanding of disorders in which deception is a                          methods to be developed (National Research Council, 2002). A
prominent component (e.g., antisocial personality disorder).                                primary problem with the polygraph is that it measures peripheral
   The polygraph has been used extensively to detect deception                              arousal, not deception itself. Conversely, blood oxygen level-
(American Polygraph Association, 1996). The ability of the poly-                            dependent (BOLD) functional magnetic resonance imaging
                                                                                            (fMRI) offers a method of measuring brain activity noninvasively
   Frank Andrew Kozel and Mark S. George, Center for Advanced Imag-                         (Ogawa, Lee, Kay, & Tank, 1990). Measures of brain activity
ing Research and the Brain Stimulation Laboratory, Department of Psy-                       associated with deception provide an opportunity to investigate the
chiatry, Medical University of South Carolina, and Mental Health Service,                   neurocircuitry of deception.
Ralph H. Johnson Veterans Affairs Medical Center, Charleston, South                            An initial pilot study performed in our lab revealed significant
Carolina; Tamara M. Padgett, Center for Advanced Imaging Research and                       activation in several brain areas during lying compared with truth-
the Brain Stimulation Laboratory, Department of Psychiatry, Medical                         telling (z ⬎ 1.645, with an extent threshold of p ⬍ .05; the extent
University of South Carolina.                                                               threshold attempts to correct for multiple comparisons by deter-
   Frank Andrew Kozel and Mark S. George have applied for a patent
                                                                                            mining the likelihood of a cluster of significantly activated voxels
on the use of fMRI for detecting deception. Subsequent to the present
study, Frank Andrew Kozel received support for research related to this                     occurring by chance). These areas included the right frontal (su-
technology.                                                                                 perior, middle, and inferior including the orbitofrontal) areas, right
   Portions of this article were previously published in abstract form                      anterior cingulate gyrus, and right precentral gyrus. In addition,
(Kozel, Padgett, & George, 2003). This work was supported in part by a                      significant activation was found in the left temporal area (superior,
grant-in-kind to Frank Andrew Kozel from the Medical University of                          middle, and inferior) and left cerebellum (Kozel et al., in press).
South Carolina Center for Advanced Imaging Research. Tamara M.                              These findings were significant for the group analyses, but not for
Padgett was supported by a Stanley Foundation Student Research Grant.                       the within-subject analyses. Other groups have reported significant
We thank James Ballenger and Christine Molnar for review of an earlier
                                                                                            group findings in detecting behavior related to deception, but have
version of this article, and Minnie Dobbins and Pamela Roberts for
                                                                                            not reported replication of their original findings or the results of
administrative support.
   Correspondence concerning this article should be addressed to Frank                      individual subject analyses (Ganis et al., 2003; Langleben et al.,
Andrew Kozel, Department of Psychiatry, Medical University of South                         2002; Lee et al., 2002; Spence et al., 2001). Using techniques to
Carolina, 67 President Street, P.O. Box 250861, Charleston, SC 29425.                       improve the statistical power of the fMRI analysis, we sought to
E-mail: kozelfa@musc.edu                                                                    test our initial findings for potential replication at the group level,

                                                                                      852
BRIEF COMMUNICATIONS 853
and also to determine whether higher MRI field strength and subject would receive an additional $50. All subjects in actuality would
paradigm modifications might allow for detection of deception at receive the additional $50, because there was no way to tell when the
the level of the individual. subject was lying. The research assistant and the IFIS system recorded the
subject’s responses. One of the investigators (Frank Andrew Kozel) knew
the location of the money. Deception and truthful events were determined
Method by comparing the subject’s responses to the actual location of the money.
During the experiment, each picture was presented for 6 s in groups of
Subjects six (each object once per block), in a randomized order (http://
randomization.com). Each group consisted of two deceptive answers and
Subjects were recruited by an advertisement in the Medical University of
four truthful answers. There were two runs of 10 blocks. Each run was 6
South Carolina’s campus newspaper. After a complete description of the
min long, with a 1-min break in between. The BOLD fMRI scans consisted
study was provided to the subjects, written informed consent—which was
of 26 coplanar transverse slices (4.0 mm thick, 1 mm gap) covering the
approved by the Medical University of South Carolina Investigational
entire brain and positioned 90° to the anterior commissure–posterior com-
Review Board—was obtained for all subjects. Subjects were required to be
missure line by means of a sagittal scout image. Each fMRI volume
18 – 40 years old, right-handed, and have a score of at least 9 out of 12 on
consisted of BOLD weighted transverse scans and used a single-shot
the Annett handedness rating scale (Annett, 1970). They also had to be able
gradient echoplanar imaging sequence (flip angle ⫽ 90°; TE, 30 ms; TR,
to read and write English and have the capacity to provide informed
3,000 ms; FOV, 256 ⫻ 256; matrix, 64 ⫻ 64 mm; in-plane resolution, 4
consent. Potential subjects were excluded if they had a history of any
mm ⫻ 4 mm; through-plane resolution, 4 mm). Given these parameters, a
current or past Axis I psychiatric disorder (except simple phobia), includ-
set of 120 whole-brain volumes was acquired for each run (total of 240
ing substance abuse/dependence as determined by the Structured Clinical
volumes for the study). After the BOLD fMRI, a structural T1-weighted
Interview for DSM–IV Axis I disorders (SCID-I; First, Spitzer, Williams,
scan was acquired to ensure that there were no major structural abnormal-
& Gibbon, 1995); a history of neurologic disease; a currently unstable
ities. After the scanning, subjects were asked if they had any problems or
medical condition; any medication taken within 5 half-lives of procedure
questions. They were then informed that the research assistant was unable
time; caffeinism; nicotine use; any metal implants (not including dental
to determine when they had lied. This scanning paradigm is a modification
fillings) that would make an MRI unsafe; irremovable medical devices
of our earlier study in that there were increased episodes of lying (40 vs.
such as pacemakers or fixed hearing aids; presence of shrapnel; previous
8) and the images were acquired at higher field strength (3.0 T vs. 1.5 T).
inability to tolerate MRI procedure; or claustrophobia severe enough to
induce substantial anxiety in closed spaces.
fMRI Analysis
Procedure The image data were analyzed with Statistical Parametric Mapping 2
(SPM2; Wellcome Department of Imaging Neuroscience, 2003) on a Sun
Screening visit. After written consent was obtained, subjects were server using a Sun Sparc workstation. Initially, images were reoriented to
evaluated with a SCID-I and an Annett handedness scale. The subjects also the standard orientation for analysis. The volumes were then realigned and
underwent a physical exam and review of current and past medical history. spatially normalized with the Montreal Neurologic Institute (MNI) echop-
Subjects that completed the screening phase received $20. All subjects that lanar imaging template in SPM 2. The resulting images were smoothed,
met criteria were scheduled for the functional MRI examination within the with a 6-mm kernel. An event model was designed for each subject by
following 2 weeks. using deceptive and truthful events convolved with the hemodynamic
Scanning visit. Prior to scanning, female subjects were given a preg- response function. The data were modeled, and estimations were created.
nancy test and excluded if it was positive. The subjects were then escorted Individual analysis was performed with two contrasts: lie (events of de-
to a room in which six objects were located. Fifty-dollar bills were placed ceptive responses) minus true (events of truthful responses), and true
under two of the objects. The subjects were instructed to find both locations minus lie. Significance was defined as p ⬍ .001, with a cluster value of
of the two fifty-dollar bills and to leave them in place. The subjects then pcorrected ⬍ .05. A second-level (random-effects) group analysis was per-
received safety preparation for MRI scanning, including hearing protec- formed with a one-sample t test ( p ⬍ .001, cluster-level pcorrected ⬍ .05) of
tion. Scanning was performed on a 3.0-T Philips Intera (Philips Medical contrast images for both lie minus true and true minus lie. The statistical
Systems, Andover, MA). Images were displayed to the subjects, and threshold used for final display and testing was higher for this study
responses were recorded with the Integrated Functional Imaging System (random-effects model, p ⬍ .001, cluster pcorrected ⬍ .05) than for our prior
(IFIS; MRI Devices Corporation, Gainesville, FL). study (fixed-effects model, p ⬍ .05, cluster p ⬍ .05). MRIcro (Rorden,
Subjects were instructed that while in the MRI scanner, they would see n.d.) was used to determine the anatomic location and Brodmann areas for
pictures of the six objects from the room just visited. The picture of each significant clusters of activation. The SPM functional map was superim-
object would be presented to them multiple times. For each picture, the posed on the T1 template skull-stripped brain image in MRIcro.
subject would indicate whether money was hidden below the object. The
subject would respond “yes” by pushing the right thumb button and “no”
by pressing the right index button of the IFIS system. For one of the objects Results
hiding a fifty-dollar bill (subject’s choice), the subject was instructed to
truthfully respond “yes.” The subject would receive $50 for truthfully
Subjects
responding. For the object hiding the other fifty-dollar bill, the subject was We recruited 14 subjects (1 excluded for taking a medication)
instructed to lie by responding “no.” In addition, the subject was to choose and scanned 13 (6 women). Of these 13 subjects, only 10 (mean
one of the objects not hiding a fifty-dollar bill and deceptively respond
age ⫽ 27.8 years, range ⫽ 20.0 –35.0 years) had usable data; 3 had
“yes.” Therefore, for the two deception conditions, subjects would have to
inhibit the truthful answer regarding the money’s presence or absence and
not adequately followed the protocol. Each of these 3 subjects
give a false response as to whether the money was present. The subject was failed to lie as instructed during one of the two runs. All women
told that a research assistant who did not know the location of the money enrolled were found to have negative pregnancy tests. The average
would attempt to determine when the subject was lying. If the research Annette handedness scale score was 11.2 (range ⫽ 10.0 –12.0).
assistant could not tell when the subject was being deceptive, then the Because each subject chose both one of the two objects hiding854 BRIEF COMMUNICATIONS
money to lie about and one of the four objects not hiding money
to lie about, the order and timing of lying and truthful events were
different across the group.
fMRI
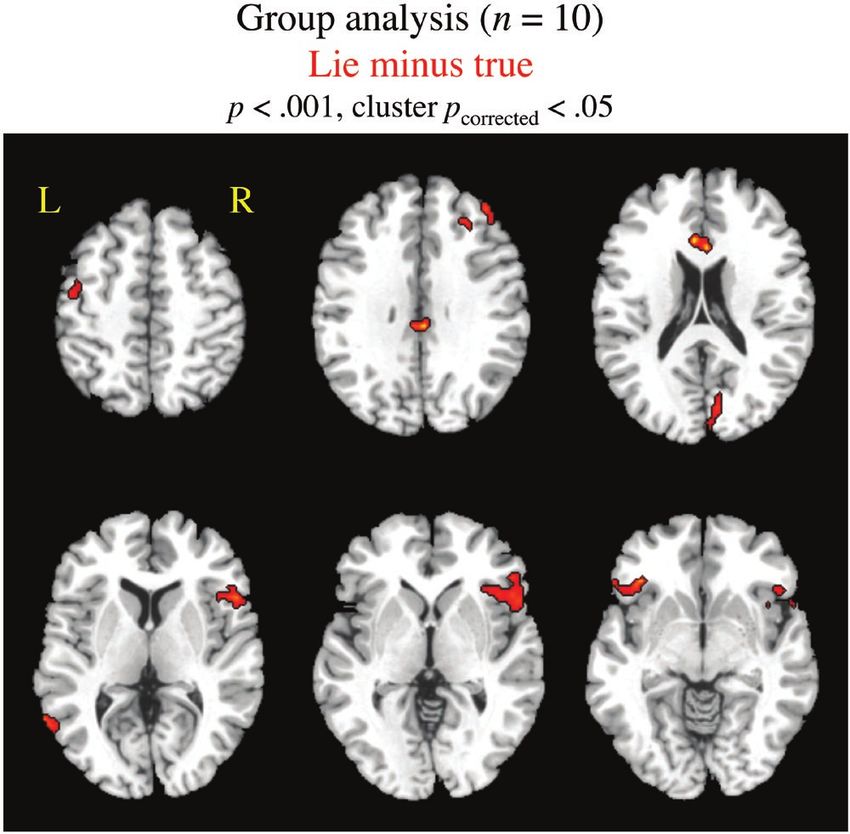
The group analysis for lie minus true revealed significant acti-
vation ( p ⬍ .001, cluster pcorrected ⬍ .05) in five areas (right
anterior cingulate, right inferior frontal, right orbitofrontal, right
middle frontal, and left middle temporal) that are consistent with
our prior deception study (see Table 1 and Figure 1). The group
analysis of true minus lie revealed no areas of significant
activation.
For the within-subject results of lie minus true, there was a
variable degree and pattern of increased BOLD signal. Focusing
on the areas that were significantly activated on the group analysis
during lying in both the current and past study (see Table 2)
showed that 5 subjects had significant activation ( p ⬍ .001, cluster
pcorrected ⬍ .05) in the right orbitofrontal cortex. Two subjects did
not have any significant activation at this threshold. A broader
neuroanatomic perspective (i.e., prefrontal cortex vs. just a portion
of the prefrontal cortex, e.g., the orbitofrontal cortex) revealed that
7 of the 10 subjects had significant right prefrontal activation
during the lie minus true contrast. Figure 1. Group analysis of lie minus true, showing areas of significant
activation. The group analysis results are displayed on a brain template
from MRIcro (Rorden, n.d.). The transverse slices of the brain start dorsal
Discussion and move ventrally. Events of telling the truth were subtracted from events
of lying. Significantly ( p ⬍ .001, cluster pcorrected ⬍ .05) activated regions
This study replicates the group analysis findings from a previous
are indicated by red and yellow. The statistical maps determined with
study using fMRI to detect deception. The group analysis repli- Statistical Parametric Mapping 2 (Wellcome Department of Imaging Neu-
cated five of the brain regions significantly activated for periods of roscience, 2003) were superimposed onto a structural template of the brain
lying minus periods of telling the truth. This study, however, had by means of MRIcro. Areas of significant activation are right middle
a more conservative threshold for statistical significance (random- cingulate, left inferior orbitofrontal, right anterior cingulate,* left anterior
effects model with p ⬍ .001 vs. fixed-effects model with p ⬍ .05) cingulate, right inferior frontal,* right inferior orbitofrontal,* right insula,
and used an event-related design versus a block design. The left middle temporal,* right middle frontal,* right cuneus, and left post-
increased level of statistical significance we observed for these central (asterisks indicate areas of replication from prior functional mag-
regions is perhaps due to the increased number of instances of netic resonance imaging study of detecting deception). L ⫽ left; R ⫽ right.
lying (8 vs. 40) and the increased field strength of the MRI (1.5 T
Table 1
Group Analysis of Lie Minus True (p ⬍ .001, Cluster pcorrected ⬍ .05)
Cluster level Voxel level MNI coordinates
k pcorrected T puncorrected x y z BA Anatomic areaa
65 .006 9.89 .000 4 ⫺28 34 23 R middle cingulate
81 .001 8.53 .000 ⫺40 26 ⫺8 47 L inferior orbitofrontal
56 .013 8.03 .000 4 20 20 24 R anterior cingulateb
⫺4 24 20 24 L anterior cingulate
396 .000 7.32 .000 52 20 4 45 R inferior frontalb
6.17 .000 52 32 0 45 R inferior orbitofrontalb
5.84 .000 44 22 0 47 R insula
67 .005 7.07 .000 ⫺60 ⫺60 8 37 L middle temporalb
52 .020 6.79 .000 42 44 30 46 R middle frontalb
131 .000 6.12 .000 10 ⫺78 20 18 R cuneus
79 .001 6.08 .000 ⫺48 ⫺8 54 6 L postcentral
Note. MNI ⫽ Montreal Neurological Institute; BA ⫽ Brodmann’s area; R ⫽ right; L ⫽ left.
a
Predominate anatomic area of significant blood oxygen level-dependent signal as determined with MRIcro
software (Rorden, n.d.). b Areas of replication from prior functional magnetic resonance imaging study of
detecting deception.BRIEF COMMUNICATIONS 855
Table 2 is needed to understand the specific roles of each region during
Individual Analysis of Lie Minus True (p ⬍ .001, Cluster lying.
pcorrected ⬍ .05) In summary, our study shows that BOLD fMRI is a reasonable
tool for the detection of brain regions involved in deception at a
Subjects group level. For lying, compared with telling the truth, there is
Anatomic location 1 2 6 7 a
8a
9 10 11 12 13 more activation in the right anterior cingulate, right inferior fron-
tal, right orbitofrontal, right middle frontal, and left middle tem-
R ant cingulate x poral areas. The technique was not able to detect, within individ-
R inf frontal x x uals, consistent activation patterns. This does not in any way,
R orbitofrontal x x x x x
L mid temporal x x x
however, establish that activation patterns indicating deception are
R mid frontal x x x not achievable at the individual level, only that further work is
R prefrontal x x x x x x x necessary to determine whether this goal can be achieved. Our
group results are consistent with an emerging literature implicating
Note. x represents activation in the indicated area; blank cells represent activation of these regions when subjects are lying (Ganis et al.,
no activation. R ⫽ right; L ⫽ left; ant ⫽ anterior; inf ⫽ inferior; mid ⫽
middle. 2003; Langleben et al., 2002; Lee et al., 2002; Spence et al., 2001).
a
No region of the brain was found to be significantly activated. Further work is needed to understand what each of these regions
does during lying (arousal, response inhibition, cognitive parsing,
etc.), and which are necessary versus incidental.
vs. 3.0 T). The individual results showed more consistency than
the previous study, with 7 of the 10 subjects having significant
activation in the right prefrontal region. The results, however, do References
not support the use of fMRI—as presently performed—to detect
American Polygraph Association. (1996). Polygraph: Issues and answers.
deception in an individual. As this study shows, however, contin-
Severna Park, MD: American Polygraph Association.
ued improvements in equipment and study design could possibly Annett, M. (1970). A classification of hand preference by association
lead to more consistent and robust results. analysis. British Journal of Psychology, 61, 303–321.
This study is limited by the small sample size of well-screened, Brett, A. S., Phillips, M., & Beary, J. F. (1986). Predictive power of the
unmedicated adults. Thus, any extrapolation to other populations polygraph: Can the “lie detector” really detect liars? Lancet, 1, 544 –547.
such as the medically ill or persons with criminal records is Bush, G., Whalen, P. J., Rosen, B. R., Jenike, M. A., McInerney, S. C., &
unwarranted. In addition, this study was designed to identify brain Rauch, S. L. (1998). The counting Stroop: An interference task special-
regions associated with deceptive answers versus truthful answers, ized for functional neuroimaging—Validation study with functional
not to formally test the method as a means of lie detection. MRI. Human Brain Mapping, 6, 270 –282.
Cohen, J. D., Dunbar, K., & McClelland, J. L. (1990). On the control of
Subsequent work will be needed to determine whether this tech-
automatic processes: A parallel distributed processing account of the
nology can be used to distinguish deceptive responses from truth-
Stroop effect. Psychological Review, 97, 332–361.
ful responses within individuals. Elliott, R., Dolan, R. J., & Frith, C. D. (2000). Dissociable functions in the
One area requiring future study is the manner in which the medial and lateral orbitofrontal cortex: Evidence from human neuroim-
within-subject analysis is performed. Even with only 10 subjects, aging studies. Cerebral Cortex, 10, 308 –317.
there was a large difference between subjects in the number of First, M., Spitzer, R., Williams, J., & Gibbon, M. (1995). Structured
voxels considered to be significantly activated. Individual variabil- Clinical Interview for DSM-IV (SCID). Washington, DC: American
ity in the BOLD response may warrant the use of a method in Psychiatric Press.
which threshold significance is based on an algorithm to determine Ganis, G., Kosslyn, S. M., Stone, S., Thompson, W. L., & Yurgelun-Todd,
the appropriate significance level for an individual versus simply D. A. (2003). Neural correlates of different types of deception: An fMRI
investigation. Cerebral Cortex, 13, 830 – 836.
choosing an arbitrary highly significant number. Also, McGonigle
George, M. S., Ketter, T. A., Parekh, P. I., Rosinsky, N., Ring, H. A.,
and colleagues showed that for an individual subject, there can be
Pazzaglia, P. J., et al. (1997). Blunted left cingulate activation in mood
considerable variability across separate scanning sessions disorder subjects during a response interference task (the Stroop). Jour-
(McGonigle et al., 2000). Accounting for intersubject and inter- nal of Neuropsychiatry and Clinical Neurology, 9, 55– 63.
scan variability will be important for future work in understanding Kozel, F. A., Padgett, T., & George, M. S. (2003). Measuring brain
an individual’s neural correlates of deception. changes associated with deception using 3T BOLD functional MRI.
Other neuroimaging studies have implicated several of the con- [Abstract No. 455]. Human Brain Mapping, 19, S33.
sistently activated regions as being important in cognitive tasks Kozel, F., Revell, L., Lorberbaum, J., Shastri, A., Elhai, J., Horner, M., et
possibly related to deception. The right inferior and orbitofrontal al. (in press). A pilot study of functional MRI brain correlates of
cortex have been correlated with response inhibition as well as deception in healthy young men. Journal of Neuropsychiatry and Clin-
emotion regulation. (Elliott, Dolan, & Frith, 2000; O’Doherty, ical Neurosciences.
Langleben, D. D., Schroeder, L., Maldjian, J. A., Gur, R. C., McDonald, S.,
Kringelbach, Rolls, Hornak, & Andrews, 2001). These regions
Ragland, J. D., et al. (2002). Brain activity during simulated deception:
could inhibit an overlearned response (the truth), especially in An event-related functional magnetic resonance study. NeuroImage, 15,
order to gain a reward. In addition, the executive regions of the 727–732.
cingulate gyrus have been studied for their involvement in atten- Lee, T. M., Liu, H. L., Tan, L. H., Chan, C. C., Mahankali, S., Feng, C. M.,
tion, concentration, and multitasking (Bush et al., 1998; Cohen, et al. (2002). Lie detection by functional magnetic resonance imaging.
Dunbar, & McClelland, 1990; George et al., 1997). Further work Human Brain Mapping, 15, 157–164.856 BRIEF COMMUNICATIONS Lykken, D. T. (1998). A tremor in the blood: Use and abuse of the lie Retrieved October 14, 2003, from http://www.cla.sc.edu/psyc/faculty/ detector. New York: Plenum Press. rorden/mricro.html McGonigle, D. J., Howseman, A. M., Athwal, B. S., Friston, K. J., Spence, S. A., Farrow, T. F., Herford, A. E., Wilkinson, I. D., Zheng, Y., Frackowiak, R. S. J., & Holmes, A. P. (2000). Variability in fMRI: An & Woodruff, P. W. (2001). Behavioural and functional anatomical examination of intersession differences. NeuroImage, 11, 708 –734. correlates of deception in humans. NeuroReport, 12, 2849 –2853. National Research Council. (2002). The polygraph and lie detection. Re- Steinbrook, R. (1992). The polygraph test: A flawed diagnostic method. trieved April 13, 2004, from the National Academies Web site: http:// New England Journal of Medicine, 327, 122–123. www.nap.edu/books/0309084369/html/ Wellcome Department of Imaging Neuroscience. (2003). Statistical para- O’Doherty, J., Kringelbach, M. L., Rolls, E. T., Hornak, J., & Andrews, C. metric mapping 2 (SPM2) [Computer software]. Retrieved May 12, (2001). Abstract reward and punishment representations in the human 2003, from http://www.fil.ion.bpmf.ac.uk/spm/spm2.html orbitofrontal cortex. Nature Neuroscience, 4, 95–102. Ogawa, S., Lee, T. M., Kay, A. R., & Tank, D. W. (1990). Brain magnetic resonance imaging with contrast dependent on blood oxygenation. Pro- Received September 29, 2003 ceedings of the National Academy of Sciences, USA, 87, 9868 –9872. Revision received January 6, 2004 Rorden, C. (n.d.). MRIcro (Version 1.37, Build 4) [Computer software]. Accepted February 13, 2004 䡲
You can also read