Diagnostic accuracy of dual phase 18F FP CIT PET imaging for detection and differential diagnosis of Parkinsonism - Nature
←
→
Page content transcription
If your browser does not render page correctly, please read the page content below
www.nature.com/scientificreports
OPEN Diagnostic accuracy of dual‑phase
18
F‑FP‑CIT PET imaging
for detection and differential
diagnosis of Parkinsonism
Minyoung Oh1, Narae Lee2, Chanwoo Kim4, Hye Joo Son1, Changhwan Sung1, Seung Jun Oh1,
Sang Ju Lee1, Sun Ju Chung3, Chong Sik Lee3 & Jae Seung Kim1*
Delayed phase 18F-FP-CIT PET (dCIT) can assess the striatal dopamine transporter binding to detect
degenerative parkinsonism (DP). Early phase 18F-FP-CIT (eCIT) can assess the regional brain activity
for differential diagnosis among parkinsonism similar with 18F-FDG PET. We evaluated the diagnostic
performance of dual phase 18F-FP-CIT PET (dual CIT) and 18F-FDG PET compared with clinical diagnosis
in 141 subjects [36 with idiopathic Parkinson’s disease (IPD), 77 with multiple system atrophy (MSA),
18 with progressive supranuclear palsy (PSP), and 10 with non-DP)]. Visual assessment of eCIT,
dCIT, dual CIT, 18F-FDG and 18F-FDG PET with dCIT was in agreement with the clinical diagnosis in
61.7%, 69.5%, 95.7%, 81.6%, and 97.2% of cases, respectively. ECIT showed about 90% concordance
with non-DP and MSA, and 8.3% and 27.8% with IPD and PSP, respectively. DCIT showed ≥ 88%
concordance with non-DP, IPD, and PSP, and 49.4% concordance with MSA. Dual CIT showed ≥ 90%
concordance in all groups. 18F-FDG PET showed ≥ 90% concordance with non-DP, MSA, and PSP, but
only 33.3% concordance with IPD. The combination of 18F-FDG and dCIT yielded ≥ 90% concordance in
all groups. Dual CIT may represent a powerful alternative to the combination of 18F-FDG PET and dCIT
for differential diagnosis of parkinsonian disorders.
Parkinsonism is a clinical syndrome characterized by bradykinesia, rigidity, rest tremors, and postural insta-
bility. Idiopathic Parkinson’s disease (IPD) is the most common cause of parkinsonism and is associated with
progressive neuronal loss of the substantia nigra and other brain s tructures1,2. The differential diagnosis of IPD
versus other forms of parkinsonism is important for the treatment and prognosis. However, this is challenging,
especially early in the disease when signs and symptoms of different forms of parkinsonism have greater overlap,
and the error rates in clinicopathological series are as high as 20%3. Such signs and symptoms can also be present
in patients with degenerative parkinsonism (DP), including multiple system atrophy (MSA) and progressive
supranuclear palsy (PSP), non-degenerative parkinsonism (non-DP), including essential tremor (ET), or other
secondary parkinsonism, including drug-induced parkinsonism (DIP)4.
Presynaptic striatal dopamine transporter (DAT) density has been shown to correlate with the density of
dopaminergic neurons. DAT imaging has high sensitivity and specificity for discriminating DP from non-DP5,
and is approved for clinical use in several c ountries6. Among them, N-(3-fluoropropyl)-2β-carboxymethoxy-
3β-(4-iodophenyl) nortropane (18F-FP-CIT) is a PET tracer with demonstrated ability for the detection and dif-
P7–11, based on its higher resolution and specific binding ratio compared to 123I-FP-CIT SPECT12.
ferentiation of D
In addition to DAT tracers, 18F-fluorodeoxyglucose (18F-FDG) PET is a sensitive marker that has been used
for the differentiation of D P13–15, and has yielded concordant or superior results compared to striatal dopamine
D2/D3 receptor (D2R) i maging16. Moreover, combination of DAT and 18F-FDG or perfusion imaging has shown
accurate differentiation between the common forms of DP17–19. Despite this, several clinical drawbacks, including
costs, radiation exposure, reimbursement issues, and the need to visit hospital at least twice, limits the utilization
of dual tracer imaging in clinical settings.
1
Department of Nuclear Medicine, Asan Medical Center, University of Ulsan College of Medicine, 88, Olympic‑ro
43‑gil, Songpa‑gu, Seoul 05505, Korea. 2Department of Nuclear Medicine, Wonju Severance Christian Hospital,
Yonsei University Wonju College of Medicine, Wonju, Korea. 3Department of Neurology, Asan Medical Center,
College of Medicine, University of Ulsan, Seoul, Korea. 4Department of Nuclear Medicine, Kyung Hee University
School of Medicine, Kyung Hee University Hospital At Gangdong, Seoul, Korea. *email: jaeskim@amc.seoul.kr
Scientific Reports | (2021) 11:14992 | https://doi.org/10.1038/s41598-021-94040-8 1
Vol.:(0123456789)www.nature.com/scientificreports/
It has previously shown that early phase imaging of PET tracers with high lipophilicity, including 18F-FP-CIT,
is a potential surrogate biomarker of overall functional brain activity, and has the potential to be used as a sub-
stitute for 18F-FDG PET20–24. Therefore, the goal of the present work was to study the diagnostic performance of
dual phase 18F-FP-CIT PET imaging (early and delayed) for the differential diagnosis of parkinsonism compared
to 18F-FDG PET alone or in combination with 18F-FP-CIT PET.
Methods
Subjects. Subjects who underwent dual-phase 18F-FP-CIT and 18F-FDG PET examination for work up for
parkinsonism within 5 years of symptom onset from September 2008 to August 2016 were included. All patients
were assessed by a neurologist specializing in movement disorders. Among patients with parkinsonism, the
diagnosis of IPD was based on the UK Parkinson’s Disease Society Brain Bank Clinical Diagnostic Criteria25.
Patients with clinically probable MSA-P, MSA-C, or PSP were enrolled based on current diagnostic c riteria26,27.
Their structural MRI was also assessed in order to evaluate other neurological disease, and those who had infarc-
tion in the striatum were excluded. The scanning interval between 18F-FP-CIT PET and 18F-FDG PET was less
than 1 year. The Institutional Review Board (IRB) in the Asan Medical Center(IRB no. 2020–0442) approved this
study protocol and waived informed consent from patients due to the retrospective nature of the study.
18
F‑FP‑CIT PET/CT imaging. 18
F-FP-CIT PET was performed using a Biograph 40 TruePoint PET/CT
camera (Siemens Medical Systems, USA), which provides an in-plane spatial resolution of 2.0 mm full width
at half maximum at the center of the field of view. Images were acquired from 0 to 10 min for early phase and
180–190 min for delayed phase after intravenous injection of 18F-FP-CIT (185 MBq). Emission PET data were
acquired in the 3-dimensional mode after brain CT, which was performed in the spiral mode at 120 kVp and
380 mA (reference standard) using the CARE Dose 4D program. 18F-FP-CIT PET images were reconstructed
from CT data for attenuation correction using the TrueX algorithm and an all-pass filter with a 336 × 336 matrix.
18
F‑FDG PET/CT imaging. The 18F-FDG PET scans were acquired using an ECAT HR + scanner (CTI-
Siemens, Knoxville, Tennessee, USA) in 30 subjects, and using a Discovery 690 scanner (GE healthcare, Wauke-
sha, Wisconsin, USA) in 111 subjects. All subjects fasted for a minimum of 6 h before 18F-FDG PET imaging.
In patients who were studied by the ECAT HR + scanner, transmission scans of 5 min using a rotating pin
source of germanium-68 for attenuation correction, and emission scans of 15 min were acquired 40 min after
intravenous injection of 370 MBq of 18F-FDG. In-plane and axial resolutions of the scanner were 4.3 mm
and 8.3 mm full width at half maximum (FWHM), respectively. Following acquisition, 18F-FDG PET images
were reconstructed using a Gaussian filter (FWHM, 2 mm) and displayed in a 128 × 128 matrix (pixel size,
1.72 × 1.72 mm with a slice thickness of 2.43 mm). Emission images were reconstructed with ordered subset
expectation maximization (OSEM) using 16 subsets and 6 iterations.
In patients studied by the Discovery 690 scanner, computed tomography data for attenuation correction
were acquired first, followed by three-dimensional 18F-FDG PET image acquisition. In-plane and axial resolu-
tions of the scanner were 4.9 mm and 5.6 mm FWHM, respectively. 18F-FDG PET images were reconstructed
using a Gaussian filter (FWHM, 2 mm) and displayed in a 256 × 256 matrix (pixel size, 0.98 × 0.98 mm with a
slice thickness of 3.27 mm). Emission images were reconstructed with OSEM using 24 subsets and 2 iterations.
Visual assessment. All PET images were visually assessed by a panel of two independent observers, who
were board-certified nuclear medicine physicians with 20 and 5 years of clinical experience in neuro-nuclear
medicine for each. Any discrepancies were resolved by a third reviewer. They were blinded to all clinical and
diagnostic information. The visual interpretation criteria for the diagnosis of parkinsonism for delayed phase
18
F-FP-CIT PET was based on the pattern of DAT loss in the striatum as described previously, and classified as
non-degenerative parkinsonism (non-DP), IPD, MSA, or P SP8. Representative PET images are shown in Fig. 1.
Briefly, the pattern of non-DP was defined as symmetric and even DAT binding without focal deficit in the bilat-
eral striatum. For IPD, decreased DAT binding of the bilateral dorsal posterior putamen was observed, with rela-
tive sparing of the ventral putamen. For MSA, DAT loss was observed not only in the posterior putamen, but also
in the ventral putamen. PSP was characterized by extensive DAT loss in both the putamen and caudate nuclei.
For 18F-FDG PET and early phase 18F-FP-CIT PET, visual interpretation was based on the metabolic pattern
or brain activity of the cerebral or cerebellar cortex and subcortical gray matter as published previously13,28. In
short, the pattern for IPD was characterized by normal striatal metabolism or hypermetabolism in the bilateral
dorsolateral putamen, MSA was characterized by hypometabolism in the basal ganglia and/or in the cerebellar
cortex, PSP was characterized by hypometabolism in the medial frontal cortices and midbrain, while the others
were classified as non-degenerative parkinsonism. MSA was further divided into cerebellar type (hypometabo-
lism in cerebellar cortex and not in the basal ganglia), mixed type (hypometabolism in both the cerebellar cortex
and basal ganglia), or parkinsonian type (hypometabolism in the basal ganglia and not in the cerebellar cortex).
Statistical analyses. Descriptive statistics included mean ± standard deviation or frequencies for each
clinical characteristic. The chi-squared test was used for categorical variables, and a one-way analysis of vari-
ance was used for quantitative variables (one-way ANOVA) with a normal distribution, and nonparametric tests
(Kruskal–Wallis test) for quantitative variables without a normal distribution. P-values were based on two-sided
tests and were considered statistically significant if P < 0.05 for global comparison, and P < 0.05/n for subgroup
analyses to take into account the multiple comparisons. The confidence interval was be calculated based on an
asymptotic variance estimate. Inter-observer agreement of the visual assessment results was assessed on the
Scientific Reports | (2021) 11:14992 | https://doi.org/10.1038/s41598-021-94040-8 2
Vol:.(1234567890)www.nature.com/scientificreports/
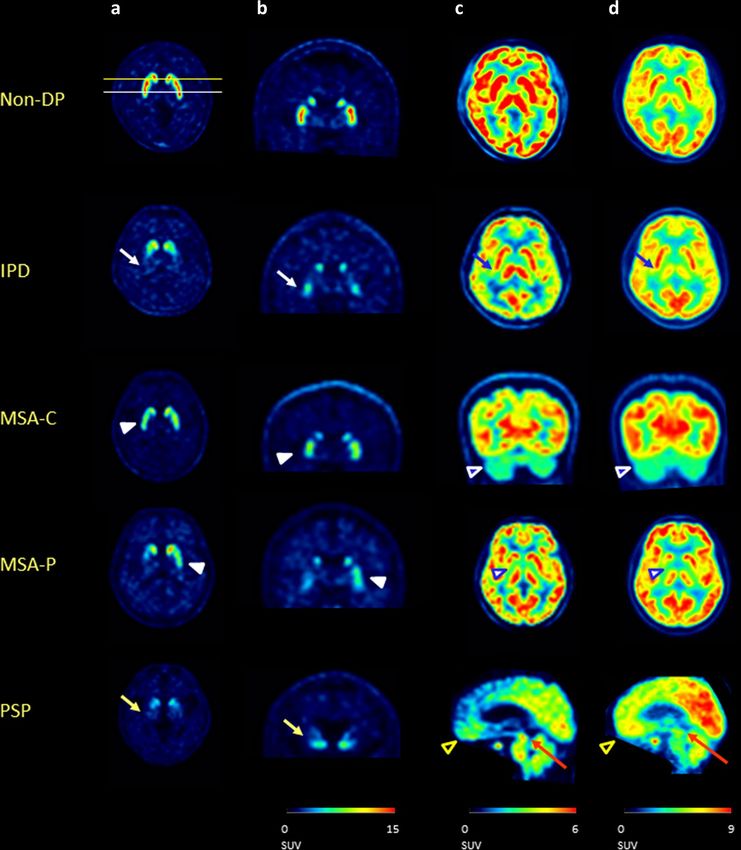
Figure 1. Examples of axial (a) and coronal slice (b) of delayed phase 18F-FP-CIT PET, early phase 18F-FP-
CIT PET (c), and 18F-FDG PET (d) of patients with non-degenerative parkinsonism (1st row), IPD (2nd row),
MSA-C (3rd row), MSA-P (4th row), and PSP (5th row). The patient with IPD (2nd row) showed decreased
DAT binding of the bilateral dorsal posterior putamen, with relative sparing of the ventral putamen (white
arrow) on delayed phase 18F-FP-CIT PET, and normal striatal metabolism or hypermetabolism in the bilateral
dorsolateral putamen on early phase 18F-FP-CIT PET and 18F-FDG -PET (blue arrow). The patient with MSA-C
and MSA-P (3rd and 4th rows), shows DAT loss not only in the posterior putamen, but also in the ventral
putamen (white arrow head) on delayed phase 18F-FP-CIT PET. On early phase 18F-FP-CIT PET and 18F-
FDG -PET, MSA showed hypometabolism in the cerebellar cortex (blue arrow head with white outline) and/
or hypometabolism in the basal ganglia (blue arrow head with white outline. The patient with PSP showed
extensive DAT loss on both the putamen and caudate nuclei on delayed phase 18F-FP-CIT PET (yellow arrow),
which was characterized by hypometabolism in the medial frontal cortices (black arrow head with yellow
outline) and midbrain (red arrow) on early phase 18F-FP-CIT PET and 18F-FDG PET. All PET images were
processed using PMOD 4.0 (PMOD Technologies Ltd., Zurich, Switzerland).
Scientific Reports | (2021) 11:14992 | https://doi.org/10.1038/s41598-021-94040-8 3
Vol.:(0123456789)www.nature.com/scientificreports/
Total Non-DP IPD MSA-C MSA-P PSP
(n = 141) (n = 10) (n = 36) (n = 46) (n = 31) (n = 18)
Age (years) 63.9 ± 8.2 65.0 ± 8.2 57.3 ± 8.2 60.9 ± 8.4 64.5 ± 7.7
Sex (male, female) 4:6 16:20 26:20 8:23 10:8
Symptom duration at FP-CIT PET (years) NA 2.1 ± 1.9 1.8 ± 1.3 2.4 ± 1.5 2.5 ± 1.4
Hoehn and Yahr stage NA 2.2 ± 0.7 NA NA NA
UPDRS III NA 17.6 ± 9.4 NA NA NA
Duration from initial visit to PET (years) 0.1 ± 0.1 0.9 ± 1.9 0.4 ± 0.7 0.9 ± 1.1 0.9 ± 1.0
Follow-up after FP-CIT PET (years) 2.0 ± 1.7 3.9 ± 2.8 2.3 ± 1.9 2.2 ± 2.1 3.0 ± 2.6
Scanning interval (days) 29.8 ± 84.1 37.6 ± 111.1 16.7 ± 55.4 14.9 ± 33.3 7.1 ± 161.8
Table 1. Demographics and clinical characteristics. Non-DP non-degenerative parkinsonism, PET positron
emission tomography, FU follow-up, IPD idiopathic Parkinson’s disease, MSA-P multiple system atrophy,
Parkinson type, MSA-C multiple system atrophy, cerebellar type, PSP progressive supranuclear palsy, UPDRS
unified Parkinson’s disease rating scale, NA not applicable.
subject level using kappa values across two blinded readers. Analyses were performed using SPSS software (Sta-
tistical Package for the Social Science, version 21.0, Chicago, IL, USA).
Ethics approval. All procedures performed in studies involving human participants were in accordance
with the ethical standards of the institutional research committee and with the principles of the1964 Declaration
of Helsinki and its later amendments.
Results
Subjects. The demographics and clinical characteristics of the subjects are summarized in Table 1. Among
the 141 subjects, the average age was 61.7 ± 9.3 years, and 45.4% of the subjects were male. The mean duration
of symptoms to 18F-FP-CIT PET was 2.0 ± 1.4 years, while the mean duration from the initial visit to 18F-FP-CIT
PET was 0.6 ± 1.0 years. The mean clinical follow-up after 18F-FP-CIT PET was 2.8 ± 2.4 years, and the mean
scanning interval between 18F-FP-CIT and 18F-FDG PET was 7.5 ± 82.0 days. Among patients with IPD, the
mean Hoehn and Yahr stage was 2.2 ± 0.7, and the mean UPDRS III scores were 17.6 ± 9.4.
Visual assessment. Visual assessment of early phase 18F-FP-CIT PET, delayed phase 18F-FP-CIT PET,
early and delayed (dual) phase 18F-FP-CIT PET, 18F-FDG PET, and 18F-FDG and delayed phase 18F-FP-CIT PET
images were in agreement with the clinical diagnosis in 61.7%, 69.5%, 95.7%, 81.6%, and 97.2% of cases, respec-
tively (Table 2). Representative PET images are shown in Fig. 1. Visual assessment of each PET scan of subjects
with clinical diagnosis followed more than 1 year after PET scans also showed similar results of 57.3%, 68.0%,
96.1%, 78.6%, and 97.1% of cases, respectively (Table 3).
Early phase 18F-FP-CIT PET images showed 90.0% and 90.9% concordance with clinical diagnosis in subjects
with non-DP and MSA, respectively, and 8.3% and 27.8% in subjects with IPD and PSP, respectively. Delayed
phase 18F-FP-CIT PET images showed 100.0%, 94.4%, and 88.9% concordance in subjects with non-DP, IPD,
and PSP, and 49.4% concordance with subjects with MSA. Dual phase 18F-FP-CIT PET images showed similar or
higher than 90% concordance in all groups. 18F-FDG PET images showed equal or greater than 90% concordance
in subjects with non-DP, MSA, and PSP, but only 33.3% concordance in subjects with IPD. The combination of
18
F-FDG and delayed phase 18F-FP-CIT PET images yielded over 90% concordance in all groups.
Visual assessment of early phase 18F-FP-CIT PET showed 88.9% and 97.2% concordance with those of 18F-
FDG PET in subjects with non-DP and MSA-C, 41.7–61.1% concordance in imaging subtypes of MSA in subjects
with MSA-P, and 27.8% concordance in subjects with PSP. Delayed phase 18F-FP-CIT PET showed 100.0% and
88.9% concordance with 18F-FDG PET and clinical diagnosis in subjects with non-DP and PSP, 58.7–77.8%
concordance in imaging subtypes of MSA in subjects with MSA-P, and 25.0–88.9% concordance in concordance
in imaging subtypes of MSA in subjects with MSA-C. In subjects with IPD, it showed 94.4% concordance with
delayed phase 18F-FP-CIT PET, but 33.3% concordance with 18F-FDG PET (Table 4).
In visual assessment of each PET scan, the κ value of the two raters for early phase 18F-FP-CIT PET, delayed
phase 18F-FP-CIT PET, early and delayed (dual) phase 18F-FP-CIT PET, 18F-FDG PET, and 18F-FDG and delayed
phase 18F-FP-CIT PET images were 0.94, 0.76, 0.87, 0.64, and 0.90 respectively.
Discussion
In this study, we evaluated the diagnostic performance of dual phase 18F-FP-CIT PET for the detection and dif-
ferentiation of degenerative parkinsonism. To this end, we compared early phase 18F-FP-CIT PET and delayed
phase 18F-FP-CIT PET with clinical diagnosis or 18F-FDG PET, either respectively or in combination. Our results
showed that early phase 18F-FP-CIT PET can differentiate MSA from other types of DP, and that delayed phase
18
F-FP-CIT PET can not only detect DP from non-DP, but also differentiate PSP from others. Overall, our find-
ings indicated that dual phase 18F-FP-CIT PET can provide equivalent information on overall functional activity
and DAT availability compared to a combination of 18F-FDG PET and delayed phase 18F-FP-CIT PET for the
differential diagnosis of parkinsonian disorders with a single injection.
Scientific Reports | (2021) 11:14992 | https://doi.org/10.1038/s41598-021-94040-8 4
Vol:.(1234567890)www.nature.com/scientificreports/
Clinical diagnosis
Non-DP IPD MSA PSP
PET Visual assessment (n = 10) (n = 36) (n = 77) (n = 18)
Non-DP 9 (90.0%) 31 (86.1%) 5 (6.5%) 8 (44.4%)
IPD 0 (0.0%) 3 (8.3%) 1 (1.3%) 2 (11.1%)
Early FPCIT
MSA 1 (10.0%) 1 (2.8%) 70 (90.9%) 3 (16.7%)
PSP 0 (0.0%) 1 (2.8%) 1 (1.3%) 5 (27.8%)
Non-DP 10 (100.0%) 1 (2.8%) 28 (36.4%) 0 (0.0%)
IPD 0 (0.0%) 34 (94.4%) 9 (11.7%) 0 (0.0%)
Delayed FPCIT
MSA 0 (0.0%) 0 (0.0%) 38 (49.4%) 2 (11.1%)
PSP 0 (0.0%) 1 (2.8%) 2 (2.6%) 16 (88.9%)
Non-DP 9 (90.0%) 2 (5.6%) 2 (2.6%) 0 (0.0%)
IPD 0 (0.0%) 33 (91.7%) 0 (0.0%) 2 (11.1%)
Dual FPCIT
MSA 1 (10.0%) 0 (0.0%) 77 (100.0%) 0 (0.0%)
PSP 0 (0.0%) 1 (2.8%) 0 (0.0%) 16 (88.9%)
Non-DP 9 (90.0%) 17 (47.2%) 1 (1.3%) 0 (0.0%)
IPD 1 (10.0%) 12 (33.3%) 0 (0.0%) 0 (0.0%)
FDG
MSA 0 (0.0%) 6 (16.7%) 76 (98.7%) 0 (0.0%)
PSP 0 (0.0%) 1 (2.8%) 0 (0.0%) 18 (100.0%)
Non-DP 10 (100.0%) 2 (5.6%) 0 (0.0%) 0 (0.0%)
IPD 0 (0.0%) 33 (91.7%) 0 (0.0%) 0 (0.0%)
FDG + delayed FPCIT
MSA 0 (0.0%) 0 (0.0%) 77 (100.0%) 0 (0.0%)
PSP 0 (0.0%) 1 (2.8%) 0 (0.0%) 17 (94.4%)
Table 2. Classification matrix of visual assessment of PET scans compared to clinical diagnosis.
Clinical diagnosis
Non-DP IPD MSA PSP
PET Visual assessment (n = 6) (n = 31) (n = 52) (n = 14)
NC 6 (100.0%) 26 (83.9%) 5 (9.6%) 8 (57.1%)
IPD 0 (0.0%) 3 (9.7%) 1 (1.9%) 1 (7.1%)
Early FPCIT
MSA 0 (0.0%) 1 (3.2%) 45 (86.5%) 0 (0.0%)
PSP 0 (0.0%) 1 (3.2%) 1 (1.9%) 5 (35.7%)
NC 6 (100.0%) 1 (3.2%) 20 (38.5%) 0 (0.0%)
IPD 0 (0.0%) 30 (96.8%) 8 (15.4%) 0 (0.0%)
Delayed FPCIT
MSA 0 (0.0%) 0 (0.0%) 22 (42.3%) 2 (14.3%)
PSP 0 (0.0%) 0 (0.0%) 2 (3.8%) 12 (85.7%)
NC 6 (100.0%) 2 (6.5%) 0 (0.0%) 0 (0.0%)
IPD 0 (0.0%) 29 (93.5%) 0 (0.0%) 2 (14.3%)
Dual FPCIT
MSA 0 (0.0%) 0 (0.0%) 52 (100.0%) 0 (0.0%)
PSP 0 (0.0%) 0 (0.0%) 0 (0.0%) 12 (85.7%)
NC 5 (83.3%) 14 (45.2%) 1 (1.9%) 0 (0.0%)
IPD 1 (16.7%) 11 (35.5%) 0 (0.0%) 0 (0.0%)
FDG
MSA 0 (0.0%) 6 (19.4%) 51 (98.1%) 0 (0.0%)
PSP 0 (0.0%) 0 (0.0%) 0 (0.0%) 14 (100.0%)
NC 6 (100.0%) 2 (6.5%) 0 (0.0%) 0 (0.0%)
IPD 0 (0.0%) 29 (93.5%) 0 (0.0%) 1 (7.1%)
FDG + delayed FPCIT
MSA 0 (0.0%) 3 (9.7%) 52 (100.0%) 0 (0.0%)
PSP 0 (0.0%) 0 (0.0%) 0 (0.0%) 13 (92.9%)
Table 3. Classification matrix of visual assessment of PET scans compared to clinical diagnosis in subjects
followed for more than 1 year after PET scan.
Tracers with high lipophilicity may have a higher first-pass influx rate (K1); therefore, early phase 18F-FP-CIT
PET imaging can provide a measure of the rate of ligand influx into the brain, K 120. Regional K1 is highly cor-
related with regional cerebral blood flow. As blood flow is coupled tightly to metabolism, early phase 18F-FP-CIT
Scientific Reports | (2021) 11:14992 | https://doi.org/10.1038/s41598-021-94040-8 5
Vol.:(0123456789)www.nature.com/scientificreports/
Non-DP IPD MSA-C MSA-P PSP
Clinical diagnosis (n = 10) (n = 36) (n = 46) (n = 31) (n = 18)
Non-DP IPD Non-DP IPD MSA-C MSA-P PSP Non-DP MSA-C MSA-M MSA-C MSA-M MSA-P PSP
FDG (n = 9) (n = 1) (n = 17) (n = 12) (n = 3) (n = 3) (n = 1) (n = 1) (n = 36) (n = 9) (n = 1) (n = 18) (n = 12) (n = 18)
8 1 16 10 2 2 1 0 1 0 0 0 4 8
Non-DP
(88.9%) (100.0%) (94.1%) (83.3%) (66.7%) (66.7%) (100.0%) (0.0%) (2.8%) (0.0%) (0.0%) (0.0%) (33.3%) (44.4%)
0 0 0 2 0 1 0 0 0 0 0 1 0 2
IPD
(0.0%) (0.0%) (0.0%) (16.7%) (0.0%) (33.3%) (0.0%) (0.0%) (0.0%) (0.0%) (0.0%) (6.7%) (0.0%) (11.1%)
1 0 0 0 1 0 0 1 35 2 1 1 0 2
MSA-C
Early FP- (11.1%) (0.0%) (0.0%) (0.0%) (33.3%) (0.0%) (0.0%) (100.0%) (97.2%) (22.2%) (50.0%) (6.7%) (0.0%) (11.1%)
CIT 0 0 0 0 0 0 0 0 0 7 0 11 2 0
MSA-M
(0.0%) (0.0%) (0.0%) (0.0%) (0.0%) (0.0%) (0.0%) (0.0%) (0.0%) (77.8%) (0.0%) (61.1%) (14.2%) (0.0%)
0 0 0 0 0 0 0 0 0 0 0 5 5 1
MSA-P
(0.0%) (0.0%) (0.0%) (0.0%) (0.0%) (0.0%) (0.0%) (0.0%) (0.0%) (0.0%) (0.0%) (27.8%) (41.7%) (5.6%)
0 0 1 0 0 0 0 0 0 0 0 0 1 5
PSP
(0.0%) (0.0%) (5.7%) (0.0%) (0.0%) (0.0%) (0.0%) (0.0%) (0.0%) (0.0%) (0.0%) (0.0%) (7.1%) (27.8%)
9 1 0 0 0 1 0 1 25 1 0 1 0 0
Non-DP
(100.0%) (100%) (0.0%) (0.0%) (0.0%) (33.3%) (0.0%) (100.0%) (69.4%) (11.1%) (0.0%) (5.6%) (0.0%) (0.0%)
0 0 17 12 3 2 0 0 2 0 1 1 5 0
IPD
Delayed (0.0%) (0.0%) (100.0%) (100.0%) (100%) (66.7%) (0.0%) (0.0%) (5.6%) (0.0%) (100.0%) (5.6%) (41.7%) (0.0%)
FP-CIT 0 0 0 0 0 0 0 0 9 8 0 14 7 2
MSA
(0.0%) (0.0%) (0.0%) (0.0%) (0.0%) (0.0%) (0.0%) (0.0%) (25.0%) (88.9%) (0.0%) (77.8%) (58.3%) (11.1%)
0 0 0 0 0 0 1 0 0 0 0 2 0 16
PSP
(0.0%) (0.0%) (0.0%) (0.0%) (0.0%) (0.0%) (100.0%) (0.0%) (0.0%) (0.0%) (0.0%) (11.1%) (0.0%) (88.9%)
Table 4. Classification matrix of visual assessment of early and delayed phase FP-CIT PET compared to FDG
PET according to clinical diagnosis.
PET can provide similar diagnostic information to 18F-FDG PET. Typical pathologic patterns in the overall
brain functional activity that show neuronal dysfunction and degeneration, could be recognized for different
parkinsonian disorders in both images as we have previously reported 25.
However, diagnostic performance of early phase 18F-FP-CIT PET is variable among groups. It correctly
classified MSA but not in PSP which is different from 18F-FDG PET. Furthermore, the characteristic metabolic
pattern of PSP is hypometabolism on the medial frontal cortex and midbrain. Early or perfusion phase imaging
usually underestimates cortical perfusion than that of cerebellum compared to the m etabolism22. This leads to
a smaller regional difference in cortical perfusion, which is less than that of the metabolism; this represents a
hurdle for the detection of hypoperfusion in the medial frontal cortex on early phase images in subjects with
PSP. In dynamic imaging of 18F-FP-CIT PET, the time activity curve showed moderate uptake in the midbrain
in subjects with IPD, which reflected serotonergic binding in these regions29. These findings suggest that activi-
ties of the midbrain can affect both blood flow and serotonergic binding that can interfere with the detection of
hypoperfusion of the midbrain in subjects with PSP. Furthermore, the low signal to noise ratio of early phase
images could be disadvantageous to evaluate the perfusion of small lesion such as those in the m idbrain24,28.
18
Similarly, delayed phase F-FP-CIT PET can discriminate IPD and PSP from other types of parkinsonism
well, but not in MSA. Over two thirds of the subjects with MSA-C, clinically and metabolically, showed a visually
normal DAT binding pattern on delayed image. However, severe DAT loss was observed both in the putamen
and caudate in subjects with PSP, which is consistent with previous r eports8,9.
A clinical implementation of dual phase 18F-FP-CIT PET for the differential diagnosis of parkinsonian disor-
ders has several advantages over a combination of 18F-FDG PET and delayed phase 18F-FP-CIT PET for reducing
the radiation dose, and saving time and cost to the patients. When only using a single 18F-FDG PET scan, the
radiation dose is reduced by approximately 70% from about 10 mSv for the combination of 18F-FDG PET and
delayed phase 18F-FP-CIT PET to approximately 2.7 mSv for 18F-FP-CIT PET30. From a patient perspective, a
single scan is more convenient and inexpensive than a dual examination. Furthermore, there is no need for fasting
several hours before scanning, and a quiet and dimly lit waiting room is provided for optimal glucose utilization
in the brain. Finally, the acquisition of early phase 18F-FP-CIT PET images only takes 10 min and there is no need
for processing on the contrary to generate the parametric relative delivery image (R1). The R1 image requires
dynamic acquisition for more than 2 h, which certainly increases the risk for significant movement. However, the
clinical utilization can be impaired since the majority of candidates for 18F-FP-CIT PET have parkinsonism and
cannot cooperate for such a long time in the same position. This could also be problematic for the PET facility
due to the longer time spent occupying the scanner.
The present study was subject to some limitations. First, the composition of the study population in terms
of the different types of parkinsonian disorders was not representative of the usual prevalence of each disease,
which is over 70% for IPD, followed by MSA and PSP. Subjects with IPD or non-DP generally do not undergo
both 18F-FP-CIT PET and 18F-FDG PET. Differential diagnosis of parkinsonism is performed at specialized
hospitals, which often have a high prevalence of atypical parkinsonism, including MSA or PSP. Second, the use
of clinical diagnosis as a gold standard may be problematic. As mentioned before, diagnosing PD correctly based
on clinical symptoms can be difficult, and misdiagnosis occurs in up to 25% of patients in general practice. We
have tried to overcome this limitation by using movement disorder specialists for selecting the participants.
Scientific Reports | (2021) 11:14992 | https://doi.org/10.1038/s41598-021-94040-8 6
Vol:.(1234567890)www.nature.com/scientificreports/
Indeed, the diagnostic performance was consistent in the subgroup of the study population followed up for more
than 1 year. Finally, we did not perform quantitative analysis, which would have provided valuable information
about the degree of DAT loss, especially in patients with MSA-C with a visually normal DAT binding pattern on
delayed 18F-FP-CIT PET. However, these additional analyses require more time and effort and are not readily
available in routine clinical practice.
In summary, dual phase 18F-FP-CIT PET may represent a powerful alternative to the combination of 18F-
FDG PET and delayed 18F-FP-CIT PET for the detection and differential diagnosis of parkinsonian disorders.
Data availability
The datasets generated during and/or analysed during the current study are available from the corresponding
author on reasonable request.
Received: 6 April 2021; Accepted: 25 June 2021
References
1. Braak, H. et al. Staging of brain pathology related to sporadic Parkinson’s disease. Neurobiol. Aging 24, 197–211 (2003).
2. Dickson, D. W. et al. Neuropathological assessment of Parkinson’s disease: refining the diagnostic criteria. Lancet Neurol. 8,
1150–1157 (2009).
3. Hughes, A. J., Daniel, S. E., Kilford, L. & Lees, A. J. Accuracy of clinical diagnosis of idiopathic Parkinson’s disease: a clinico-
pathological study of 100 cases. J. Neurol. Neurosurg. Psychiatry 55, 181–184 (1992).
4. Tolosa, E., Wenning, G. & Poewe, W. The diagnosis of Parkinson’s disease. Lancet Neurol. 5, 75–86 (2006).
5. Benamer, H. T. et al. Accurate differentiation of parkinsonism and essential tremor using visual assessment of [123I]-FP-CIT
SPECT imaging: the [123I]-FP-CIT study group. Mov. Disord. Official Jo. Mov. Disord. Soc. 15, 503–510 (2000).
6. Park, E. A new era of clinical dopamine transporter imaging using 123I-FP-CIT. J. Nucl. Med. Technol. 40, 222–228 (2012).
7. Oral Presentations_Tuesday. Eur. J. Nucl. Med. Mol. Imag. 36, 234–259 (2009).
8. Oh, M. et al. Subregional patterns of preferential striatal dopamine transporter loss differ in Parkinson disease, progressive supra-
nuclear palsy, and multiple-system atrophy. J. Nucl. Med. 53, 399–406 (2012).
9. Han, S. et al. Subregional pattern of striatal dopamine transporter loss on 18F FP-CIT positron emission tomography in patients
with pure akinesia with gait freezing. JAMA Neurol. 73, 1477–1484 (2016).
10. Kim, H. W. et al. Different loss of dopamine transporter according to subtype of multiple system atrophy. Eur. J. Nucl. Med. Mol.
Imaging 43, 517–525 (2016).
11. Yoo, H. S. et al. The role of 18F-FP-CIT PET in differentiation of progressive supranuclear palsy and frontotemporal dementia in
the early stage. Eur. J. Nucl. Med. Mol. Imaging 45, 1585–1595 (2018).
12. Lee, I. et al. Head-to-head comparison of 18F-FP-CIT and 123I-FP-CIT for dopamine transporter imaging in patients with Par-
kinson’s disease: a preliminary study. Synapse 72, e22032 (2018).
13. Eckert, T. et al. FDG PET in the differential diagnosis of parkinsonian disorders. Neuroimage 26, 912–921 (2005).
14. Juh, R., Kim, J., Moon, D., Choe, B. & Suh, T. Different metabolic patterns analysis of Parkinsonism on the 18F-FDG PET. Eur. J.
Radiol. 51, 223–233 (2004).
15. Hellwig, S. et al. [18F] FDG-PET is superior to [123I] IBZM-SPECT for the differential diagnosis of parkinsonism. Neurology 79,
1314–1322 (2012).
16. Antonini, A. et al. Complementary PET studies of striatal neuronal function in the differential diagnosis between multiple system
atrophy and Parkinson’s disease. Brain J. Neurol. 120, 2187–2195 (1997).
17. Van Laere, K. et al. Dual-tracer dopamine transporter and perfusion SPECT in differential diagnosis of parkinsonism using
template-based discriminant analysis. J. Nucl. Med. 47, 384–392 (2006).
18. El Fakhri, G. et al. Quantitative simultaneous 99m Tc-ECD/123 I-FP-CIT SPECT in Parkinson’s disease and multiple system
atrophy. Eur. J. Nucl. Med. Mol. Imaging 33, 87–92 (2006).
19. Takaya, S. et al. Differential diagnosis of parkinsonian syndromes using dopamine transporter and perfusion SPECT. Parkinsonism
Relat. Disord. 47, 15–21 (2018).
20. Koeppe, R. A. et al. 11C-DTBZ and 18F-FDG PET measures in differentiating dementias. J. Nucl. Med. 46, 936–944 (2005).
21. Hammes, J., Leuwer, I., Bischof, G. N., Drzezga, A. & van Eimeren, T. Multimodal correlation of dynamic [18 F]-AV-1451 perfu-
sion PET and neuronal hypometabolism in [18 F]-FDG PET. Eur. J. Nucl. Med. Mol. Imaging 44, 2249–2256 (2017).
22. Hsiao, T. et al. Correlation of early-phase 18 F-florbetapir (AV-45/Amyvid) PET images to FDG images: preliminary studies. Eur.
J. Nucl. Med. Mol. Imaging 39, 613–620 (2012).
23. Brendel, M. et al. Perfusion-phase [18F] THK5351 Tau-PET imaging as a surrogate marker for neurodegeneration. J. Alzheimer’s
Dis. Rep. 1, 109–113 (2017).
24. Jin, S. et al. Additional value of early-phase 18F-FP-CIT PET image for differential diagnosis of atypical parkinsonism. Clin. Nucl.
Med. 42, e80–e87 (2017).
25. Hughes, A., Ben-Shlomo, Y., Daniel, S. & Lees, A. UK Parkinson’s disease society brain bank clinical diagnostic criteria. J. Neurol.
Neurosurg. Psychiatr. 55, e4 (1992).
26. Gilman, S. et al. Second consensus statement on the diagnosis of multiple system atrophy. Neurology 71, 670–676 (2008).
27. Litvan, I. et al. Clinical research criteria for the diagnosis of progressive supranuclear palsy (Steele-Richardson-Olszewski syn-
drome): report of the NINDS-SPSP international workshop. Neurology 47, 1–9 (1996).
28. Jin, S. et al. Differential diagnosis of parkinsonism using dual-phase F-18 FP-CIT PET imaging. Nucl. Med. Mol. Imaging 47, 44–51
(2013).
29. Kazumata, K. et al. Dopamine transporter imaging with fluorine-18-FPCIT and PET. J. Nucl. Med. 39, 1521–1530 (1998).
30. Robeson, W. et al. Dosimetry of the dopamine transporter radioligand 18F-FPCIT in human subjects. J. Nucl. Med. 44, 961–966
(2003).
Acknowledgements
This research was supported by a grant from the Korea Health Technology R&D Project through the Korea
Health Industry Development Institute (KHIDI), funded by the Ministry of Health & Welfare, Republic of Korea
(grant number: HI18C2383) and by the National Research Foundation of Korea(NRF) grant funded by the Korea
government(MSIT) (No. 2021R1A2C3009056).
Scientific Reports | (2021) 11:14992 | https://doi.org/10.1038/s41598-021-94040-8 7
Vol.:(0123456789)www.nature.com/scientificreports/
Author contributions
M.O. and J.S.K. were involved in conception and design of the study. N.L., C.K., H.J.S, C.S., S.J.L. and S.J.O. were
involved in collection and analysis of data. S.J.C. and C.S.L. provided clinical supervision and consultation. All
authors reviewed and approved the final manuscript. J.S.K. was the principal investigator.
Competing interests
The authors declare no competing interests.
Additional information
Correspondence and requests for materials should be addressed to J.S.K.
Reprints and permissions information is available at www.nature.com/reprints.
Publisher’s note Springer Nature remains neutral with regard to jurisdictional claims in published maps and
institutional affiliations.
Open Access This article is licensed under a Creative Commons Attribution 4.0 International
License, which permits use, sharing, adaptation, distribution and reproduction in any medium or
format, as long as you give appropriate credit to the original author(s) and the source, provide a link to the
Creative Commons licence, and indicate if changes were made. The images or other third party material in this
article are included in the article’s Creative Commons licence, unless indicated otherwise in a credit line to the
material. If material is not included in the article’s Creative Commons licence and your intended use is not
permitted by statutory regulation or exceeds the permitted use, you will need to obtain permission directly from
the copyright holder. To view a copy of this licence, visit http://creativecommons.org/licenses/by/4.0/.
© The Author(s) 2021
Scientific Reports | (2021) 11:14992 | https://doi.org/10.1038/s41598-021-94040-8 8
Vol:.(1234567890)You can also read