Acquisition of Roofing Supply Group - Strategic combination of two leading roofing distributors
←
→
Page content transcription
If your browser does not render page correctly, please read the page content below
Acquisition of Roofing Supply Group
Strategic combination of two leading roofing distributors

July 27, 2015
Disclaimer

    Before we begin, I would like to remind you that during the course of this conference call, management may make statements that are not purely historical facts
    or that necessarily depend upon future events, including statements about expected market share gains, forecasted financial performance or other statements
    about anticipations, beliefs, expectations, hopes, intentions or strategies for the future, such statements are considered forward-looking statements within the
    meaning of Section 21E of the Securities Exchange Act of 1934, as amended. You are cautioned not to place undue reliance on forward-looking statements.
    All forward-looking statements are based upon information available to Beacon Roofing Supply on the date hereof. Beacon Roofing Supply undertakes no
    obligation to publicly update or revise any such forward-looking statements, whether as a result of new information, future events or otherwise. Such forward-
    looking statements involve risks and uncertainties that could cause actual events or results to differ materially from the events or results described in the
    forward-looking statements, including risks or uncertainties related to the Company’s growth strategies, including gaining market share, or the Company’s
    revenues and operating results being highly dependent on, among other things, the homebuilding industry, asphalt shingle prices and the economy. The
    Company may not succeed in addressing these and other risks. Further information regarding factors that could affect the Company’s financial and other
    results can be found in the risk factors section of Beacon Roofing Supply‘s most recent annual report on Form 10-K filed with the Securities and Exchange
    Commission. Consequently, all forward-looking statements made on this call are qualified by the factors, risks and uncertainties contained therein.

    In addition, numerous factors could cause actual results with respect to Beacon Roofing Supply’s proposed acquisition to differ materially from those in the
    forward-looking statements, including without limitation, the possibility that the expected synergies, cost savings and tax efficiencies from the proposed
    transaction will not be realized, or will not be realized within the expected time period; the risk that the Beacon Roofing Supply and Roofing Supply Group
    (RSG) businesses will not be integrated successfully; the ability to obtain governmental approvals of the proposed transaction on the proposed terms and
    schedule contemplated by the parties; disruption from the proposed transaction making it more difficult to maintain business and operational relationships; the
    risk of customer attrition; the possibility that the proposed transaction does not close, including, but not limited to, due to the failure to satisfy the closing
    conditions; and the ability to obtain the debt financing contemplated to fund the cash portion of the transaction consideration and the terms of such financing.
    These factors are not necessarily all of the important factors that could cause actual results to differ materially from those expressed in any of the forward-
    looking statements contained herein. Other unknown or unpredictable factors could also have material adverse effects on Beacon Roofing Supply’s future
    results.

    Finally, in no way does this call constitute an offer to sell or the solicitation of an offer to buy any securities of Beacon Roofing Supply or any other issuer, nor
    shall there be any sale of any securities in any jurisdiction in which such offer, solicitation or sale would be unlawful prior to registration or qualification under
    the securities laws of any such jurisdiction.

1
Today’s Presenters
Paul Isabella
President and Chief Executive Officer
Joe Nowicki
Executive Vice President and Chief Financial Officer
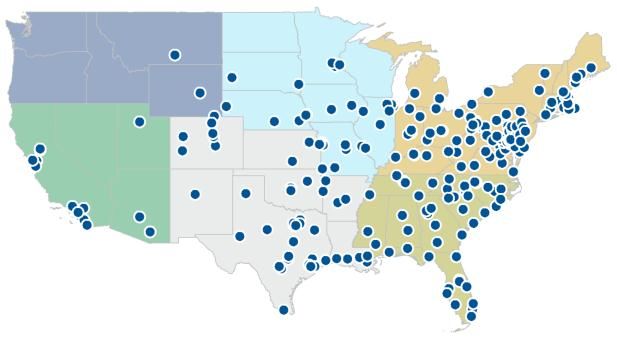
2Beacon Roofing Supply’s Acquisition of Roofing Supply Group
Beacon today announced that it has entered into an agreement to acquire RSG in a cash and stock
transaction valued at approximately $1.1 billion
Combined Company to Generate Approximately $3.7 Billion in Revenue Across 356 Locations
Significantly Expands Beacon’s Geographic Footprint in Southern and Western United States
$50 Million in Expected Annual Run-Rate Synergies
Immediately Adjusted EPS Accretive and Provides Significant Tax Attributes
Positions Combined Company to Better Capitalize on Continued Recovery in Roofing and Housing Markets
3Transaction Overview and Economics
Purchase Price $1.1 billion in cash and stock
$286 million in cash and $291 million in Beacon stock and options (fixed exchange ratio as of
Form of Consideration signing)
– RSG’s net debt of $565 million to be refinanced
Synergies $50 million annual run-rate pre-tax synergies
Immediately accretive to earnings
Significant expected tax attributes, including approximately $130 million in net operating
Financial Impact losses, existing intangible deductions of approximately $190 million and transaction-related
deductions of approximately $50 million
Combined company is expected to generate significant cash flow
$1.1 billion in fully committed financing associated with the acquisition
– Anticipated allocation of debt instruments:
Transaction Financing • $700 million 5-year ABL, $350 million drawn at close for transaction financing purposes
• $450 million 7-year Term Loan B
• $300 million 8-year Senior Unsecured Notes
As a result of the acquisition, CD&R will own approximately ~15% of the pro forma company
Governance
CD&R will also have two seats on the board of the combined company
Timing and Closing Customary regulatory approvals and closing conditions
Conditions Targeted to close on October 1st, 2015
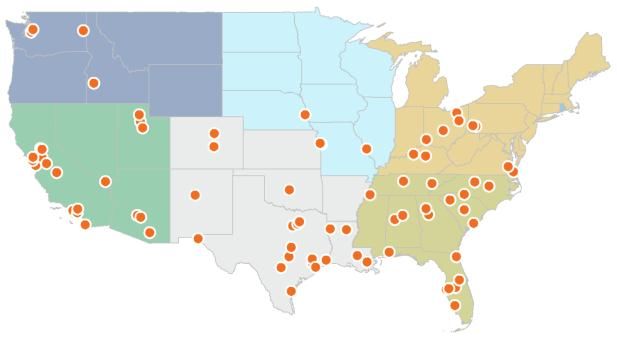
4Overview of Roofing Supply Group
Business Overview Long-Standing Supplier Relationships
Founded in 1981 in Houston, TX (Headquartered in Dallas, TX) Top Suppliers
RSG is a leading wholesale distributor of roofing supplies in the U.S. Supplier Tenure (Years) Supplier Tenure (Years)
Distributes its products to contractors, builders, architects and building
~15 >25
owners through 83 branches in 24 states of the U.S.
Operates through two segments, Residential (62% of 2014 sales) and
Commercial (38% of 2014 sales) ~15 >25
‒ 78% related to re-roofing
More than 20,000 SKUs spread across both residential and commercial >25 >25
products
Owned by Clayton Dubilier & Rice since 2012
~15 >25
2014 Revenue: $1.1 billion
Revenue Breakdown (FY2014) Diversified and Loyal Customer Base
By Geography By End Market RSG sells to a diverse and highly
fragmented customer base 2014 Sales to Top Customers
Eastern U.S. – Customer base of more than
Western U.S. 36%
30%
Commercial 7,000 active roofing contractors, Top 10 Customers: 9%
Reroofing home builders and retailers Top 25 Customers: 15%
33% Residential
Reroofing – No single customer accounted for Top 50 Customers: 20%
45% more than 1.6% of 2014 sales
– Top 100 represented only 29% of
Commercial New sales
Construction
Central U.S. 5% – RSG’s extensive branch footprint 80%
Residential New
34% Construction allows for service to both local 80%
17%
78% Re-roofing and national customers
FY2014 Revenue: $1.1bn
Source: Company website, management presentation.
Note: RSG’s fiscal year ends December 31.
5Roofing Supply Group History of Growth
Acquisition and Growth History
(1981-Present)
Ron Pugh Acquired Achieved $1
Opened First RSG Hits Northwest Acquired Supreme
$500M in Building Products in Billion in in
Branch in Roofing Supply in Annual Sales
Houston, TX Annual Sales Oklahoma City Tuscaloosa, AL
First Branch on The Sterling CD&R Acquires
Ft Worth RSG from The
West Coast Group Acquires
Opens Sterling Group 5 New Branch
Opens (Oakland) RSG
Openings
through June
Austin
Opens
1981 1988 1990 2002 2004 2006 2010 2012 Nov 16,
2014 2015
1984 1992 1993–2001 2005 2007 2011 2013 2014
8 New
Dallas Branch 15 New Branch 5 New Branch Branch
Opens (Vin Perella Openings Openings Openings
Joins RSG)
Acquired CRI in Northern
First Branch Outside
8 New Branch California and 9 New Branch
of Texas Opens
Openings Increased Intermountain Supply in Openings
(New Orleans)
Branch Count to 40 Washington
Source: Company management presentation.
6Benefits for Key Stakeholders
Expanded geographic footprint
Customers Broader range of industry-leading products
Larger fleet for deliveries and service readiness
Aligns directly with our strategic plan focusing on customer service excellence and
profitable growth
Employees Expanded footprint will provide increased development and career growth
opportunities for talent across both organizations
Superior employee benefits including healthcare, 401K and profit sharing
Strengthen relationships with existing suppliers
Partners
Opportunity to participate in a combined company with much greater volumes
7Investment Highlights
Improved Geographic Footprint 1
Greater Diversification and Complementary Expertise 2
Better Scale in a Fragmented Market 3
Significant Cost Synergy Potential 4
Optimal Timing 5
Significant Cash Flow Generation Supports Deleveraging 6
Favorable Acquisition Financing 7
81 Improved Geographic Footprint
Improved distribution platform with increased exposure to the Southern and Western U.S.
Significant Increase in Presence in the States
273(1) 83 with Highest Issuance of Building Permits(2)
Locations Locations Top 5 States
YTD Permits YTD Y-o-Y
Issued(3) growth(4)
Texas 44,911 8.5%
Florida 25,889 11.5
California 17,748 13.8
North Carolina 15,165 3.7
Georgia 12,964 22.0
Top 5 116,677 10.6%
U.S. 273,372 8.5%
Total Pro Forma
Locations: 356(1)
68 locations
Midwest
6 locations
Northwest Texas Florida
+46% +50%
increase in increase in
111 locations locations locations
Northeast (13 new) (6 new)
California
37 locations
Southwest
+75%
increase in
47 locations locations
61 locations Southeast (12 new)
South Central
Sources: Management and U.S. Census Bureau.
(1) Totals include Canadian locations and are pro forma for the acquisition of ProCoat Systems.
(2) Top Metropolitan Statistical Areas (MSAs) based on 2014 Single Family Home Building Permits per U.S. Census data.
(3) Year to date as of May 2015.
9 (4) Represents year-over-year growth from YTD period May 2014 to May 2015.2 Greater Diversification and Complementary Expertise
Sales by End Market
FYE 2014 Beacon RSG Pro Forma
Complementary
Complementary Building Products Highest-margin
Building Products 10% segment
15% Non-Residential
Residential Roofing
Roofing 38%
Residential
48% Roofing
52%
Residential Non-Residential
Non-Residential Roofing Roofing
Roofing 62% 38%
37%
Sales by Geography
FYE 2014
Beacon RSG Pro Forma
Canada
Northwest Northwest Canada
8%
1% 7% Northwest 5%
Northeast
Midwest Midwest 3% Northeast
14%
10% Northeast 8% Midwest 27%
34% 9%
Southwest Southeast
7% 12% Southwest
11%
Southwest
17%
South Central
18% Southeast Southeast
South Central
22% 19%
South Central 26%
42%
Source: Company presentations and filings.
Note: RSG’s figures are calendarized to match Beacon’s fiscal year of 9/30.
103 Better Scale in a Fragmented Market
Roofing Industry Overview Estimated Roofing Industry Market Share(2)
Roofing is a $21 billion industry(1) Pro Forma
16% Rest of Top 4(3)
Company 1: 25%
Beacon is the second largest roofing distributor Company 2: 6%
in North America Company 3: 6%
Others
Other Roofing Suppliers: 48%
Pro forma Beacon sales will be more than $1
billion greater than its next largest competitor
Number of Roofing Distributors Multi-Regional Roofing Players Top 5 Distributors
75 Account for
1,500
Are in more than ~52%
Total
one region of industry sales
Source: The Freedonia Group, Pro Sales Magazine.
(1) Represents sales by manufacturers.
(2) Top 4 share estimate based on sales figures in Pro Sales Magazine, May 2015.
11 (3) Figures may not sum due to rounding.4 Significant Cost Synergy Potential
Estimate of Synergy Opportunity Run-Rate Synergies and Timing of Expected Realization
$50
$47
$50mm
$30
Beacon has successfully acquired and
integrated 28 businesses since its IPO in
2004
Run-rate cost synergies conservatively
represent ~5% of RSG’s 2014 sales
Management, with support of external % Achieved 60% 95% 100%
consultants, has developed a detailed
Year 1 Year 2 Run-Rate
plan for the implementation of its cost
synergy initiatives
Beacon management anticipates rapidly realizing potential
synergies, reaching near full run-rate by Q2 2017
Source: Global management consulting firm.
125 Optimal Timing: End Markets
Both Housing and Non-Residential markets are in the early stages of a significant cyclical recovery.
New Home Starts
(From 2000A – 2016E) Single Family
2,068
1,956 Multi Family
1,848 1,801
1,705 353
1,569 1,603 345 Long-Term Average: 1,473
349 336 1,400
346 1,355
338 329
1,109 363
309 906 925 1,003
781 362
1,611 1,716 284 554 587 609 307 356
1,359 1,499 1,465 245
1,231 1,273
1,046 109 116 178 1,037
622 618 647 747
445 471 431 535
2000 2001 2002 2003 2004 2005 2006 2007 2008 2009 2010 2011 2012 2013 2014 2015E 2016E
U.S. Spending on Non-Residential Construction
($ in billions)
$500
$463
$432 $411 $434
$390 $370 $390
$342 $347 $346 $346 $336 $354 $355
$319 $309 $324
2000 2001 2002 2003 2004 2005 2006 2007 2008 2009 2010 2011 2012 2013 2014 2015E 2016E 2017E
Source: NAHB, FMI Corporation.
135 Optimal Timing: Roofing Market
Households in America are getting older… ….And most owners are forced to invest in repairs…
Median Age of Owner-Occupied Housing 88% of U.S. re-roofing demand is non-discretionary
Other
Deteriorating 2%
40 7%
Upgrade
38 years Appearance
35 11%
Leaks
30 33%
25
Weather
Damage
14%
20
23 years
15 Old
1985 1987 1989 1991 1993 1995 1997 1999 2001 2003 2005 2007 2009 2011 2013 33%
….While roofing volume is still below long-term averages Change From Peak Levels
% decline from total peak (2005) 38.2%
U.S. Asphalt Shingle Market % decline from major storms peak (2008) 72.7
(Sq. Ft. in mm) % decline from reroof peak (2005) 28.4
% decline from new construction peak (2005) 53.8
173
161
154 155
143 143 144 Long-Term Average: 135mm
136 39
37 135
34 35 129
120 122 118
33 31 32 17 111
30 26 108 11 107
11 14
11 17 18
116
116 96 93
113 112 93
107 103 109 110 100 94
91 88 83
18 22 17 19 11
3 3 3 2 7 8 8 3 6 6 6
1999 2000 2001 2002 2003 2004 2005 2006 2007 2008 2009 2010 2011 2012 2013 2014
Major Storms Re-roof Demand New Construction
Source: Asphalt Roofing Manufacturers Association, Summary of Asphalt Roofing Industry Shipments. U.S. Census Bureau. National Association of
Realtors existing home sales and Owens Corning management estimates. ELK. F.W. Dodge.
146 Significant Cash Flow Generation Supports Deleveraging
Strong Deleveraging Profile Illustrative Net Debt / Pro Forma EBITDA
• Pro forma net debt of $1.1 billion at
close
– Strong liquidity position with $350mm of
ABL availability for seasonal working
capital needs and acquisitions
• Rapid expected deleveraging driven by: Below ~2.0x in
three years
– Cost synergies realization
– Earnings expansion
– Strong free cash flow generation
enhanced by recovering housing
sector
– Low ongoing capital expenditure
– Utilization of tax attributes, including
approximately $130 million in net 1.5x
operating losses, existing intangible
deductions of approximately $190
million and transaction-related
Beacon Status Quo Pro Forma at Close Within 3 Years
deductions of approximately $50 03/31/2015
million
157 Favorable Acquisition Financing
The current financing environment along with Beacon’s leverage profile provides an opportunity to secure
favorable financing terms
More than $350 million of liquidity at close, including ABL capacity
Liquidity and excess cash for seasonal working capital requirements and
acquisitions
Anticipated allocation of debt instruments:
– $700 million 5-year ABL, $350 million drawn at close for
transaction financing purposes
Debt
– $450 million 7-year Term Loan B
– $300 million of 8-year Senior Unsecured Notes
Estimated Weighted Average Cost of Debt: ~4%(1)
Equity $291 million in new stock and options
Source: Management.
(1) Does not include $350mm of undrawn ABL at close.
16Acquisition Provides Significant Opportunities
An Exciting Opportunity to Drive Growth and Create Significant Shareholder Value
Enhances Growth Strategy
Expands Geographic Presence and Diversity
Significant Cost Synergies and Tax Attributes
Enhanced Free Cash Flow Generation / Expected Deleveraging
Optimal Timing
Immediately Accretive to Earnings
17You can also read