Air Arabia Air Arabia Q1 2017 Investor Presentation Investors' Presentation - Q1 2017

Page created by Cheryl Cannon
 
CONTINUE READING
Air Arabia Air Arabia Q1 2017 Investor Presentation Investors' Presentation - Q1 2017
Air Arabia
 Air Arabia Q1 2017
Investor Presentation
 Investors’ Presentation
Q1 2017
Air Arabia Air Arabia Q1 2017 Investor Presentation Investors' Presentation - Q1 2017
The Development of Air Arabia
Air Arabia Air Arabia Q1 2017 Investor Presentation Investors' Presentation - Q1 2017
Air Arabia - General Overview
Company Overview

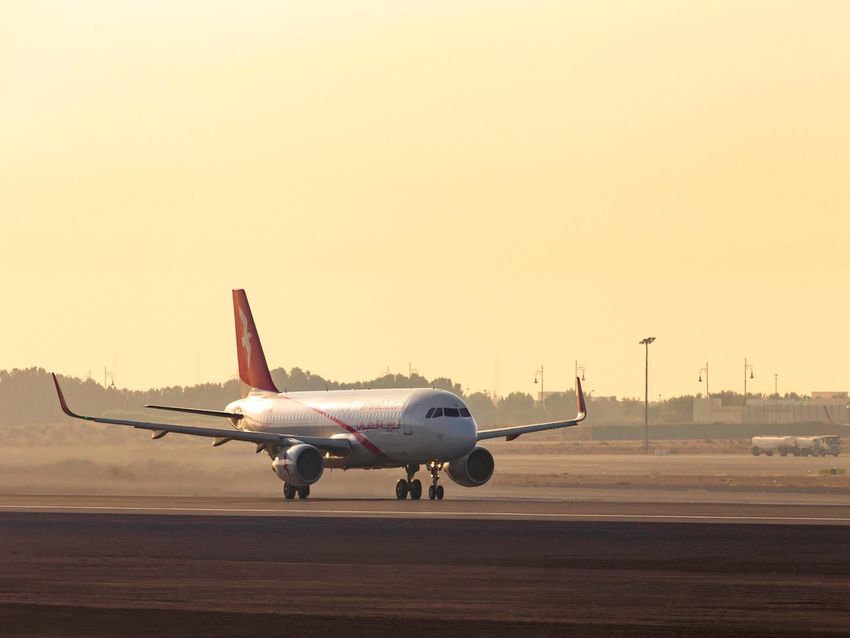
 Launched in October 2003, Air Arabia was the first and is the
   largest low cost carrier in the Middle East and North Africa.
 14 years of consistent growth.
 14 year of consistent profitability.
 Initial Public offering was successfully completed in 2007.
 Operating a total fleet of 47 Airbus 320 aircraft.
                                                                                                           12.5
 Operates out of 5 locations: Sharjah, Ras Al Khaima, Egypt,                                       11.4
                                                                                             10.5
   Morocco, and Jordan.                                                              9.39
                                                                              8.04
 More than 126 routes served from 5 hubs.               6.07   6.37
                                                                       7.11

 Financially stable with a strong balance sheet.

                         Asset Evolution (2009 – 2016)
                                                         2009   2010   2011   2012   2013    2014   2015   2016

                                                                  Asset Values In Billions
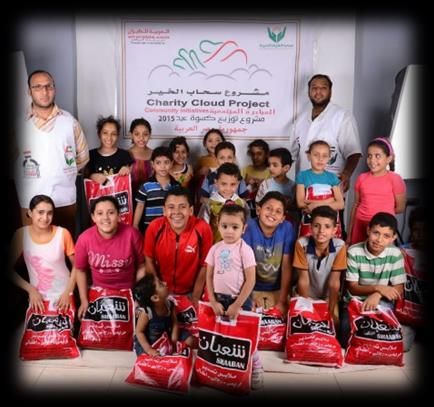
Air Arabia Air Arabia Q1 2017 Investor Presentation Investors' Presentation - Q1 2017
Business model

Leadership
   First mover advantage – The first Low cost on MENA, and first listed airline in the Arab world
    (DFM).
   Truly Independent – In Management and Strategic development.
   Strong support at our home base – Air Arabia is by far the largest operator in Sharjah
    Airport, providing commercially competitive advantages.
   Brand Name - one of the most recognised brand names in the MENA region.
Powerful business model
   High Aircraft utilization – around 15hrs a day, one of the best in the world (A 320).
   80%+ Seat factor year round.
   Low cost principals – Constantly driving our costs lower to industry leading levels.
   Safety – The highest operational standards.
   Young fleet – average age around 3 years.
   Excellent on time performance. Above industry average and improving
   Best seat pitch in class – Comfortable 32 inches.
   Strong group support – JV’s and subsidiaries helping to drive economies of scale and
    profitability.
Air Arabia Air Arabia Q1 2017 Investor Presentation Investors' Presentation - Q1 2017
Consistent Growth

                        Destinations                                                     Fleet Size
                                                                                                                                46
                                                           122
                                                    116                                                                 41
                                                                                                                 39
                                              101                                                          34
                                         90                                                          33
                                   82                                                          29
                              73                                                         25
                         65                                                        21
                   59
             44                                                              16
        37                                                             11
  32                                                              8

                                                                 2006 2007 2008 2009 2010 2011 2012 2013 2014 2015 2016
 2006 2007 2008 2009 2010 2011 2012 2013 2014 2015 2016

                        Load Factor                                          Total Passengers (Million)
       86% 85%
                        83% 82% 82%                                                                                            8.034
                                                          82%                                                           7.64
80%               80%                   80% 80% 79%                                                              6.82
                                                                                                           6.1
                                                                                                     5.3
                                                                                         4.5   4.7
                                                                                   4.1
                                                                             3.6
                                                                       2.7
                                                                 1.8

2006 2007 2008 2009 2010 2011 2012 2013 2014 2015 2016
                                                                 2006 2007 2008 2009 2010 2011 2012 2013 2014 2015 2016
Air Arabia Air Arabia Q1 2017 Investor Presentation Investors' Presentation - Q1 2017
Group companies
Air Arabia (PJSC)- (DFM:AIRARABIA), consists of a group of airlines and companies offering travel and tourism services
across the globe.

        Industry              Companies              Ownership                                         Description
                                                       100%                First & Largest LCC in MENA region covering vast population spreading
                                                                           across Middle East and Indian Subcontinent and CIS region.
                                                                           Morocco's leading LCC extensively covering Europe from various airports
                                                        41%                across the Kingdom with great potential to spread wings into Africa.

                                                                           Egypt’s most innovative LCC, serving GCC the Middle East, Europe and
                                                        49%                Africa.
         Airlines
                                                                           The latest addition to the low cost carriers industry in Jordan, with a HUB in
                                                        49%                Queen Alia International Airport and operations to the GCC, Levant, and
                                                                           MENA generally.

                                                                           SAS is a JV with Sharjah Airport that delivers a
                                                        50%                comprehensive range of passenger, ramp and cargo
  Ground Handling &                                                        handling for airline operators and airport customers.

          MRO                                          100%                Maintenance Hangar designed to meet all MRO
                                                                           requirements for entire Air Arabia fleet while serving
                                                                           other airlines and aircraft.

                                                                            Providing significant cost saving, this flight simulator
                                                                            facility helps Air Arabia provide world-class training for
   Flight Operations                                   100%
                                                                            up to 400 pilots a year.

                                                                           Both hotels perfectly situated in Sharjah and Dubai
                                           100%                 100%       providing Air Arabia with a great expansion into hospitality.
      Hospitality                                                          JV company that supports and enhances the quality of
                                                               100%        on-board catering while servicing a niche market for
                                           51%                             catering and hospitality

                                                                           Spread across GCC states, Cozmo Travel is a leading
        Tourism                                         51%                travel agency providing a wide range of individual and
                                                                           corporate travel solutions.

                                                                           ISA is a leading IT solutions provider. ISA unique creation is
      Technology                                        100%               the leading reservations system ‘AcelAero’ that is now
                                                                           being used by many airlines across the world.
Air Arabia Air Arabia Q1 2017 Investor Presentation Investors' Presentation - Q1 2017
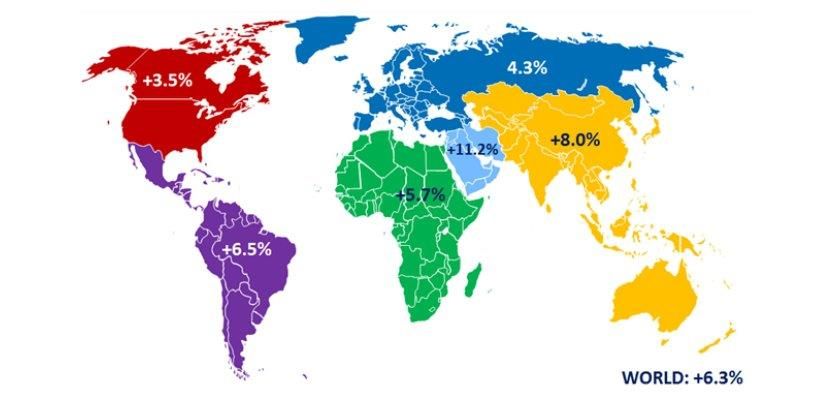
MENA Region Still maintains
highest growth levels…

                              Source: IATA Annual report 2016.
Air Arabia Air Arabia Q1 2017 Investor Presentation Investors' Presentation - Q1 2017
Airline Companies

             Growth in number of
           destinations at each Hub                                     5
                                                                                Air Arabia UAE
                                                                                                      1
                                                                                    Jordan                    Air Arabia UAE
                                             2                                                                    Sharjah
       3                                         Air Arabia Egypt           7
           Air Arabia Maroc              8                                  6                    80
                                         4                                  6                    60
40
                                         2                                  5                    40
30
                                         1                                  5                    20
20
                                             2013 2014 2015 2016                 2015   2016
10                                                                                                0
                                                                                                          2011 2012 2013 2014 2015 2016
 0
      2011 2012 2013 2014 2015 2016                                                                                   4
                                                                                  5                                        Air Arabia UAE
                                                                    2                                                            RAK
                               3

                                                                                                               4          15
                                                                                                          1               10
                                                                                                                           5
                                                                                                                           0
                                                                                                                               2014 2015 2016

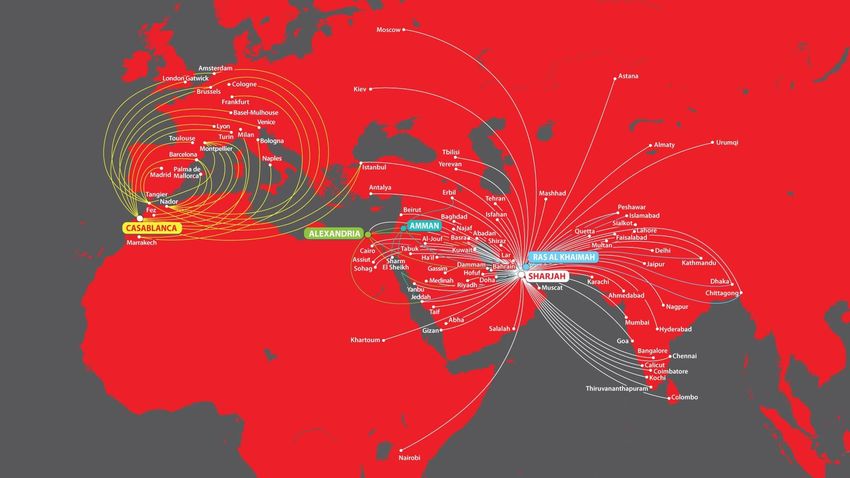
     Strategic bases in key geographical locations serving regions covering a population of over 3 billion:
     Middle East               Africa
     Indian Subcontinent       CIS Region
     South and Central Asia    Europe
Air Arabia Air Arabia Q1 2017 Investor Presentation Investors' Presentation - Q1 2017
Strong JV’s and Subsidiaries
 Air Arabia supporting businesses contribute
                                                        Revenue (AED MM)
 strongly to the Group’s bottom-line           Stake    FY 15      FY 16

                                               50%     157          147

                                               51%     85           88

                                               51%     100          107

                                               100%     20          23

                                               100%     48          40.5

                                               100%     35          33

                                               100%    26.4          20
Financial Performance
FY 2016

       Quarterly Performance           FY’ 2015   FY’ 2016   % Change

 Financial Highlights (AED Millions)

         TOTAL REVENUE                  3,826      3,778      -1.3%

          Operating Profit               564        365        -35%

      Operating Profit Margin           15%        9.6%       -5.4pts

           NET PROFIT                    531        509        -4%

       Operational Highlights

NUMBER OF PAX CARRIED (Millions)        7.58       8.46        11.6

    AVERAGE LOAD FACTOR                78.6%      79.2%       +0.6pts
FY 2016
o   2016 was a very tough year on aviation     Revenues (AED) 2004-2015

    industry generally.                                    4,500
                                                           4,000                                                       3,7293,8253778
o   Pressure on yields continue to exist and               3,500                                         3,183
    comes from various sources.                            3,000
                                                                                               2,434
                                                                                                    2,832

                                                (AED MM)
                                                           2,500                2,0661,9722,080
o   Despite that, 2016 witnessed the                       2,000
    delivery of 6 new A320s to the fleet.                  1,500            1,283
                                                           1,000      749
o   The number of passengers carried for                     500
    the year 2016 increased by 10.7%                           0
                                                                      20062007200820092010201120122013201420152016
    compared to previous year with Air
    Arabia carrying 8.46 million passengers.
o   Global network grew in 2016 to reach
                                                Net Profits (AED) 2005 -2015                                         Margin
    122 routes from 5 hubs.
o   Air Arabia distributed 9% cash dividends                    600                                                  566              35%
                                                                                                                            530 509
    for the year 2015.                                          500
                                                                             29% 510
                                                                                                                                      30%
                                                                                 25% 452
                                                                                     23%                424 435
o   Operational performance and                      (AED MM)
                                                                400          369                                                      25%
                                                                                           310
    operational margins continue to reflect                     300   14%
                                                                                                  274
                                                                                                               14%
                                                                                                                     15% 14%
                                                                                                                               13%
                                                                                                                                      20%

    healthy and efficient management.                           200                     15%             15%
                                                                                                                                      15%

                                                                      101                                                             10%
                                                                100                           11%
                                                                                                                                      5%
                                                                  0                                                                   0%
                                                                      2006      2008       2010         2012         2014      2016
Q1 2017

       Quarterly Performance           Q1’ 2016   Q1’ 2017   % Change

 Financial Highlights (AED Millions)

         TOTAL REVENUE                   945        810        -14%

          Operating Profit               130        71         -45%

      Operating Profit Margin           13.7%      8.7%       -5pts

           NET PROFIT                    114        103       -10%

       Operational Highlights

NUMBER OF PAX CARRIED (Millions)        2.08       2.10        1%

    AVERAGE LOAD FACTOR                 82.6%      81.2%      -1.4pts
Annual Operating Statistics

(Figures in AED)   2006 2007 2008 2009 2010 2011 2012 2013 2014 2015 2016
Number of
                    8    11    16    21    25    29    33    34     39    41    46
Aircrafts
Average Aircraft 6.0     9.5   14.5 17.0 23.0 27.5 30.0      31.0   35.0 40.0 43.0

Destinations        32   37    44    45    65    69    82    90     100 116 122
Number of Pax
                   1.8   2.7   3.6   4.1   4.5   4.7   5.3   6.1    6.8   7.6   8.4
(Millions)
RPK (Billions)     3.7   5.0   7.1   8.5   9.2   9.2   9.6   10.8   13.8 15.2 16.6

ASK (Billions)     4.7   5.8   8.3   10.5 11.0 11.7 13.0     15.2   17.0 18.8 20.5
Average Load
                   80% 86% 85% 80% 83% 82% 82%               80%    81% 79% 81%
Factor
Fuel Hedging positions

             64%            65%
                                           73%
                                                            79%

             36%            35%
                                           27%
       $51          $54            $67                $69   21%

             2017           2018          2019              2020
                     Hedged Fuel    Not Hedged Fuel
Corporate Social Responsibility
Air Arabia has always give CSR very high consideration, and has
been the passion of very member of Air Arabia.
Charity Cloud Program
Air Arabia’s initiative for sustainable development started in 2005
and currently runs schools and medical centres across: Sudan, Sri
Lanka, India, Nepal, Yemen, Turkey, Egypt and Bangladesh –
providing education and health care to thousands.
Activities During the year:

  Staff visit and donation by Air Arabia Maroc   Morocco
  staff to the SOS Children village
  New children’s clinic                          Bangladesh
  New rehabilitation centre for woman            Srilanka
  New dialysis center                            Egypt
  Educational training Center                    Bangladesh
  Children’s Garden renovation project in        Bosnia and Herzegovina
  Sarajevo
  Buying new fishing boats                       Sudan
  Assisting widowed women by distributing        Morocco
  necessities in Nador
  New charity cloud children’s school in Sohag   Egypt
  Staff participation in an awareness marathon   Egypt
  for the57357 children cancer hospital.
  Water system renovation                        Bosnia and Herzegovina
  Medical awareness campaign                     Sudan
  School bags distribution                       Sultanate of Oman
3rd on Top 50 Airlines 2016 according
to Air Finance Journal
Disclaimer

Information contained in this presentation is subject to change without notice, its accuracy is not guaranteed
and it may not contain all material information concerning the company. Neither we nor our advisors make
any representation regarding, and assume no responsibility or liability for, the accuracy or completeness of, or
any errors or omissions in, any information contained herein.

In addition, the information contains projections and forward-looking statements that reflect the company’s
current views with respect to future events and financial performance. These views are based on current
assumptions which are subject to various risks and which may change over time. No assurance can be given
that future events will occur, that projections will be achieved, or that the company’s assumptions are
correct. Actual results may differ materially from those projected.

This presentation is strictly not to be distributed without the explicit consent of Company management under
any circumstance.
Contact Us

For full financials and further information:

investor-relations.airarabia.com

Tel: +971.6.5088977

Email: investorrelations@airarabia.com
You can also read