Apart but Connected: Online Tutoring and Student Outcomes during the COVID-19 Pandemic
←
→
Page content transcription
If your browser does not render page correctly, please read the page content below
EdWorkingPaper No. 21-350

           Apart but Connected: Online Tutoring and
           Student Outcomes during the COVID-19
           Pandemic

           Michela Carlana                         Eliana La Ferrara
           Harvard University                      Bocconi University

           In response to the COVID-19 outbreak, the governments of most countries ordered the closure of
           schools, potentially exacerbating existing learning gaps. This paper evaluates the effectiveness of an
           intervention implemented in Italian middle schools that provides free individual tutoring online to
           disadvantaged students during lock-down. Tutors are university students who volunteer for 3 to 6
           hours per week. They were randomly assigned to middle school students, from a list of potential
           beneficiaries compiled by school principals. Using original survey data collected from students,
           parents, teachers and tutors, we find that the program substantially increased students’ academic
           performance (by 0.26 SD on average) and that it significantly improved their socio-emotional skills,
           aspirations, and psychological well-being. Effects are stronger for children from lower
           socioeconomic status and, in the case of psychological well-being, for immigrant children.

           VERSION: February 2021

           Suggested citation: Carlana, Michela, and Eliana La Ferrara. (2021). Apart but Connected: Online Tutoring and
           Student Outcomes during the COVID-19 Pandemic. (EdWorkingPaper: 21-350). Retrieved from Annenberg
           Institute at Brown University: https://doi.org/10.26300/0azm-cf65
Apart but Connected: Online Tutoring and Student
Outcomes during the COVID-19 Pandemic ∗
Michela Carlana †, Eliana La Ferrara ‡
This version: February 2021
Abstract
In response to the COVID-19 outbreak, the governments of most countries or-
dered the closure of schools, potentially exacerbating existing learning gaps. This
paper evaluates the effectiveness of an intervention implemented in Italian middle
schools that provides free individual tutoring online to disadvantaged students dur-
ing lock-down. Tutors are university students who volunteer for 3 to 6 hours per
week. They were randomly assigned to middle school students, from a list of poten-
tial beneficiaries compiled by school principals. Using original survey data collected
from students, parents, teachers and tutors, we find that the program substan-
tially increased students’ academic performance (by 0.26 SD on average) and that
it significantly improved their socio-emotional skills, aspirations, and psychological
well-being. Effects are stronger for children from lower socioeconomic status and,
in the case of psychological well-being, for immigrant children.
Keywords: tutoring, COVID-19, education, achievement, aspirations, socio-
emotional skills, well-being.
∗ We thank seminar participants at several universities and webinars for helpful comments. Micol
Morellini, Vrinda Kapoor, Angelica Bozzi, Marco Cappelluti, Isabela Duarte, Agnese Gatti, Gaia Gau-
denzi, Federica Mezza, Chiara Soriolo, Amy Tan and Monia Tommasella provided excellent research
assistance. We are grateful to the schools that took part into the intervention for their collaboration, to
the team of pedagogical experts guided by Giulia Pastori and Andrea Mangiatoridi and including Anna
Maria Carletti, Paola Catalani, Silvia Negri, Doris Valente, Stefania Zacco and Monica Zanon. We also
thank our team of tutor supervisors (Angela Caloia, Leila Pirbay, Ilaria Ricchi, and Giulia Zaratti). La
Ferrara acknowledges financial support from the Invernizzi Foundation. Carlana acknowledges RAship
support from the Malcolm Wiener Center for Social Policy at Harvard Kennedy School. AER RCT
Registry ID: AEARCTR-0002148. The project has obtained IRB approval from Bocconi University and
Harvard University.
† Harvard Kennedy School, CEPR, and IZA (e-mail: michela carlana@hks.harvard.edu).
‡ Department of Economics, IGIER and LEAP, Bocconi University, and CEPR (e-mail:
eliana.laferrara@unibocconi.it).1 Introduction
In response to the COVID-19 outbreak, schools have closed in over 190 countries (UN-
ESCO, 2020). School closure has created massive learning losses for children (Grewenig
et al., 2020; Psacharopoulos et al., 2020), estimated in up to 0.3 standard deviations in
achievement test scores (Maldonado and De Witte, 2020) and 0.9 years of schooling for
seven months of shuttered school buildings (Azevedo et al., 2020). The pandemic has also
had adverse psychological and social effects for children and adolescents, leading to higher
depression and lower development of socio-emotional skills (Orgilés et al., 2020; Golber-
stein et al., 2020). The combination of these effects risks having long term consequences
on the human capital of the cohorts affected by school closures.
While many countries have tried to mitigate learning losses by switching to remote
instruction and using asynchronous or synchronous platforms, the implementation of these
tools has varied substantially. Even within the same country, schools in wealthier areas
have showed higher prevalence of synchronous learning and online participation of students
(Malkus, 2020; Chetty et al., 2020). High-income students also have access to better
homeschooling inputs, including technology, help from parents (Agostinelli et al., 2020),
and online learning resources (Engzell et al., 2020; Bacher-Hicks et al., 2020; Doyle, 2020),
which exacerbates educational inequalities.
This paper reports the results of a novel policy experiment launched in Italy, the first
country severely affected by the Covid-19 pandemic after China. In 2020, Italian schools
were closed from the beginning of March until the summer – more than 1/3 of the en-
tire school year. In response to this, our research team designed and implemented an
innovative online tutoring program: TOP (“Tutoring Online Program”). The program
targeted middle school students (grade 6 to 8) from disadvantaged background in terms
of socioeconomic status, linguistic barriers, or learning difficulties, who were identified by
school principals among those lagging behind during distance learning. The program was
offered to middle schools from all over Italy on a voluntary basis, and it was completely
free.
TOP has two defining features. First, tutoring is entirely online. While tutoring has
shown promising results when done in person by teachers and paraprofessionals (Nickow
et al., 2020), such mode of delivery was impossible during lockdown. All interaction in
our program occurs through personal computers, tablets or smartphones. Second, the
tutors in TOP are not trained professionals but volunteer university students, trained
and supported by pedagogical experts. While teachers and professionals are certainly
qualified, the skills required for tutoring differ from those for classroom interaction (Cook
1et al., 2015). The choice of volunteer tutors has advantages in terms of budget (mobi-
lizing resources to hire professionals may not allow for a rapid response and large scale
implementation), and possibly also in terms of the quality of inter-personal interaction,
as TOP leverages the intrinsic motivation of university students to be volunteers.
Four weeks after the announcement of the school shutdown by the Italian government,
we emailed the principals of all Italian middle schools to introduce the program and ask for
a list of potential beneficiary students. At the same time we emailed all students enrolled
in three large universities in Milan, the second largest city in the country, offering them
the possibility to volunteer for a minimum of three hours per week until the end of the
school year. The response was extraordinary. Two weeks later, online tutoring activities
started.
We received a total of 1, 059 ‘valid’ applications from 76 different middle schools from
all over Italy.1 For each student, the school had indicated which subject they needed
help with, among math, Italian and English. 81 percent of the students needed help
in more than one subject. We randomly assigned a tutor to 530 of the 1.059 applicants,
conditioning on ten ‘blocks’ based on the timing of the valid application. Due to budgetary
and administrative constraints, 530 was the maximum number of tutors to whom we could
offer training and pedagogical support. In fact, in order to equip tutors with a basic set of
pedagogical skills and to help with potential problems in the relationship with children,
we worked with a team of education experts to design an online self-training module for
tutors and to hold regular group meeting and on-demand one-to-one sessions with expert
educators (see section 2.2.3).
We collected baseline data from students, parents and tutors before the start of the tu-
toring (first half of April), and follow-up data from students, parents, tutors and teachers
at the end of the school year (June). Thanks to the over-subscription and random alloca-
tion of tutors to students, we can estimate the causal impact of the program on four sets
of outcomes: academic performance, aspirations, socio-emotional skills, and psychological
well-being.
We find sizeable and significant improvements for students who were assigned an online
tutor compared to those who were not. Time devoted to homework and attendance to reg-
ular online classes increased, as reported by students as well as by teachers. Performance
in a standardized test that we administered at endline and that covered math, Italian and
English improved by 0.26 standard deviations (SD). The effects are particularly strong for
math, which is the subject on which the majority of tutoring sessions focused. Teachers’
1 An application was considered ‘valid’ when the parent had given informed consent and the child had
given assent, and when both parent and child had completed their own (online) baseline questionnaire.
2assessments of learning also improved for treated students compared to control ones, by
0.18 SD. These are remarkable effects given that the median length of the online tutoring
was around 5 weeks.
Our second category of outcomes relates to educational aspirations, in particular, type
of high school track the student plans to enroll in, and likelihood and perceived ability to
attend university. We polled students, parents and teachers about these. The resulting
index of educational aspirations shows a 0.15 SD increase for students in the program
compared to the control group.
We also measured students’ perseverance, grit and locus of control and we find that
TOP increased the value of a composite index capturing these dimensions by 0.14 SD.
The effect is driven by increases in treated students’ perception that they can control
what happens in their lives (locus of control).
Our fourth set of outcomes includes measures of psychological well-being. At the end of
the tutoring treated students were happier and less depressed, as reported by themselves
and by their parents. The effect corresponds to a 0.17 SD improvement in a composite
psychological well-being index.
We examine treatment effect heterogeneity along several dimensions. The first is the
intensity of treatment. While the vast majority of students received 3 hours of online
tutoring per week, a random subset of those students who needed help in more than one
subject (143 out of 427 treated students) were assigned a tutor who gave their availability
for 6 hours per week. We find that performance gains double with the hours of tutoring;
the other outcomes do not.
Another dimension of heterogeneity is access to technology. We know from the tutor
endline survey that around 20 percent of the students connected using a smartphone, as
opposed to a PC or tablet. While one may be concerned that this would diminish the
effectiveness of tutoring –and that such decrease would disproportionately affect children
from lower socio-economic status– we find that it did not. On the other hand, technical
problems (e.g., problems with the internet connection during the tutoring), seem to qual-
itatively decrease the impact of the program, although the effect is imprecisely estimated.
These aspects should be taken into account if one wanted to apply our online tutoring
model to lower income or more remote settings.
In terms of demographics and socio-economic background, we do not detect significant
differences in impact between boys and girls, nor immigrants and natives – except for
the effect on psychological well-being which is entirely driven by immigrants. Improve-
ments in learning outcomes are instead higher for students whose parents have less than
college education, have a blue collar job and do not work from home. Interestingly, tu-
3tor characteristics such as gender, GPA, degree program and pro-social attitudes do not
systematically affect the effectiveness of the tutoring.
Finally, we can estimate how the experience of being a TOP tutor during the pandemic
affected the tutors themselves. We can do so because we randomly selected the university
students to whom we offered the job from the pool of those who applied to be volunteers.2
Four months after the end of the program, we find that volunteers who were included in
the TOP program have significantly higher empathy than those who were not. The effect
corresponds to a 0.27 SD increase. We instead do not find significant effects on tutors’
beliefs regarding the relative role of luck versus hard work in determining success in life.
Our paper contributes to several strands of literature. A robust body of empirical work
shows that in-person tutoring is highly effective for improving academic outcomes. Recent
meta analyses find that the impacts are sizeable (a pooled effect size of 0.37 SD in Nickow
et al. (2020)), and robust across a wide array of contextual factors (Fryer Jr, 2017). The
importance of small group or individual tutoring has been underlined for students who
struggle (Ander et al., 2016) and in order to teach at the right level (Banerjee et al., 2015).
Also, the tutor-student relationships is often close to a mentorship connection that may
affect the development of cognitive as well as social skills, such as prosociality (Kosse
et al., 2020). On the other hand, tutoring is much costlier than classroom instruction and
it may not be easy to arrange individual, in person tutoring in the presence of geographical
constraints. Also, tutoring may sometimes be attached with the stigma of being identi-
fied as a student in-need and pulled out from regular classes (Coie and Krehbiel, 1984;
Richmond, 2015). We contribute to this literature by providing evidence on large-scale
online tutoring, based on volunteer tutors supported and trained by pedagogical experts.
Our model allows to substantially reduce the cost of tutoring –one of the biggest barriers
to large-scale implementation– but also to efficiently reach students located in disadvan-
taged areas through virtual learning. Finally, online tutoring is less observable from peers
than in-person tutoring, which may reduce the sense of stigma possibly attached with this
intervention.
Our results are of course directly relevant to the debate on effective strategies to mitigate
the effect of Covid-19 on education. The existing evidence suggests that students who lag
behind the most during the pandemic are from low-income families with limited access to
technology, and that they receive less support from parents and lower quality of remote
learning from schools (Bacher-Hicks et al., 2020; Chetty et al., 2020). Different forms
2 Asmentioned above, we could not accept all tutor applicants because we were constrained in the
number of hours of support for tutors that we could pay for. The randomization was conditional on the
characteristics that we use to allocate tutors to students, notably subject of tutoring, number of hours
per week, and previous tutoring experience and training.
4of remote learning instruction have been adopted around the world and, although the
evidence on interventions increasing access to computers and internet is mixed (Escueta
et al., 2017; Malamud and Pop-Eleches, 2011), the impact of digital technology may differ
during school closure compared to normal school years.
To the best of our knowledge, very few policy experiments have attempted to use remote
tools to improve learning outcomes during the pandemic. Angrist et al. (2020) evaluate
two low-tech interventions in Botswana that use SMS text messages and direct phone
calls to support parents in the education of their children. The combined intervention
resulted in a 0.12 SD improvement in student outcomes and led parents to update their
beliefs about their children’s learning level. Hardt et al. (2020) evaluate a remote peer
mentoring intervention at a German university during the pandemic, where peers met
online to discuss self-organization. They find positive effects on motivation and exam
registration, though not on earned credits. Our work contributes to this literature by
evaluating the effects of an innovative and low cost online tutoring program targeting
teenage students who had been adversely affected by school closures, and by showing
impacts on learning outcomes as well as soft skills and psychological well-being.
Finally, recent work on organizations highlights the power of intrinsic motivation and
social recognition for improving public service delivery (e.g., Ashraf et al., 2014; Gauri
et al., 2019). In particular, Levitt et al. (2016) underline that such behavioral aspects
can be leveraged to improve educational performance. While we cannot directly speak to
this question, as we did not vary the recruitment method or the incentives provided to
tutors, the fact that our tutors self-selected into volunteering for the TOP program and
their intrinsic motivation may have contributed to the effectiveness of our intervention.
Furthermore, we do provide evidence that volunteering as a tutor increased empathy
compared to those university students that applied but where not assigned to a student.
2 Intervention and Study Design
2.1 Institutional Background
Italy has been the first country after China hardly hit by the COVID-19 pandemic, with
around 80,000 deaths as of January 2021, one third of which were concentrated in the
region of Lombardy. All school buildings closed on March 5th, 2020. Since then, school
reopening has been repeatedly postponed until September 2020 and, even during the
Fall 2020, many schools had to offer remote learning instruction, depending on regional
outbreaks.
5The key components for effective remote school learning are the availability of infras-
tructure and of trained teachers with technological skills. Regarding infrastructure, on
March 26th the Italian Ministry of Education allocated 70 million euro to buy tablets
that students could temporarily borrow and 10 million to improve internet connection
and online platforms of schools.3 This intervention facilitated the access to devices and
internet for disadvantaged students. However, not all students in need were offered a
device due to bureaucratic delays.
As of March 2020, teachers’ digital competences were still somewhat limited, with
less than 50 percent of the teachers using any digital tool in their daily lectures (Agcom,
2019).4 When schools closed due to COVID-19, the response from teachers was extremely
heterogeneous: many students only received instructional packets with homework for
the first few weeks. Training courses to improve teachers’ technological knowledge were
organized starting in Spring 2020 by the regional offices of the Ministry of Education, by
private foundations and web platforms such as Google Classroom and WeSchool. Based
on data we collected on 427 teachers in our 76 sample schools, by the month of June more
than 96 percent of the teachers were providing synchronous online classes. Most of the
teacher-student interaction was synchronous with the entire class of around 22 students.
Around 85 percent of teachers provided some asynchronous videos, usually no more than
one hour per week. Almost all teachers assigned some homework every week.
2.2 The Tutoring Online Program (TOP)
2.2.1 Timeline
Two weeks after the school closure in Italy, we started the process to design and imple-
ment an new program, the “Tutoring Online Program” (henceforth, TOP), as an attempt
to provide immediate response to the emergency situation. We identified a team of peda-
gogical experts who could help us develop the curriculum for tutor training and support
and we contacted the rectors of three large universities in Milan, asking for permission
to advertise our program mong their students. We obtained IRB clearance and between
March 30 and April 3 we sent out email invitations to university students and to the
principals of all Italian middle schools. On April 14 tutoring activities started and they
3 The same decree also allocated 5 million euro for the digital training of teachers (Ministerial Decree
n. 187, 26 March 2020).
4 The digital transition in Italian schools was promoted by the Italian law 107/2015 (the so-called “La
Buona Scuola”). The first step toward digitalization was a tool called ‘electronic class register’, created
to ease communication between teachers and parents. The register includes grades, absences, and other
messages. By the end of the school year 2015-16, more than 90 percent of middle schools were using
electronic class register (Agcom, 2019).
6lasted until the beginning of June. Appendix Figure A.1 shows the timeline of the project,
including the two rounds of data collection. The implementation was entirely supported
by the research team with the help of student volunteers and research assistants. In what
follows we describe the recruitment process and the key features of the program.
2.2.2 Recruiting schools and students
We sent a recruitment email to all Italian middle schools (grades 6 to 8), using publicly
available email addresses. We informed school principals about the support we could
provide with TOP, presenting it as “a free online individual tutoring service to students
currently struggling” during the school closure. We explained that tutoring would be done
by volunteer university students and that it would be for 3 to 6 hours per week. In order to
participate in the program, each school principal had to complete a brief baseline survey
expressing their interest in the project. In few days, more than 100 schools completed
this first step.5
Second, school principals –possibly with the help of teachers– had to complete an ap-
plication form with a list of students including up to three pupils for each class. We
asked to select the students who “may need TOP the most in terms of their learning level
and family environment”. For each child, the form should indicate the preferred subjects
of the tutoring (one or more among math, Italian, and English), and contact details of
the relevant teachers. The school was in charge of contacting parents and ask for their
authorization to share with us the name and surname of the child and the contact in-
formation (email and phone) of one of the parents. We asked schools to make sure the
selected students had internet connection and a computer or tablet.6 We clarified that
we could not guarantee the tutoring to all applicants and that, if the number of requests
exceeded the number of tutors that we could mobilze and support, we would randomly
assign tutors to students, in order to give every applicant the same chances.
We received in total 1, 594 names of students from 78 schools: 57 percent of these
students were identified as needing help in all three subjects, 25 percent in two subjects,
and 18 percent in one.7 The research team contacted all parents to collect informed
5 We also received some support from a few regional offices of the Italian Ministry of Education,
which helped spreading the information on the project. However, the enrollment of schools was almost
completed when we received this additional support.
6 As clarified in Section 2.1, the Ministry provided to each Italian school resources to buy devices for
students in need. Despite that, 36 parents among those selected from the school reveled that they had
no internet connection or device and they were excluded from our experiment. On top of that, around
20 percent of students used only the phone for the tutoring, as we discuss below.
7 According to the teachers, almost 90 percent of students needed support in math, 78 percent in
Italian and 72 percent in English.
7consent for the project and baseline surveys from parents and students. We sent the
survey using email and text messages.8
Our final study sample comprises the 1, 059 students from 76 schools: these are the
students who completed the baseline survey and whose parents approved the informed
consent and completed the baseline survey themselves by the end of enrollment period
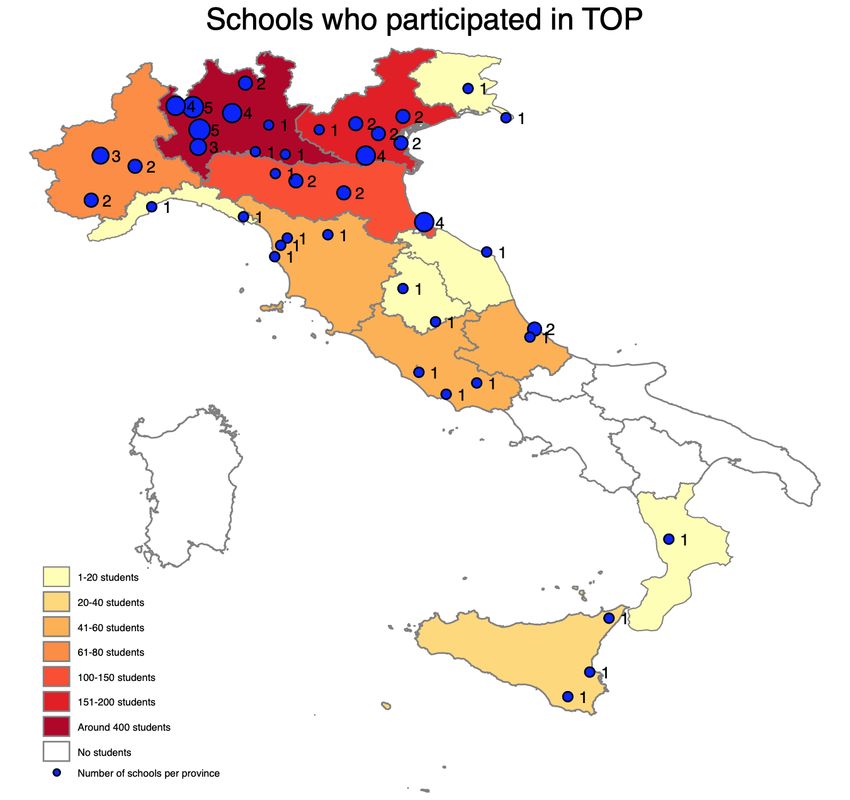
(i.e., April 25th). The geographical distribution with the number of students and schools
for each region is reported in Appendix Figure A.2. To assess the representativeness of
our self-selected sample of schools, in Appendix Table A.I we compare the provinces with
and without schools that took part in the TOP program. We currently focus on the
province level for data availability issues. While the breakdown by education level of the
population is quite comparable (the differences are significant but extremely small), the
provinces with schools in TOP tend to have slightly higher immigrant share, and lower
unemployment rate. These differences are fully explained by the regional divide, with
65 percent of provinces in the North having at least one school included in the program,
compared to 15 percent in the South and Islands, as shown in Appendix Figure A.2 (the
Center is equally represented). The regional imbalance is not surprising, given that the
North was by far the part of the country most hardly hit by COVID-19. It makes sense
that schools in areas strongly hit by the pandemic early on were more likely to apply,
most likely as they foresaw that schools would have not reopened until the end of the
year.
2.2.3 Recruiting and training tutors
Thanks to the collaboration with the rectors of three large Italian universities in Milan,
we sent a message to all students enrolled in undergraduate and graduate programs.9 The
message explained that a team of researchers was launching an online tutoring program
and that we were recruiting “volunteers interested in helping middle school students who
were struggling to keep up with their classes and with their homework”. We required
that volunteers should be currently enrolled in university and fluent in Italian. Applicant
tutors had to complete a baseline survey, indicating among other things the subjects in
which they would feel comfortable tutoring, and their availability for either 3 or 6 hours
per week. The number of applications from volunteers reached 2, 000 by the end of the
enrollment period, far exceeding our expectations.
8 Ifthe parents did not respond within a few days, the research team followed-up with a phone call
to check that they received the information and they eventually shared the consent form and baseline
surveys to a new contact provided by the family.
9 The three universities were Bicocca, Bocconi and Statale, which approximately enroll 33, 000, 14, 000
and 61, 000 students respectively.
8As our volunteers were not trained professionals, we hired a team of pedagogical experts
to train and support the tutors.10 Within a few weeks, they set up an online learning
platform with a self-training program that included slides and videos. The topics included:
how to approach students; tools and online platforms for effective online tutoring; learning
disorders; and tips to help students in math, Italian and English. The platform also
included a supervised forum where tutors could ask questions and share their experiences.
Finally, the pedagogical team organized regular group meetings with around 20 tutors, as
well as one-on-one meetings on demand to offer support in specific circumstances. Based
on the information reported by our tutors at endline, around 80 percent of them used
the training platform, 50 percent watched the videos and followed the online training, 8
percent used the forum, and 36 percent and 12 percent joined at least one small group or
individual meeting, respectively.
The tutor training was an important component of TOP and it ensured that our volun-
teers, even without professional training, could offer a high quality service to their tutees
and could receive professional advice and support in case of need. However, this was
the most expensive part of TOP (see section 7 for cost estimates) and, given our budget
constraints, it limited to 530 the number of tutors that could be trained and supported.
2.3 Experimental Design
2.3.1 Randomization
We randomized the allocation of the 1, 059 students in our sample into two groups: a treat-
ment group that received tutoring (530 students) and a control group that did not (529
students). In order to guarantee that students could start as soon as possible, we processed
applications on a rolling basis by creating ‘blocks’ of around 100 student applicants. We
stratified the randomization at the block level, where blocks were created depending on
the timing of baseline completion.11 Appendix Table A.II shows that the treatment and
control groups do not differ according to baseline characteristics collected from students
and parents, including gender, immigration status, learning disorders, grade, interest in
the subjects taught, and parental education and occupation.
Of the 1, 059 students included in the experimental design, 712 completed the endline
10 The team was led by prof. Giulia Pastori and prof. Andrea Mangiatordi , both at Bicocca University,
and included six other members with teaching and pedagogical expertise.
11 After reaching around 100 completed applications including parental consent, baseline survey of
parents and students, we created a ‘block’ and randomly assigned 50 percent of students to the treatment
and 50 percent to the control group. Within each block, we ordered the observations by school ID and
grade.
9test. Attrition rates were different for the treatment and control group, which is not
surprising given that students who received a tutor remained engaged with the program
until the month of June, while control students had to be contacted after not receiving a
tutor. As shown in the Appendix Table A.III, on average 67 percent of students completed
the endline test score: 46 percent of the control group and 88 percent of the treatment
group. We find that children with college educated fathers or with higher familiarity
with computers are more likely to complete the endline test, with the effect being driven
mainly by students in the control group (column 4, Appendix Table A.III). Compared
to students in grade 8, students in grade 6 were more likely to complete the endline in
the control group, which may depend on the fact that, during the period of the endline,
grade 8 was involved in the final middle school exam, and control students may have been
relatively less motivated to devote time to the survey.
[Insert Table I]
Table I reports the balance Table restricting the sample only to students who completed
the final survey. Overall, most characteristics are balanced between treatment and control
group. If anything, compared to the full sample shown in Appendix Table A.II, the con-
trol group is marginally positively selected in terms of parental education (as highlighted
above). Given the direction of imbalance in response rates, one may expect an underes-
timate of the treatment effect. Nonetheless, we will present different robustness checks,
including inverse probability-weighted estimates of treatment effects and the inclusion of
different sets of controls (Appendix Table A.XII).
Among the 530 treated students, teachers identified 427 as needing help in more than
one subject. We randomly assigned one third of these 427 students to an ‘intense’ version
of the program with 6 hours of tutoring per week instead of 3. This will allow us to
estimate the impact of treatment intensity in section 5.1. We present the balance Table
for random assignment to the intense tutoring in Appendix Table A.IV.12
2.3.2 Tutor allocation
We assigned tutors to students following a step-by-step procedure. First, we restricted the
sample of tutors to those currently enrolled in university and fluent in Italian. Given the
high number of volunteers, we decided to further restrict the sample to tutors with previ-
12 The table shows some imbalances in the education level of the mother, with a higher share of mothers
with at least high-school diploma among students in the 6h treatment vs. 3h treatment group. We control
for these baseline characteristics in all regressions.
10ous tutoring experience and/or specific training (e.g., to support students with learning
disorders or immigrants).
Second, we divided tutors into different groups depending on their expertise in the
various subjects (math, Italian, English or combinations of these), their time availability
(3 vs. 6 hours per week), and their training (general, specific for immigrants, specific for
students with learning disorders). Within each group, we randomly ordered the tutors.
Third, we randomly assigned treated students to tutors taken from the relevant group,
considering the subjects they needed help with, whether they needed intense tutoring, and
their characteristics (learning disorders and immigration status). Note that only 4 percent
of tutors had specific training on learning disorders, while 32 percent of the students in
our sample have learning disorders. Hence, the great majority of students with learning
disorders were supported by a tutor who had no training other than the support provided
by our pedagogical team. Similarly, only 1 percent of tutors had studied specifically to
work with immigrant children, who constitute 22 percent of our sample.
As expected, given the allocation procedure, tutors assigned to students differ from
the overall sample of tutors that applied. Appendix Table A.V reports the differences
in characteristics of assigned tutors with those who applied and where not assigned to a
student.
Column 1 of Appendix Table A.VI provides summary statistics for the tutors who
were assigned to students, from the tutor baseline survey. Notice that 530 students were
assigned to the treatment, but 7 dropped out before starting the tutoring, therefore we
only assigned 523 tutors. The great majority of tutors are female (70 percent), born in
Italy (98 percent), they were moved by a desire to help others when applying to TOP (83
percent) and they have previous experience as volunteers (83 percent). In terms of degree
program, about 34 percent of the tutors attend a STEM major or medical school, 28
percent an economics/business major, 14 percent a humanities major, and only 7 percent
a major in education.13
Columns 2 and 3 of Appendix Table A.VI show summary statistics separately for tutors
that offered their availability for 3 vs. 6 hours per week, and the last two columns
report the p-value on the null that the difference is zero and the standardized difference.
Tutors who made themselves available for 6 hours are less likely to come from economics
or business and more likely to come from humanities; they are also more likely to be
born outside Italy and to have training to work with immigrants. Although students are
randomly assigned to a high vs low-intensity treatment, we should keep in mind that
13 The relatively high share of students from economics and business is due to the fact that one of the
three universities from which we recruited, Bocconi, specializes in those subjects.
11they get a ‘package’ of different tutor characteristics when assigned to 6 vs. 3 hours of
tutoring.
2.3.3 Implementation
We matched all tutors with students by April 25, as shown in the timeline (Appendix
Figure A.1). The tutoring lasted from mid-April to the beginning of June 2020.14 In June
2020, we collected the endline surveys.
After each meeting, tutors were required to record some information about the session
using a management tool prepared by the research team. The information included the
day and time of the meeting, whether the student had done the homework assigned,
and whether he/she had exerted effort during the tutoring session. On average, treated
students had 14 tutoring meetings over the course of the program, for a total of 17
hours over 34 days. The distribution of the number of meetings and tutoring days is
presented in Appendix Figure A.3. Less than 5 percent of students chose not to start the
tutoring (hence have zero meetings). During the tutoring, the subject covered by the great
majority of students was math, which was covered by 78 percent of the students. The
entire distribution on subjects covered in the meetings, as reported in tutors’ registries,
is displayed in Appendix Table A.4.
3 Data and Empirical Strategy
We build a unique dataset merging the baseline surveys of parents, students, and tutors
with endline data coming from (i) the results of a standardized test administered by us
and taken by the students, and (ii) surveys of parents, students, tutors and teachers of the
classes in which our treated and control students were enrolled. We report the summary
statistics of our main outcomes measured at endline in Appendix Table A.VII.15 The
relevant survey questions are reported in Online Appendix B.
3.1 Student achievement
One of our main outcomes of interest is student learning. In normal years, standardized
test scores are collected in May/June from all Italian students in grade 8 by the Insti-
tute for the Evaluation of the Italian Schooling System (INVALSI). However, due to the
14 Some tutors voluntarily decided to support the students during the summer and in the following
academic year.
15 The variables labeled as ‘outcomes reported by parent’ or ‘outcomes reported by teachers’ do not
refer to parents or teachers themselves, but to the answers that parents/teachers gave about a given child.
12pandemic, these tests were not administered in 2020. In collaboration with two expert
middle school teachers, we designed a (shorter) standardized test very close in format to
the national standardized one. Our test included seven multiple choice questions in math,
seven in Italian, and five in English.
The test was administered to treatment and control students by enumerators. The
research team sent to each student the link to complete the test score, but they needed a
password to access it. The enumerator called each parent to set a time for the test. During
the test, the student was on a video call with the enumerator, he/she opened the link with
the questionnaire in his/her own device and entered the password given in real time by
the enumerator: at that point the test could start. Enumerators were clearly instructed
not to help children during the test. Once the student completed and submitted the
test online, the enumerators were available to discuss any doubts and answer potential
questions.
By design, during the course of our program TOP tutors did not follow a specific
curriculum but they helped students with the homework assigned by school teachers.
For this reason, the test we administered covered the basic achievement expected from
students of each grade. On average, treated and control students answered correctly 56
percent of the questions (as shown in Appendix Table A.VII, line 1): 67 percent in math,
48 percent in Italian, and 50 percent in English. The assessment covered a wide range of
competencies and very few students reached a ceiling in terms of correct answers.
3.2 Student, parent, and teacher surveys
We asked students, parents, and teachers to complete a questionnaire that we sent by email
and/or SMS. The questions covered four main sets of outcomes: academic achievement
and beliefs, educational aspirations, socio-emotional skills, and psychological well-being.
Teachers were asked to complete the same question for each child in their class that was
either treated or control in TOP. The main outcomes in our empirical analysis will be
indexes built extracting the first principal component from the variables in each category,
standardized to have mean zero and standard deviation one in the control group.
Academic outcomes and beliefs. We asked children and parents their beliefs on the
number of correct questions for each subject of the test described in Section 3.1.16 only 56
16 Children were asked about this at the end of the test. Parents were asked this question in their
endline survey, which typically took place after the kid had taken the test (neither the test not the child’s
answers were shared with the parent). Indeed, we expect an impact of TOP on academic outcomes, but
also on the beliefs and expectations of parents and teachers (Rosenthal, 1973). Overall, the data show
that students and their parents are overconfident on their performance, with an average expected share
of correct answers equal to 67 percent (for students) and 71 percent (for parents), against an actual share
13percent in the test. Notably, 64 percent of the students and 71 percent of the parents are
‘overconfident’, in the sense that they expect a higher number of correct answers than one
actually obtained in the test. Teachers’ beliefs tend to be closer to the actual performance:
teachers expect their students to correctly answer 49 percent of the questions on average,
and only 36 percent of them are overconfident about children’s performance.17
To obtain a measure of achievement different from the standardized test score, we asked
each teacher to assign a grade from 1 to 10 to every child in our study (treated or control)
that was in one of their classes. The average grade was 5.65, that is just below the
pass grade of 6 in the Italian school context. This is consistent with the target of our
intervention being children who were struggling to keep up with school work. We also
asked children how they would rate their own school performance on a 1 to 10 scale, and
the average was 6.29, somewhat more optimistic than the teachers but definitely not high.
Aspirations. Low goals and ambitions may lead students into an “aspiration trap”
(Genicot and Ray, 2017; La Ferrara, 2019). Children from disadvantaged background
may underinvest in their education, dropping out from school or choosing easier and less
profitable high school tracks (Carlana et al., 2021). We hypothesized that TOP may
have a direct effect on students’ aspirations, by providing an alternative role model (the
tutor) that may induce them to revise their goals. In our survey, we collected information
from students on their long term educational goals (e.g., attend university), and on their
short term plans (e.g., the type of high school they wanted to enroll in).18 Among the
students in our sample, only 15 percent are interested in a top-tier academic high school,
while around 1/3 are planning to attend a vocational high school.19 As for long-term
goals, 39 percent of the students at endline tell us that they are considering university
education, and the Figure is similar for parents (35 percent). The share is instead much
lower when we ask teachers until what level the student should continue to study: only
14 percent say ‘university’. Finally, we also collected a measure of self-efficacy (Bandura
et al., 1999), asking students (and parents) whether, aside from what they would like to do
in the future, they think they (their children) would be capable of successfully attending
of correct answers of
17 We tried to interview the math, Italian and English teachers for each child. For cases where one of
the teachers did not reply, we calculate the beliefs (and grade, to be described below) as the average for
the subjects for which data is available.
18 In Italy, after grade 8 students need to choose their high school track. The schooling system is
organized in top-tier academic tracks (scientific and classical lyceum), other academic tracks (linguistic,
pedagogical, and other types of lyceum), technical tracks (with technological or economic focus, e.g.,
accounting), and vocational tracks.
19 On average, in Italy 32 percent of students are enrolled in a top tier track and 14 percent in a
vocational track. As expected from the targeting, at baseline, the sample of students who applied to
TOP tends to include more low-achieving and low-aspiring students.
14university if they wanted to.
Socio-emotional skills. Social distancing and school closure can result in a lack of
opportunities to develop not only cognitive, but also socio-emotional skills in the classroom
(Alan et al., 2019). In our endline survey we collected several outcomes to capture socio-
emotional skills. First, in order to measure perseverance, we asked students to answer a
logic question. At the end of the question, we asked them whether they wanted to answer
a new question with the same level of difficulty, with a higher level of difficulty or whether
they wanted to give up. We use their choice as an outcome measure of perseverance in
a real effort task. Second, we measure ‘grit’ following the Short Grit Scale developed by
Duckworth and Quinn (2009). Starting from 8 questions on a 5-point scale, we add up all
the points and divide by 40. The maximum score on this scale is 1 (extremely gritty), and
the lowest is 0 (not at all gritty). We asked the same questions to children and parents,
finding a high correlation among their answers (0.64). Third, we collected a measure of
‘locus of control’ to capture the extent to which students believe they can control the
outcome of events in their lives or whether fate and luck determine the course of action
(Rotter, 1966). To calculate the final score, we start from 4 questions on a 5-point scale,
add up all the points and divide by 20. Also for this outcome, the maximum score is 1
(high locus of control), and the lowest is 0 (low locus of control).
Well-being. Last but not least, we want to understand if the interaction with the
tutor may have helped students to feel less isolated, possibly overcoming depression, and
happier. For this purpose, we collected two measures of psychological well-being from
students and their parents. The first is the Children’s Depression Screener (ChilD-S)
developed by Frühe et al. (2012), which is calculated aggregating a battery of 9 questions.20
The answers are given on a 4-point likert scale; we add up all the points and divide by
36. Also on this outcome, the maximum score is 1 (high level of depression), and the
minimum is 0 (no depression). The second measure is a proxy for happiness: we asked
whether students were feeling happy or unhappy during the lockdown, on a scale from 1 to
10 (10 being the maximum happiness). The correlation between the depression measure
reported by parents and the one reported by students is 0.56, while for happiness it is
0.53.
3.3 Tutor Survey
On top of the baseline information, we asked all the volunteers that had applied to be
tutors to complete a very short endline survey in September 2020, six months after the
20 For a detailed list, see Online Appendix B.
15start of the program. Almost all the tutors who were recruited into TOP completed the
endline survey, while only around one third of those who were not assigned a student did
so. Appendix Table A.VIII shows the difference in observable characteristics among the
tutors who participated in TOP (‘treated’ tutors) and the others (‘control’ tutors). Once
we account for the criteria used to assign students to tutors (e.g., tutors from STEM
are over-represented in treatment because math was the subject most in demand by the
students), very few significant differences appear. This will allow us to investigate how
participation in TOP affected some outcomes measured at the tutor level.
The first outcome is empathy. We collected two standard questions on a 4-point likert
scale, asking respondents if they (i) “find it easy to put themselves in somebody else’s
shoes”; and (ii) “are able to make decisions without being influenced by people’s feelings”.
We sum all points and divide by 8 to obtain a variable ranging from 0 to 1.
The second set of outcomes concerns views on the role of hard work and effort to achieve
success in life. The index we build aggregates answers to three separate questions on (i)
income differences and effort; (ii) the importance of hard work versus luck and connections;
and (iii) the prospects of getting a well-paid job after studying hard, independent of family
background. We aggregate the variables in a similar way as described above.
Finally, in addition to the short endline, tutors recruited into TOP also completed
some further information on their experience during tutoring, e.g., how satisfied they
were, etc.21
3.4 Empirical strategy
To assess the impact of TOP on the various outcomes we collected, we estimate the
following OLS regression:
Yir = αr + βT reatedi + γXi + εir (1)
where Yir is the relevant outcome for student i who was assigned to treatment or control
in randomization round r; αr denotes randomization round fixed effects; T reatedi is an
indicator for whether the student was assigned a tutor in the TOP program; Xi is a vector
of student level controls measured at baseline, including: gender, immigrant status, grade
in which the student is enrolled, mother and father’s education, mother and father’s
employment type, learning disability, interest for the different subjects, perseverance,
belief on the importance of luck, and familiarity with computers; εir is an error term. We
21 TOP tutors received a longer questionnaire in June that included the questions on their experience
during TOP, and then again in September the same short questionnaire that control students received.
16estimate robust standard errors. We also correct for multiple hypothesis testing using the
Westfall-Young stepdown adjusted p-values, which also control the family-wise error rate
(FWER) and allow for dependence amongst p-values.
4 Results
4.1 Online classes and homework
We start by assessing how participation in the program affected key ‘inputs’ in the learning
process on the part of the students. In particular, we consider the time devoted to
homework and the quality of their participation in regular (online) classes offered by their
schools.
[Insert Figure 1]
Figure 1 shows the distribution of time devoted to homework (in minutes) during the
last month of school, as reported by students (panel a) and parents (panel b), as well as
the teachers’ assessment of how regularly the student handed in their homework (panel c).
For each graph, blue bars refer to students in the control group and red ones to students
in the TOP program.
Panel (a) shows that the majority of the students report doing between 30 minutes and
two hours of homework each day, with a small fraction reporting less than 30 minutes and
about 20 percent reporting more than 2 hours. Importantly, the distribution for treated
students is clearly skewed to the right compared to that for control ones, with a marked
reduction in those that report less than 1 hour and a clear increase in those that report
more than 1.5 hours.
When we consider parents’ reports (panel b), we see some discrepancy in the levels
reported: parents are more likely to report very low values (30 minutes or less) and less
likely to report more than 150 minutes. However, it is true also in this case that parents
of students enrolled in TOP report comparatively more time devoted to homework by
their children.
The bottom panel in Figure 1 shows how school teachers perceive students’ commitment
to homework. For control students, 12 percent of the teachers report that they never hand
in any homework, 28 percent say sometimes, 31 percent most of the time and 29 percent
always. The corresponding figures for students in TOP are 4 percent, 23 percent, 35
percent and 38 percent. This confirms that our program did induce students to exert
more effort in homework than they would otherwise have exerted.
17[Insert Table II]
In Table II we consider a broader set of outcomes which includes not only homework,
but also attendance to online classes, behavior during classes and students’ liking of
the subjects. Each outcome is regressed on the treatment dummy and on the controls
detailed in equation (1). We have different sources reporting on the various outcomes,
namely students (columns 1-4), parents (columns 5-6) and teachers (columns 7-9).
Consistent with the data in Figure 1, we find that treatment increased the time devoted
to homework: the average effect is about 10 minutes per day (column 1) or 9 minutes per
day (column 5), depending on whether it is reported by students or by parents.22 This
represents approximately an 11 percent increase over the mean for the control group. Also
the regularity of homework completion as reported by teachers is significantly higher for
treated students. This is shown in column 7, where we estimate an ordered logit model
using as an outcome the categorical variable described in Figure 1(c).
During lockdown, classes were offered online and students were supposed to connect
every day and attend them. Compliance with this requirement was not always full,
though: sometimes less motivated students pretended to have internet problems and
did not connect, or connected for part of the class and then left. In columns 2 and
6, we find that the probability of regularly attending online classes, as reported by the
children and the parents, respectively, is uncorrelated with treatment.23 This is not true,
however, when we consider teachers’ reports (column 8). In this case, students in the
TOP program are 9.4 percentage points more likely to attend classes regularly – a 16
percent increase over the control group mean. The discrepancy is not surprising if one
observes the difference in average values of the dependent variable reported by the three
categories of respondents: children and parents report regular attendance in 83 and 88
percent of the cases, respectively, while –for the same student– teachers only report it in
57 percent of the cases. It is possible that reporting bias by children and parents may
introduce too much noise for us to detect a treatment effect, while the positive impact of
TOP is clear if one takes teachers’ reports as more reliable –which makes sense given that
teachers have no incentive to over-report good behavior.
Column 3 of Table II shows that treated students are 8 percentage points less likely
to report that they found it difficult to follow classes online and use their school’s online
22 The continuous dependent variable expressed in minutes per day and used in columns 1 and 5 is
constructed by assigning midpoint values to the intervals displayed in Figure 1, panels (a) and (b).
23 We asked students whether in the last month of school they had been following online classes regularly,
and we posed the same question to parents regarding their children. The dependent variable in columns
2 and 6 is a dummy taking value 1 if the answer is “Yes, every time there was an online class”.
18platform during the last month of school, representing a 10 percent increase over the
mean.
Column 9 shows that treated students also behaved better during school hours. While
for 83 of the students in the control group teachers report behavioral problems during the
last month of school, this fraction is 6.4 percentage points lower among students in the
TOP program.
Overall, these results indicate that both the ‘quantity’ dimension of class attendance
and the ‘quality’ of learning from classwork were positively affected by our program,
suggesting a potential complementarity between the work done by the tutor after school
and that done by the teachers during school hours.
Tutors also seem to have contributed to making the subjects more interesting for their
tutees. Column 4 shows that treated students have a 5 percentage points higher proba-
bility of liking the subjects of math, literature or English relative to control students.24
Given how little our target population likes these subjects (only 28 percent answer in the
affirmative in the control group) this is a sizeable increase.
4.2 Academic outcomes and beliefs
In Table III we study the impact of TOP on academic performance and beliefs.25
[Insert Table III]
The dependent variable in column 1 is our key measure of performance, that is, the
fraction of correct answers given by the student in the standardized test we administered
at the end of the program, which covered the subjects of math, Italian and English (see
Section 3.1 for a detailed description). We find that the share of correct answers in the
test is 4.5 percentage points higher for treated students, a 9 percent increase over the
average of 53 percent correct answers in the control group. The effect is highly significant
(p-value 0.013) and corresponds to a 0.26 SD increase in the index of performance. This
is an impressive result if we take into account two factors. First, the median duration
of tutoring was five weeks. Second, tutors did not specifically prepare the students for
this type of test (multiple choice tests are not typically assigned as homework in Italian
24 We asked students how much they liked the three subjects in which tutoring was offered, on a 5-point
scale from “Not at all” to “Very much”. The dependent variable in column 4 is the mean of three dummies
taking value 1 if the answer is 4 or 5 in math, Italian, and English, respectively.
25 The outcomes in this Table are average values in all three subjects: math, Italian, and English. For
Beliefs and Overconfidence there are few cases for which we have missing information for one subject.
For those cases, we take the average over the subjects for which we have information.
19You can also read