APN AREIT UPDATE & INTRODUCING OUR NEW GLOBAL REIT INCOME FUND - HEATHCOTE MEET THE MANAGERS WEBINAR, OCTOBER 2020
←
→
Page content transcription
If your browser does not render page correctly, please read the page content below

APN AREIT UPDATE &
   INTRODUCING OUR NEW
GLOBAL REIT INCOME FUND
  HEATHCOTE MEET THE MANAGERS
         WEBINAR, OCTOBER 2020
COVID-19 IMPACTS ON AREITS
& REPORTING SEASON
OUTCOMES

                             2
Australian equities - C-19 impacted some sectors more than others
                                                   Cons.      Cons.                        Health-
    Index Return            ASX300      AREITs                         Energy     Fin.               Indust.     IT      Materials Telco     Utilities
                                                  Discret.   Staples                        care
    September                (3.6%)     (1.5%)    (2.6%)     (6.6%)    (11.1%)   (6.1%)     0.9%     (0.3%)    (6.8%)     (2.9%)   (2.2%)    (3.3%)
    August                       3.0%    7.9%      8.7%      (0.4%)     3.4%      1.0%      4.0%      4.6%     15.5%      1.2%     (3.8%)    (4.8%)
    July                         0.6%    0.6%      2.7%       3.4%     (6.6%)    (1.1%)    (3.9%)    (3.9%)     4.6%      5.8%      3.4%     (0.2%)
    June                         2.4%   (1.4%)     5.4%       5.1%     (2.0%)     4.4%      3.5%     (1.3%)     6.0%      2.3%      0.1%     (0.4%)
    May                          4.6%    7.0%      6.5%      (0.4%)     4.7%      5.2%     (5.3%)     3.7%     14.5%      8.1%      8.4%      3.1%
    April                        9.0%   13.7%     15.9%       2.4%     24.9%      2.8%      4.4%     12.7%     22.5%      14.2%     4.5%      2.7%
    March                   (20.8%)     (35.1%)   (25.9%)    (3.6%)    (37.5%)   (27.6%)   (5.4%)    (22.7%)   (17.9%)   (13.0%)   (14.7%)   (6.2%)
    QTD                          6.5%    5.7%      7.1%       5.7%      5.1%     10.1%      3.8%      4.0%     12.8%      4.2%      5.8%      3.6%
    YTD                      (4.8%)     (11.0%)    7.3%       5.5%     (39.7%)   (15.9%)    9.3%     (13.1%)   42.7%      6.8%     (1.5%)    (8.7%)
    Source: Bloomberg 31/09/20

▪     AREITs were hit second hardest by COVID in March, with the high retail exposure and offshore ownership along with falling A$
      (low $0.55) key drivers of panic selling.
▪     Significant recovery from April as investors saw an opportunity from the over-reaction. Gov’t stimulus and success in dealing with
      COVID saw foreign/new investors re-enter the sector. A$ began to recover (now $0.72, forecast $0.80?).
▪     Additional burden placed on Australian landlords (via Leasing Code of Conduct) making it the only sector mandated to provide
      this type of unprecedented support to customers. Circa A$2b+ in support provided thus far via rent waivers/deferrals which has
      constrained and skewed AREITs recovery.
▪     Earnings and capital value uncertainty remains but reflected in market pricing: Industrial 78% premium (GMG effect), Office 16%
      discount, Retail 12% discount to NTA but not all retail equal (discretionary malls -40%, non-discretionary malls 3% premium).
      Specialised: child care 6%, service stations 14% premiums. Bunnings Trust 34% premium! (Source: APN 16/10/2020)
▪     As the economy stabilises and begins to progress from the impacts of COVID, AREITs are positioned to benefit from a sustained
      recovery (two speed – Aust/Vic) thus providing an attractive proposition for value focused investors.

                                                                                                                                                         3
AREIT stock performance divergence under COVID-19 – opportunity?

                                                                                                          Source: Bloomberg 31/09/20

▪ Stock performance divergence has been extreme due to COVID (112% total return spread between GMG (industrial) &
  URW (malls)!)
▪ Industrial, specialist and funds management names have outperformed office (CBD vs. metro) and retail (not all bad) which
  dominate the Australian REIT market
▪ Medium/long term outlook of these names linked to COVID/ Australian economic recovery

                                                                                                                                       4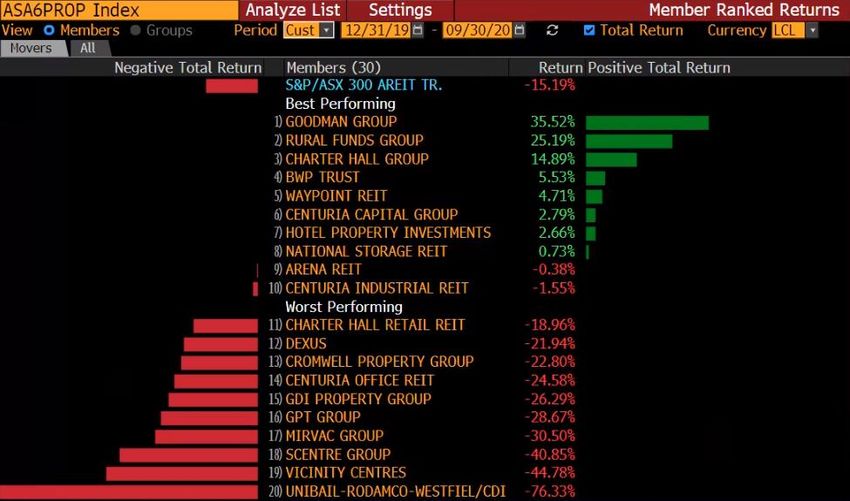
Cash collection is king                                                                     Not all retail was bad!

                                                                           Retail Rent Collection - Jun Qtr
                                                                           Malls               Convenience/LFR
                                                                           GPT          36% AVN *          89%
                                                                           SCG          48% CQR            84%
                                                                           VCX          38% SCP            77%
                                                                           Average      41%                83%

                                                                           Specialist Rent Collection
                                                                           Sector      Jun Qtr Jun Half
                                                                           Child Care    85%     95%
                                                                           Hotels        96%     98%
                                                                           Rural        100% 100%
                                                                           Servo's       97%     99%
                                                                           Average       95%     98%

                                                                          Source: APN/Company data.
                                                                          ^ Sector average is market cap weighted.
                                                                          Arithmetic average rent collection is 85% Jun Qtr, 92% Jun Half.
                                                                          * Large format retail landlord.

▪ June Qtr of FY20 saw average cash rent collection of just 79% due to COVID lockdown and Govt leasing
  code of conduct enabling qualifying tenants to negotiate waived and deferred rent with landlords
▪ Retail sector hardest hit but divergence in outcomes. Large mall discretionary focused landlords rent
  collection was half that of neighbourhood non-discretionary centres (supermarkets/essential services)
▪ Specialist sectors proved robust, childcare impacted but underpinned by Govt support, hotels by bottle
  shop sales, primary produce demand assisted rural and service stations deemed an essential service

                                                                                                                                             5
Asset values
               Sub-sector average cap rates since 2010

▪   According to JPMorgan Australian REIT cap rates expanded 3bp over the half with 19bp of cap rate expansion across Mall
    assets and 3bp softening in Secondary Retail offsetting the modest compression in Industrial/Office
▪   Mall cap rates averaged 5.0% at June, up from 4.8% at December. Retail landlords devalued their assets by ~10% with
    further declines expected in 2021
▪   Industrial cap rates continued to compress (now 5.8%), with the spread to Office/Malls narrowing to 35bp/80bps
▪   Office and Industrial cap rates are both currently at historic lows with the latter likely to compress further over FY21 due to
    strong demand dynamics

                                                                                                                                      6
Market recognising AREITs compelling value
                                         Sector Weighting Moves (Jul-20 to Aug-20)

              Source: JPMorgan – Fund Manager Radar Sept 2020

▪ AREIT weighting up further in August (+28bps July) – value/yield
▪ Jan 2020, 35% of Fund managers monitored by JPMorgan held AREITs, by Aug this had increased to 56%
▪ According to JPMorgan, REITs are now held at the highest stock concentration in the history of their FMR report

                                                                                                                7
Indicators of value
Fair value estimate (NAV/DCF) vs AREIT prices (premium/discount)
                                                                                                                   Sector trading at
                                                                                                                    3% discount to
                                                                                                                   UBS estimated
                                                                                                                     Fair Value.

                                                                                                                     Ex CHC/GMG
                                                                                                                     trades at 16%
                                                                                                                        discount!

                                                                                        Source: UBS Sept 2020

▪ UBS have AREITs trading at a 3% discount, however there is a huge distortion in individual stock valuations. Removing
  CHC/GMG highlights this distortion (16% discount) and long-term value opportunities available to investors.
▪ Retail stocks trading up to 40%+ discount to NTA. Scentre at 40% discount currently has no value attributed to
  development/property management businesses that have provided relatively consistent returns for 30+ years.
▪ Office names are ~10-20% discount to NTA. DXS at 16% discount currently has no value attributed to proven office/industrial
  development and funds management businesses.
▪ Industrial/Funds management names (CHC/GMG) trade at circa 200% premium to NTA due to majority active businesses.

                                                                                                                                 8
PROPERTY SECTORS
OUTLOOK

                   9
Australian Sector Outlook – COVID-19 implications vary

Sector        View      Comment
                        Office will be impacted by sharp economic slowdown hence expect pockets of pressure. Tenant specific but Govt/Corps
              Stable/
Office                  continue to pay rent. SMEs under pressure with abatements/deferrals providing support but majority of rent collected
              Mixed
                        (~95%+). Productivity/collaboration benefits recognised under lock-down.
                        Online spike (for those not experiencing supply chain issues) with further structural shift/growth (bought forward).
Industrial    Strong    Logistics/distribution & data centres in strong demand. Inventory levels may be increased long term due to failings
                        requiring more space. Outlook vey strong with capital & rental growth to continue.
                        Retail is a derivative of a global heath pandemic, with acute retail risk (only exceeded by aviation/travel). Social
                        distancing leads to demand suppression but impacts Centre/tenant specific. Non-Discretionary (supermarkets/
              Weak/     pharmacy) vs. Discretionary (F&B/Apparel/Others). Average June half rent collection rates ~80% with rent
Retail
              Mixed     waivers/deferrals (with lease extensions) per code to SMEs with larger tenant specific negotiations. Some tenant
                        business model concerns. Sentiment/2 nd wave, Govt support, Tourism + others impacting speed of recovery (esp Vic).
                        Landlords have balance sheet strength but retaining earnings will occur. CapValues declining but vary by type/location.

Childcare     Good      Essential service and important part of recovery phase. Operators re-emerge backed by strong Govt support.

                        Short term impact driven by length of shut down. Tenant covenant strong so once social distancing eases, will re-
Pubs          Stable
                        open/pay rent. Smaller operators facing significant pressure which may provide opportunities.
                        Transaction volumes to fall, unemployment up. Mortgage defaults? Improving construction starts for houses but
Residential   Mixed     pressure on apartments. New lending restricted but interest costs at historic lows/affordability up. Government stimulus
                        will underpin sector.

Rural         Good      Demand for primary produce remains strong. Export/import implications for some operators but rent will be paid.

                        Weak consumer sentiment and economic volatility not supportive to rates and occupancy. COVID impacts mixed with
Storage       Mixed
                        dislocation beneficial in some locations.
Service                 Essential service that has continued to trade. Strong tenant covenants and cashflow security key attraction with
              Good
Stations                transactional evidence (individual assets and portfolios e.g. Ampol/BP) supportive.                                       10
What this all means - AREIT FY21 Outlook
ASX 200 subsector earnings/payout guidance
Guidance No Guidance
AREITs 81.7% 18.3%
Financials 13.2% 86.8%
Industrials 37.4% 62.6%
Source: APN/Company announcements
▪ AREIT earnings attraction re-emerging as normalisation occurs
o Table indicates FY21 company guidance. Higher earning certainty from AREITs than financials or
industrials sectors
▪ AREITs offer value for long term investors – retail/office/specialised opportunities/IPOs/M&A?
▪ Further COVID stimulus should positively impact property (recent strong budget response)
▪ Attractive income solution for investors, with few alternatives
o Record low interest rates to continue (2023+?)
o Low rates a debt cost tail wind for AREITs and supportive to capital values
o APN AREIT Fund yields over 6.0%*
* Current running yield is calculated daily by dividing the annualised distribution rate by the latest month-end (ex-distribution) unit price.
As at 15 Oct 2020 the fund distribution yield was 6.04%. Distributions may include a capital gain component.
11APN GLOBAL REIT INCOME FUND
APN Global REIT Income Fund – a world of opportunity for income

Global commercial property: reliable and growing source of income
▪ Contracted rental income streams: relatively low risk cash flow from high quality global real estate portfolios
▪ Income growth opportunity: continuing urbanisation trend globally underpinning long term rental growth
International investment exposure and excellent diversification
▪ Gain exposure to North American, Asia Pacific and European property markets
▪ Broad range of commercial property sectors including mobile towers, data centres and healthcare
▪ REITs in developed global markets offer high quality, diversified portfolios
Defensive: real assets investment underpins value and provides inflation hedge
▪ Opportunities to invest at less than net asset backing
▪ Physical assets provide inflation hedge – enabling security of real income
▪ Investment is 100% liquid via leading international stock markets
Objective: regular income with lower than market volatility while maintaining the real value of investment
▪ Implements an established investment philosophy built on “property for income”
▪ Mandated focus on achieving relatively high income with lower relative risk and monthly distributions

Notes:   APN FM; GPR 250 REIT Index (AU) std. dev.11% versus MSCI global developed equities index std. dev. 15%

                                                                                                                    13
                                                                                                                    13
Why we’re launching the Global REIT Income Fund now?
Current market conditions suit our active, income focused approach and present an attractive
opportunity for long term investors
• Currently a range of opportunities to invest into select global real estate
sectors likely to benefit from accelerating structural trends
Accelerating Global Trends
• Global universe includes specialised REITs with exposure to data centres,
telecommunications towers, life sciences and acute healthcare
• Ability of the Fund to invest into the Preferred Securities issued by REITs is
Defensive Opportunities anticipated to help maximise the Fund’s defensive income attributes, while
minimising return volatility
• Global REITs currently offer a relatively high income compared to other
potential sources of international investment yields
High, Quality Income Yields
• COVID-19 has highlighted select sources of high quality yield underpinned by
tenants with strengthening market positions
• The Fund will have the opportunity to access select global real estate
Attractive Valuations securities currently trading at discounts to fair value, providing opportunities
for long-term capital growth
Source: UBS Research, APN
14
14Global REITs offer a deep and diverse opportunity set
Australia Asia Global
547
188
Number of REITs 33
2,920,000
Market cap.
210,000 290,000
(A$ millions) CapitaGreen, Singapore
875,500
NO. of properties
41,000 50,000
(approx.)
68% 76%
Concentration
(market cap outside of 19%
top 10 stocks)
Prologis iPort, New Jersey
Source: ASX300 AREIT Index and Bloomberg Asia REIT Index, Capital IQ/SNL Global REITs universe. September 2020
15
15REIT Preferred Securities – Delivering attractive income
REIT Preferred Securities offer investors a higher level of income return stability than common equity
dividends, capital growth potential and with priority of claim
Percentage that did not cut or suspend
• Preferred Securities have a higher distributions through COVID-19*
Superior Ranking ranking than equity, so investors
97%
will be paid first
65%
• REIT Preferred Securities prices
Lower Volatility show ~3x less volatility than their
corresponding equity prices
US REITs US REIT Preferred Securities
• Income from REIT Preferred
Distribution yield^
Income Stability Securities has exhibited greater 6.35%
stability (see below)
3.77%
• Universe includes issues from a
Sector diverse range of REIT sectors
Diversification • ~100 issues across ~US$20 billion
market capitalisation US REITs US REIT Preferred Securities
Source: Capital IQ SNL, Bloomberg, BMO Capital Markets, JP Morgan, APN FM
* Percentage by market capitalisation, US REITs universe comprises JP Morgan coverage, US REIT Preferred universe comprises APN coverage
^Weighted average by market capitalisation, US REITs universe comprises APN of US carve-out of GPR 250 REIT Index yield, US REIT Preferred universe comprises APN coverage October 2020
1 1616Fund attributes
The Fund aims to provide a high relative income yield with lower relative volatility while
preserving the real value of investment over the investment period
North America Asia Index^ Portfolio*
Portfolio Metrics*
~68% USA, Canada ~18% Singapore, Japan, Stocks 204 49
Hong Kong
Region
Dividend Yield 4.08% 5.75%
Oceania Europe
Dividend Growth 3.62% 2.36%
Australia, New UK, France, Belgium,
~7% Zealand
~7% Price Volatility 18.28% 14.09%
Spain, Netherlands
Sector
*Metrics provided are indicative only, prior to the impact of any fees, withholding taxes on underlying investment distributions Residential REITs: 3%
^The GPR 250 REIT Index (AU) or equivalent will be adopted by the Fund
Price Volatility is based on 2 year historical data sourced from Bloomberg. Dividend growth is 2 year forward CAGR. Metrics are current as at 30 September 2020
17Fund attributes
Exposure to high quality portfolios with defensive attributes and ability to benefit from
accelerating structural trends
• Global e-commerce growth
Industrial REITs
• Supply chain resilience
• Improved position in capital stack
REIT Preferred
• Asset, earnings coverage
Securities
• Management track record
• Non-discretionary, grocery
Retail REITs
• Fuel based hyper convenience
• Non-generic / specialised users
Office REITs • Limited ability to WFH
• Non-CBD
• Increasing demand for digital data
Specialised REITs
• Mobile communications growth
18
18Covid-19 and Global Real Estate
▪ Societies globally have been progressively subjected to varying degrees of restrictions on physical movement and
Realities of interaction in response to the COVID-19 health crisis
Lockdown ▪ Within weeks populations across both developed and emerging markets were faced with the prospect of an enforced
hibernation that would present profound, but in many cases initially, uncertain consequences
▪ GDP forecasts released by the IMF indicate COVID-19 pandemic may result in an immediate shock, followed by one of the
Economic quickest recoveries on record with global contraction of -4.9% in 2020 followed by 5.4% growth in 2021
Impact ▪ In response Governments around the world have enacted fiscal policy responses of unprecedented magnitude, while
central banks have moved to release liquidity
▪ Commercial real estate returns are inextricably linked to utilisation - so restrictions enforced to keep populations at home,
pauses on tenant business and government policies preventing evictions are affecting many landlords
Real Estate ▪ Landlords with exposure to hospitality, leisure and discretionary retail are faring worst throughout the pandemic, however
Impact those operating mobile towers, data centres, logistics facilities and non-discretionary-retail are holding up well
▪ How populations, consumers and businesses respond to the pandemic will have lasting effects on real estate trends
Real GDP Growth Forecast YoY Covid-19 Fiscal Response (% of GDP)
5% Singapore
Australia
UK
0%
Japan Germany Canada France UK United Singapore Australia Japan
States US
-5% Canada
France
Germany
-10%
2019 2020 2021 2022 0% 5% 10% 15% 20%
Source: Bloomberg, IMF, Macquarie, UBS, APN FM. 30 September 2020
1919APN funds deliver competitive income
Source: APN, BNZ, Bloomberg, Macquarie, RBNZ , S&P
* BNZ 1yr term deposit rate ($100k)
APN fund’s distribution yields are as at 30 September 2020. They are calculated using average distributions after management fees and expenses. Distributions may include a
capital gains component. Past performance is not an indicator of future performance. *Note, an investment in an APN fund should not be regarded as an alternative or substitute to
a deposit with a bank or deposit-taking institution. There is a different return profile and additional risks associated with investing in an APN fund compared to such a deposit.
.
20
20Q&A
2121Contacts
Pete Morrissey Mark Mazzarella, CFA
CEO Real Estate Securities Portfolio Manager, Real Estate Securities
pmorrissey@apngroup.com.au mmazzarella@apngroup.com.au
Follow us…
@apngroup
APN Property Group APN Property Group Limited
Level 30,101 Collins Street,
apnpropertygroup
Melbourne, Vic 3000
www.apngroup.com.au apngroup.blog
Adviser Services Hotline 1300 027 636 apnpropertygroup
2222Disclaimer
This presentation has been prepared by APN Property Group (ASX:APD) comprising APN Property Group Limited (ACN 109 846 068) and APN RE Limited (ACN 627 612 202, AFSL
No. 510685) as responsible entity for APD Trust (ARSN 629 330 007) (APN) and APN Funds Management Limited (APNFM) (ACN 080 674 479, AFSL No. 237500). APNFM is a
wholly owned subsidiary of APN Property Group Limited and the responsible entity and issuer of the APN Property Group products. This presentation contains summary information
about APN, APNFM and one or more of its funds. Information contained in this presentation is current as at 29 September 2020. This presentation comprises general financial advice
only and is not intended to contain or be financial advice for the purposes of the Financial Advisers Act 2008 (NZ), the Financial Markets Conduct Act 2013 (NZ) or Corporations Act
2001 (Aust). In preparing this presentation, APN and APNFM did not take into account the investment objectives, financial situation and particular needs of any particular person. This
presentation is for information purposes only and only intended for the audience to who it is presented. Accordingly, before acting on the general advice, prospective investors should
consider the appropriateness of the advice having regard to their objectives, financial situation and needs. Before investing in a product, prospective investors should read the relevant
disclosure document in full, obtain individual financial advice and assess whether an investment is appropriate in light of their own financial circumstances. This Presentation does not
constitute an offer of interests in APNFM’s funds to investors. Past performance is not a reliable indicator of future returns. Offers of units in APNFM’s range of funds are made in the
relevant fund product disclosure statement (PDS). You should consider important information about risks, costs and fees in the relevant PDS. Anyone wishing to apply for units will
need to complete the application form attached to the relevant PDS. APNFM manages the funds and will receive management fees as set out in the relevant PDS.
This presentation may contain forward-looking statements regarding future events. Any forward-looking statement included in this presentation involves subjective judgment and
analysis and is subject to significant uncertainties, risks and contingencies, many of which are outside the control of, and are unknown to, APN and its related bodies corporate,
shareholders or respective directors, officers, employees, agents or advisors (collectively, Related Parties). Such forward-looking statements are based on assumptions and
contingencies which are subject to change without notice. They are provided as a general guide only and are not guarantees or predictions of future performance. There can be no
assurance that actual results will not differ materially from those expressed in the statements contained in this document and neither APN nor APNFM undertakes any obligation to
revise the forward-looking statements included in this document to reflect future events or circumstances. The forward‐looking statements only speak as at the date of this presentation
and, other than as required by law, APN, APNFM and their Related Parties disclaim any duty to update forward looking statements to reflect new developments.
To the fullest extent permitted by law, APN, APNFM and their Related Parties make no representation and give no assurance, guarantee or warranty, express or implied, as to, and
take no responsibility and assume no liability for, the authenticity, validity, accuracy, suitability or completeness of, or any errors in or omission, from any information, statement or
opinion contained in this presentation. APN and APNFM disclaim all liability and responsibility for any direct or indirect or consequential loss, damage, cost, expense, outgoing, interest,
loss of profits or loss of any kind which may be suffered by any recipient through relying on anything contained in or omitted from this document. This material shall not be reproduced
or used for any other purpose without the express permission of APN.
23You can also read