App Usage Predicts Cognitive Ability in Older Adults
←
→
Page content transcription
If your browser does not render page correctly, please read the page content below
CHI 2019 Paper                                                                              CHI 2019, May 4–9, 2019, Glasgow, Scotland, UK

 App Usage Predicts Cognitive Ability in Older Adults
                Mitchell L. Gordon∗                                      Leon Gatys                             Carlos Guestrin
                Stanford University                                       Apple Inc                                 Apple Inc
               mgord@cs.stanford.edu                                  lgatys@apple.com                         guestrin@apple.com

                  Jeffrey P. Bigham                                   Andrew Trister                              Kayur Patel
                       Apple Inc                                           Apple Inc                               Apple Inc
                 jbigham@apple.com                                   atrister@apple.com                         kayur@apple.com

ABSTRACT                                                                          compared to what we know about the younger population’s
We have limited understanding of how older adults use smart-                      smartphone usage patterns [27]. Understanding similarities
phones, how their usage differs from younger users, and the                       and differences in how older adults and the younger popula-
causes for those differences. As a result, researchers and                        tion use smartphones is important for designing engaging
developers may miss promising opportunities to support                            and helpful experiences. Emerging trends in health and well-
older adults or offer solutions to unimportant problems. To                       ness applications delivered through smartphones seem espe-
characterize smartphone usage among older adults, we col-                         cially well-suited to the needs of older adults, yet designers
lected iPhone usage data from 84 healthy older adults over                        may fail to create applications that address the needs of older
three months. We find that older adults use fewer apps, take                      adults without this understanding. For example, older adults
longer to complete tasks, and send fewer messages. We use                         often experience cognitive decline while aging, but we do
cognitive test results from these same older adults to then                       not know to what extent this affects smartphone use [26].
show that up to 79% of these differences can be explained by                         In this paper, we present a quantitative study of smart-
cognitive decline, and that we can predict cognitive test per-                    phone usage by older adults (aged 61 to 76), utilizing a dataset
formance from smartphone usage with 83% ROCAUC. While                             that we created containing usage metadata logs of 84 iPhone
older adults differ from younger adults in app usage behavior,                    users over a three month period. We characterize application
the “cognitively young” older adults use smartphones much                         usage in a number of different ways, including by type and
like their younger counterparts. Our study suggests that to                       number of applications used, amount of time spent on appli-
better support all older adults, researchers and developers                       cations, and behavior in switching between applications. We
should consider the full spectrum of cognitive function.                          compare with prior work that looked at similar behavior in
                                                                                  the general population, noting that the usage behaviors of
ACM Reference Format:
                                                                                  older adults are different than younger adults, but more simi-
Mitchell L. Gordon, Leon Gatys, Carlos Guestrin, Jeffrey P. Bigham,
Andrew Trister, and Kayur Patel. 2019. App Usage Predicts Cog-
                                                                                  lar than might have been previously assumed. This suggests
nitive Ability in Older Adults. In CHI Conference on Human Fac-                   that approaches developed for the general population might
tors in Computing Systems Proceedings (CHI 2019), May 4–9, 2019,                  usefully be applied for older smartphone users as well.
Glasgow, Scotland UK. ACM, New York, NY, USA, 12 pages. https:                       We also uncover important differences that may guide
//doi.org/10.1145/3290605.3300398                                                 design principles for application developers to better design
                                                                                  for the older population. By reproducing analyses frequently
1 INTRODUCTION                                                                    performed on other smartphone usage data sets in prior
Although more than 42% of older adults use smartphones                            work, we demonstrate that older adults display distinct app
[3], relatively little is known about smartphone usage pat-                       usage characteristics from younger adults, such as using
terns amongst older adults (65 or older), particularly when                       fewer apps and keeping them open for longer. To further
∗ This
                                                                                  characterize the usage patterns of older adults, we apply new
         work was done while Mitchell L. Gordon was an intern at Apple Inc.
                                                                                  analysis techniques for app-usage dynamics to reveal how
Permission to make digital or hard copies of part or all of this work for         applications are used in sequence (e.g., most switches into
personal or classroom use is granted without fee provided that copies are         Photos comes from Camera, and most switches into Safari
not made or distributed for profit or commercial advantage and that copies
                                                                                  come from Mail).
bear this notice and the full citation on the first page. Copyrights for third-
party components of this work must be honored. For all other uses, contact           While these differences likely result from a complex com-
the owner/author(s).                                                              bination of generational and age-related shifts in culture,
CHI 2019, May 4–9, 2019, Glasgow, Scotland UK                                     values, lifestyle, and cognitive / physical abilities, we focus
© 2019 Copyright held by the owner/author(s).                                     on how cognitive function of participants is associated with
ACM ISBN 978-1-4503-5970-2/19/05.                                                 differences in use. Cognitive function is of particular interest
https://doi.org/10.1145/3290605.3300398

Paper 168                                                                                                                                 Page 1
CHI 2019 Paper CHI 2019, May 4–9, 2019, Glasgow, Scotland, UK
in the context of older adults, as cognitive function has pre- deciding to download publicly available logging apps, typi-
viously been found to be important across a wide array of cally did not collect demographic data but can be assumed
activities, e.g., in technology usage [16], office productivity to contain primarily younger adults given the demographics
[29], and avoiding motor vehicle accidents [55]. of Android users [10]. While some specific demographics
Each participant in our study also underwent neurocogni- have been investigated, such as a 14-participant study of
tive testing in two major cognitive domains: (i) perceptual teenagers [9], researchers have yet to characterize the usage
and motor, and (ii) learning and memory. To explore how dif- patterns of older adults.
ferences in cognitive function might explain differences we The second unifying factor is that, as pointed out by Mor-
observe in behavior, we constructed a quasi-experiment im- rison et al. [36], nearly all of this work has been performed
plemented using our usage log data paired with the neurocog- using Android phones rather than on iPhone and iOS, as
nitive testing results of our participants. Our 84 participants the Android platform allows for the easy installation of log-
had assessed neurocognitive function in the normal range, ging software for OS-level events such as app launches and
yet we observed a wide distribution of performance on neu- phone unlocking. Morrison responded by reproducing on
rocognitive testing. Specifically, some healthy older adults iPhone a variety of studies previously performed on An-
perform on neurocognitive testing at the level of younger droid. Morrison achieved this by focusing on 10,000 jailbro-
adults, while others did not. We compared app usage behav- ken users, which enabled them to install an app that could
ior of those who performed like younger adults with the log OS-level events. While this study did not collect or re-
remainder of our participants, and found that the observed port demographic information, people who jailbreak their
differences in usage behavior can be largely explained by iPhones have been found to have a mean of 36 years old and
cognitive function. We generalized these results into a pre- and are 65% male [35].
dictive model capable of predicting neurocognitive testing In this paper, we analyze iPhone usage patterns – notably,
performance from app usage patterns with 83% ROC AUC. older adults are more likely to use an iPhone than any other
Our research demonstrates that while older adults display age groups [22]. Therefore, when we compare usage statis-
some notable differences as compared to younger adults, tics reproduced on our population with other studies, we do
“cognitively young” older adults use smartphones much like so primarily with Morrison et al.’s work, given that it is the
their younger counterparts. To better support all older adults, only study reporting general usage patterns from iPhones.
researchers and developers should especially consider how iOS is different than Android and may promote different us-
to design applications that can accommodate users who are age patterns. Further, people who choose iPhone have been
no longer cognitively young. Older adults now form a sizable found to exhibit sociological differences [43]. One difficulty
percentage of the user base of smartphones. Our research with this comparison is that, as noted by Morrison, users of
contributes an important step toward understanding how to jailbroken devices likely differ from the general population
best support them. in that they may be more engaged and familiar with their
iPhones. Therefore, their usage patterns can likely be con-
2 PRIOR WORK sidered on the more ‘extreme’ end of what we may expect
Our work is informed by prior work on (i) studies of smart- from the general population [36].
phone app usage patterns, (ii) how older adults use tech- Technology and Older Adults
nology, and (iii) predicting personal characteristics from
smartphone usage. Older adult’s relationship with technology is an important
area of research and has been studied extensively. Technol-
ogy use tends to decline with age [46]. While older adults
Smartphone App Usage Patterns
generally use fewer technologies than younger adults, and
Smartphone app usage patterns have been studied exten- use them less frequently, notable exceptions have been found
sively. Researchers have investigated how many apps people in domains such as healthcare [11, 40].
install, which apps are most used at which time of day, and While older adult’s general relationship with technology
how long these apps are kept open for [10, 19, 24]. They’ve is well-documented, their specific usage patterns are not.
investigated daily routines [20] and even predicted which Work which quantifies how older adults use smartphones
app a user will launch next [5]. – increasingly the most important and versatile pieces of
We note that two factors unify most of this work. The technology in our lives – is extremely limited. Many stud-
first is that these studies have typically relied upon data ies have broadly surveyed older adults on their preferences
from younger adults. For instance: in Do et al’s study, using and attitudes towards mobile phones, but have not analyzed
data gathered from 77 volunteers, only 11% of participants actual usage data [38]. Some studies are centered around
were over 40 [19]. Larger-scale studies, which rely on users input. For instance, older adults have been found to input
Paper 168 Page 2CHI 2019 Paper CHI 2019, May 4–9, 2019, Glasgow, Scotland, UK
text via voice equally as fast as younger adults, but slower in Dataset statistics
other input methods [49]. While some work has sought to # of participants 84
create guidelines for designing mobile phone interfaces for Age range 61-76
older adults, typically recommending larger buttons and less Median age 66
complex interfaces [1, 18, 47], it relies primarily on surveys % female 69.0
of older adults and their preferences, rather than analysis of Observation period Three months, mid 2018
their actual app usage data. Total app launches 494, 641
Even more difficult than understanding the app usage pat- Total unlocks 186, 968
terns of older adults is understanding why these patterns Total minutes of app use 1, 396, 429.9
might be different than younger adults. One area of study is Total messages 386, 573
cognitive ability. Older adults with cognitive difficulties may Total calls 66, 371
perceive technology as more difficult to use [45], and indi- Table 1: Descriptive statistics from our dataset of
viduals with higher cognitive levels are likely to participate smartphone usage log data from older adults.
in a wider variety of web-based tasks (i.e., Internet use and
email) [23]. Perceptual speed, an area of cognitive ability, as tapping on the space-bar followed by the first character of
has been found to be a reasonable predictor of determining a word, rather than on higher level app usage behavior [17].
desktop browsing characteristics in older adults [15]. Poten-
tial cultural and lifestyle causes have also been explored. In 3 DATASET DESCRIPTION
a qualitative survey of 14 older adults, several reasons for We conducted a three-month observational study using smart-
a lack of technology use emerged: they were found to be phone data collected from 84 healthy older adults, ranging
uncomfortable with having to take on responsibility for tasks in age from 61 to 76, with paired neurocognitive testing. Our
previously handled by trained professionals, made deliberate dataset contains 494,641 app launches and 186,968 phone
decisions to not use technologies when they perceived them unlocks. Table 1 lists descriptive statistics from our dataset.
as replacing or eroding something of value to them; and sup- All participants were existing iPhone users (iPhone 5S
ported by the fact that opting out of technology use fits with or newer) for at least one year prior to joining the study.
cultural expectations and thus seems acceptable, despite be- Participants were provided with an iPhone 7 Plus to use
ing increasingly limiting in digital society [31]. In our work, as their primary personal phone. The iPhones were instru-
we aim to quantify how much of certain app-usage behav- mented with logging software that recorded lock/unlock
ioral differences between older adults and younger adults events, apps launched/closed, and anonymized metadata for
can be explained by cognitive ability versus other factors. each text message and call sent/received. A full backup of
their personal pre-study iPhone was uploaded to the new
Relating Personal Characterstics to Smartphone Use iPhones 7. We gave participants new iPhones installed with a
Smartphones can be a window into their users’ minds. Early backup of their existing iPhone for two reasons: first, logging
work in this area found that smartphone usage patterns app launches on iOS requires custom software that could not
can be used to predict personality traits [12]. More recently, be installed on participants’ existing phones. Second, doing
smartphone usage patterns have been used to predict propen- so removes confounders related to individual device quality,
sity to trust others, their college GPA, depression dynamics, speed, size, or battery.
sleep quality, and social capital [6, 8, 48, 51, 52]. Researchers At the start of the study, participants took a neurocogni-
have even shown that people exhibit unique app usage signa- tive screening exam called the Cogstate Brief Battery (CBB).
tures, and can be differentiated just from their usage patterns We discuss the CBB in more detail in Section 5. No partici-
[56]. Other work has focused on linking real-time physio- pants with diagnosed cognitive impairment were included
logical traits to usage patterns. In a study of 20 participants in our study. Participants were recruited at medical centers
over 40 days, Murnane et al. connected app usage patterns in several locations around the United States. Participants
with biological rhythms, finding that usage patterns vary for completed a survey to report diagnosed medical conditions.
individuals with different body clock types [37]. We removed participants diagnosed with cognitive impair-
To our knowledge, our work is the first to focus on how ment, deafness, blindness, motor impairment disorders, or
smartphone app usage patterns can be explained by cog- depression. Participants were not given special instruction
nitive ability. Other work has looked at how higher-level as to how frequently or for what purpose they should use
smartphone habits may have a lasting impact on cognitive their iPhones. We surveyed participants for their race, edu-
function and development [54]. We are aware of only one pa- cational attainment, and employment status. 82 participants
per which predicts cognitive ability from smartphone usage, identified themselves as White Caucasian, 1 as African Amer-
and its focus was on lower level physical touch events such ican, and 1 as Hispanic. 34% had achieved a graduate degree
Paper 168 Page 3CHI 2019 Paper CHI 2019, May 4–9, 2019, Glasgow, Scotland, UK
as their highest level of education, 35% an undergraduate Category Avg. du- Pct. Sample apps
ration launches
degree, and 31% a high school diploma. 26% were currently
Communication 74.2 46.32 Messages, Mail, Phone, Messenger
employed full time, 13% part-time, 53% retired, and 6% other. Browser 144.7 8.32 Safari, Google Chrome
Productivity 70.3 6.80 Gmail, Calendar, Notes, Reminders
For the purposes of our evaluation, we consider an app Photo & Video 103.1 6.55 Instagram, Camera, Photos, YouTube
launch to take place each time a user actively brings a new Social Networking
Utilities
207.3
107.1
6.37
4.63
Facebook, LinkedIn, Nextdoor, Pinterest
Google, Clock, App Store, Calculator
app into focus. This includes when a user taps on a notifica- Games 364.4 4.04 Words With Friends, Candy Crush
Navigation 226.5 2.59 Google Maps, Apple Maps, Waze
tion to launch its corresponding app, but does not include News 196.6 2.48 Apple News, BuzzFeed, NY Times
Health & Fitness 67.5 1.73 Activity, FitBit, Health, MyFitnessPal
notifications themselves, widgets, or other background ser- Settings 68.1 1.61 Settings
vices. Following convention from prior work, when app cat- Weather 53.6 1.28 Weather, The Weather Channel
Finance 55.7 1.19 E*TRADE Mobile, Chase Mobile, Wallet, Coinbase
egories are discussed, we use the categories provided by app Music 159.0 1.19 Apple Music, Pandora, Spotify
Travel 73.2 0.98 Yelp, Uber, Lyft, Expedia
developers to the Apple App Store. For Apple’s first party Business 94.2 0.81 Slack, Kisi
apps that are built into iOS and are thus not on the Store, we Shopping
Books
116.2
168.6
0.69
0.59
Amazon, Poshmark, Groupon
Audible, Kindle, iBooks
manually assigned apps to categories. Entertainment 183.2 0.56 Podcasts, Netflix, iTunes Store, Hulu
Lifestyle 96.0 0.53 Redfin Real Estate, Nest, Zillow
Food & Drink 111.7 0.27 Starbucks, OpenTable, Caviar
4 HOW OLDER ADULTS USE SMARTPHONES Sports 238.8 0.21 ESPN, FanDuel, 18 Birdies Golf
Reference 237.9 0.11 Bible, Dictionary
We begin by reproducing analyses by Morrison et al. [36]. Education 194.6 0.08 Duolingo, Lumosity: Daily Brain Games, iTunes U
Medical 100.2 0.07 Mychart, Mango Health, Migraine Buddy
As mentioned in our Prior Work section, this is the only
other paper to have characterized iPhone app-usage statis- Table 2: Average duration and percent launches for
tics. Their analyses consist primarily of descriptive statistics each category, sorted by most launched. Categories for
centered around number of apps used, type of apps used, each app are taken from the App Store.
total usage by time of day, and usage duration. In the follow-
ing subsections, we report our results and discuss how they
compare. In many cases, the scope of our analysis is limited seconds. Perhaps the biggest difference in a single category
by available prior work. In many cases, we go beyond what is Weather: the category makes up only 0.3% of launches in
has been done in prior work in order to present a more thor- younger adults, but is more than quadrupled for older adults
ough picture of how older adults use smartphones, despite at 1.3%. Duration of Weather apps is significantly longer for
the inability to directly compare those results to younger older adults as well, at 53.6 seconds vs. 28.9 seconds.
adults. Thus, our work combines replication of prior work
with new analysis, focusing on older adults whose usage has App usage by hour of day
not been studied in this way before.
Number of apps and duration of use
Participants used an average of 50.3 unique apps (std. dev
22.7). This is notably lower than Morrison et al., who found
an average of 64.0 (std. dev. 52.5) and the Boehmer et al.
Android study which found an average of of 74.37 (std. dev.
44.16) [10]. We find that older adults keep apps open for an
average of 121.2 seconds, nearly 37% longer than the 88.6
seconds found by Morrison et al.
App usage by category
In Table 2, we aggregate app usage by category. We list the
percent of app launches that fall into each category along
with the mean duration of app usage. In a comparison to the Figure 1: Older adults use their phones earlier in the day
results reported Morrison et al.’s work (who also used the App than younger adults. We show app launches by hour of day
Store’s categories), we find that the Communication category from our dataset of older adults overlayed on the results re-
dominates for both populations, though with older adults at ported by Morrison et al [36] for younger adults. The y-axis
a slightly lower 46.3% than Morrison’s 49%. However, Social is normalized as percent of total usage to allow for compar-
Networking apps make up only half as many of launches for ison between populations with different sample sizes.
older adults as they do for younger adults, at 6.8% compared
to 12.6%. When older adults do launch a Social Networking Figure 1 shows the total number of app launches per hour
app, they keep it open for nearly twice as long, 207 vs. 115 of the day, overlayed atop the same plot from Morrison et
Paper 168 Page 4CHI 2019 Paper CHI 2019, May 4–9, 2019, Glasgow, Scotland, UK
al’s work among younger users. We note a distinct shift in analyze this data, we created bi-grams from each sequence.
older adult’s usage to earlier in the day. This may be sugges- For instance, if within a single session a user opened Face-
tive of different sleep patterns between the populations, as book, followed by Messages, followed by Weather, we would
smartphone usage has been found to provide a reasonable then have the bi-grams (Facebook, Messages) and (Messages,
measure of sleeping habits [14]. Weather), We then treat these bi-grams as a bipartite graph,
where apps being switched out of and apps being switched
App micro-usage into are treated as disjoint sets of nodes, with edges indicat-
Ferreira et al. introduced the concept of a micro-usage [21], ing a switch between two apps. We find 289,771 resulting
which defines short bursts of interaction with apps versus switches in our dataset. We chose to remove all self-switches
longer, more involved interactions. Typically, micro-usage is from our analysis. While likely an interesting and worthy
found by partitioning app usage duration data into two clus- area of study, self-switches are complicated by unclear in-
ters, which look for a natural break point that can separate tent (e.g., someone may have accidentally closed an app or
a micro-usage from a longer usage. To compute this break- be returning from a phone call). We believe that extracting
point, we follow prior work by applying k-means clustering meaning from these switches would require further logging
to log-scale app duration data, with k=2. The micro-usage of OS-level behaviors.
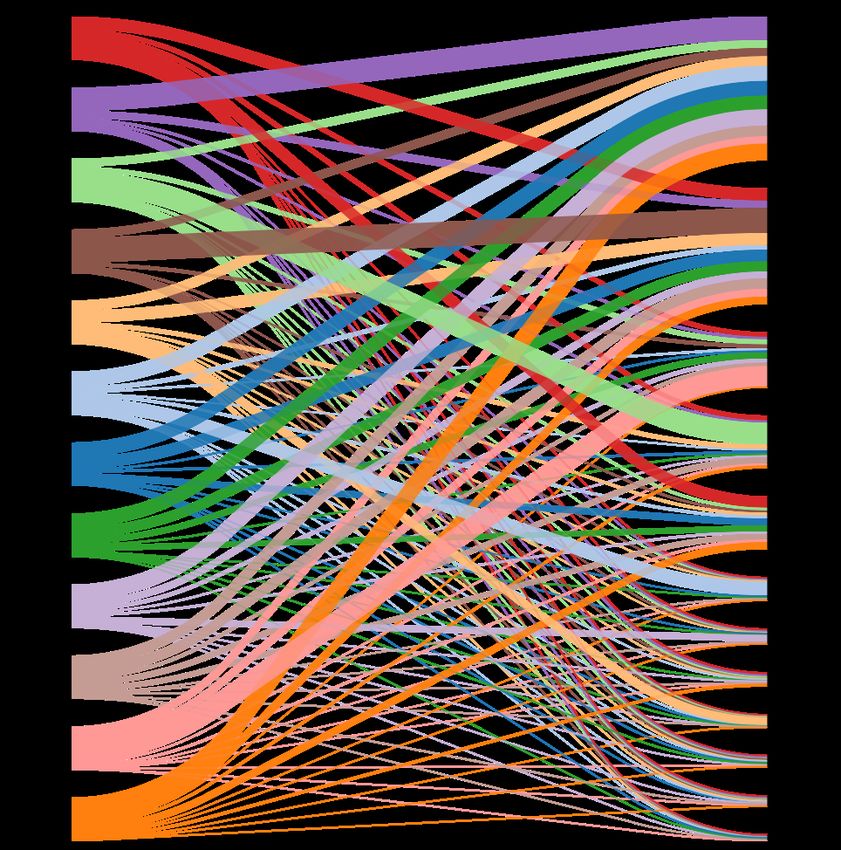
breakpoint we found was 27.5 seconds, 28.5% higher than Figure 2 shows the frequency and direction of app switches
the 21.4 seconds found by Morrison et al. We propose two for the top twelve apps in our dataset (in terms of total
possible explanations for this difference: that older adults launches), created from the bi-grams discussed above. The
attempt to complete more tasks during micro-uses of apps, thickness of the lines indicate magnitude in terms of percent
or that older adults take longer to complete the same tasks of switches. While for clarity of visualization we only plot
during micro-uses as younger adults. Unfortunately, we can’t the top twelve apps, we note that 72% of sessions start with
conclusively investigate this with our data, but it may be an one of the top twelve apps, and 70.7% of switches are into
interesting question for future work. one of the top 12 apps.
We note a few interesting trends. A sizable percent of
Multi-app sessions switches from every app are into Messages. Given that Mes-
Following Morrison et al., a session is defined as the period sages displays a notification when a new message is received,
of activity between unlocking and locking a phone, with the and that incoming messages are often of high interest to
requirement that a session is ended only after the phone has smartphone users [50], this behavior makes sense – users
been locked for at least 30 seconds. We found that partici- stop what they are doing when they receive a message to
pants open an average of 2.9 apps per session, with 67.2% attend to that message. On the opposite end of the spec-
of sessions consisting of 3 apps or fewer, and 73.5% of ses- trum, we see that Contacts is rarely switched into, even from
sions consisting of 4 apps or fewer. 36.1% of sessions contain Phone. We observe that Messenger (Facebook’s messaging
only one app. By comparison, Morrison et al. found 76.7% product) shows a strong link to Facebook, while Facebook
containing 3 apps or fewer, 83.5% containing 4 apps or fewer, has a much wider distribution of potential switches. Future
and 38% containing only one app. These results suggest that work, particularly with a larger sample size, should work
older adults open more apps per session than younger adults. to understand and visualize how these switches may differ
Morrison does not report average number of apps per ses- between users.
sion.
Switch duration. Above, we studied the origin and destina-
App dynamics tion of app switches. We now investigate the time it takes
Inspired by work relating to behavioral patterns during web for those switches to occur. Specifically, we are interested in
surfing sessions [53], we believe that deeper exploration of switches where the user chooses to move directly from one
sequential app usage within and between sessions is an in- app to another app, without engaging in other iOS-related
teresting and important component in understanding the features such as widgets along the way, which adds noise
app-usage behavior of users. Specifically, we focused on be- to the process of switching. For this analysis, we therefore
havior around how users switch from one app to another. filtered to only switches where there are two sequential apps
Though not studied in great detail in prior literature, some logged as coming into focus with no other process coming
work has used sequential app usage patterns as a means to into focus between them (the home screen itself is not logged
predict or recommend future apps [33]. We aim to under- by the OS as coming into focus when it appears). To further
stand and visualize these patterns, and call this area of study reduce the chance that a user is not directly switching from
“app dynamics”. In this paper, we limited our scope of ex- one app to another (as opposed closing an app, putting their
ploration to sequential app usage within single sessions. To phone down for a little while without locking it, and picking
Paper 168 Page 5CHI 2019 Paper CHI 2019, May 4–9, 2019, Glasgow, Scotland, UK
Figure 2: Frequency and direction of app switches, as percent of total switches, for the top twelve apps in our dataset. Messages
is the most frequently switched into app, making up 31% of switches. We see clear connections between some apps, such as
Camera to Photos and Messenger to Facebook.
it back up again), we filtered to switches that took at most 30 earlier, in this paper we focused specifically on cognitive
seconds. This left us with 120,721 switches. We found that a function. We aim to quantify how much of the difference
switch takes an average of 10.79 seconds. between usage patterns of younger adults and older adults
can be explained by cognitive decline. To do this, we defined
Messages and calls a group of cognitively young older adults and investigated
We found that our users send and receive an average of 37.2 how these users differ from younger adults, as well as from
messages and 5.1 calls per day. While we are not aware of cognitively normal adults.
any iPhone-specific studies reporting the messaging and
calling behavior of younger adults, a platform-agnostic Pew Cogstate Brief Battery Assessment
study found that teenagers send and receive a mean of 67 To answer this question, we make use of our app usage
text messages per day [32]. data in combination with cognitive test results from each
participant.
5 EXPLAINING BEHAVIORAL DIFFERENCES During study enrollment, the CogState Brief Battery as-
THROUGH COGNITIVE ABILITY sessment (CBB) was administered to each participant. The
We provide evidence above that older adults display notably CBB consists of a simple reaction time task (Detection task),
different app usage patterns than younger adults. We now a choice reaction time task (Identification task), a one-back
ask: how can these differences be explained? As mentioned working memory task (One-Back task), and a continuous
Paper 168 Page 6CHI 2019 Paper CHI 2019, May 4–9, 2019, Glasgow, Scotland, UK
recognition visual learning task (Learning Task). A full de- NC groups along with statistical significance from a Mann-
scription of each task and their validity is available in Maruff Whitney U test. We also report Pearson correlation values
et al. [34]. For each individual task, Cogstate reports many for each metric continuously over the entire dataset (not
associated raw performance measures, often involving accu- just the matched users in the YC and NC groups). Table 3
racy and speed of performance. Depending on the task, one shows the results from our quasi-experiment. For each app
of the raw scores is designated by Cogstate as the “primary usage metric, to test whether our result may be confounded
outcome” of the task. Cogstate also provides two composite by socio-economic factors, we also ran an ANCOVA analy-
scores computed from a mixture of these raw scores and sis to look for a main effect of race, educational attainment,
normalized across ages. The two composites are described or employment status on app usage patterns, after control-
as follows: Psychomotor Function/Attention composite, in- ling for cognitive scores. We do not find significant main
corporating the Detection and Identification tests, relative to effects, meaning we don’t find evidence these covariates are
age-matched normative data, and Learning/Working Mem- confounding the results of our quasi-experiment.
ory composite, incorporating the One Card Learning and One
Back tests, relative to age-matched normative data. Within Quasi-experiment Discussion
our population of healthy older adults, we find that our CBB The results of our quasi-experiment indicate that a surpris-
scores are approximately normally distributed. ingly large amount of the difference in app usage behavior
between older adults and younger adults can be explained by
Experimental design cognitive ability. In this section, we discuss the results from
To determine whether differences in app usage patterns be- each app-usage behavior tested in the experiment. We found
tween younger adults and older adults can be explained by that cognitive ability can explain over 67% of the difference
cognitive function, we designed a quasi-experiment. Quasi- between older adults and younger adults in terms of number
experiments are frequently used to estimate causal relation- of apps used, over 76% of the difference in duration, and 79%
ships in health-related observational studies where random- of the difference in micro-usage breakpoint.
ized controlled studies would otherwise be infeasible, un- Number of apps used. We found that number of apps used
ethical, or impossible [28]. In our case, random assignment varies significantly with the Psychomotor Function/Attention
would be unethical and likely impossible since it would re- composite, but not with Learning/Working Memory compos-
quire recruiting a group of older adults with equal cognitive ite. YCs in Psychomotor Function/Attention use 59.5 apps
ability and then intentionally inducing cognitive decline to on average, while NCs use only 47.9. Compared to older
a random subset of those participants. adults’ overall mean of 50.3 reported earlier, Psychomotor
For our quasi-experiment, we employed a posttest-only Function/Attention can explain over 67% of the difference
nonequivalent control group design [13]. We created two from the 64.0 found for Morrison et al’s younger adults. This
groups. The first group consisted of older adults with the result agrees with findings from psychological literature: we
cognitive ability of a typical younger adult. We denote this hypothesize that number of apps used may be a proxy for
group as YC. To determine which participants to assign to information seeking and curiosity, which has been found to
this group, we relied on normative data provided by Cogstate be strongly linked with attention [25].
on their CBB test, which indicates the scores expected of a
healthy younger adult. We selected all older adults in our App duration. Duration varies significantly with the Learn-
study whose CBB scores are within one standard deviation ing/Working Memory composite, with YCs averaging 96.2
of the normative data, and assign them to the YC group. seconds compared to NCs 122.4. Learning/Working Memory
We then created a matched group, NC, from the remaining can explain over 76% of the difference between the duration
participants, using an almost-exact matching strategy [44], for younger adults, which Morrison et al. found to be 88.6
matching on the age covariate. This is important because age seconds, and older adults overall which we found to be 121.2
is known to be correlated with cognitive decline and, as we seconds. We hypothesize that how long a user keeps an app
demonstrated earlier, app usage patterns. We created these open may be a proxy for processing speed, and prior work
groups for the two different composites mentioned above. has found that working memory influences processing speed
After creating our groups in this way, we had 16 participants and reading fluency [30]. Therefore, we expect that YCs for
per group. this composite would experience this faster usage duration.
Micro-usage breakpoint. The micro-usage breakpoint for YCs
Results in the Learning/Working Memory composite is 7.2 seconds
For each metric reported in the “How Older Adults Use Smart- lower. We did not find a significant difference for the Psy-
phones” section, we report the mean value from our YC and chomotor Function/Attention composite. Compared to our
Paper 168 Page 7CHI 2019 Paper CHI 2019, May 4–9, 2019, Glasgow, Scotland, UK
Learning/Working Memory Psychomotor Function/Attention
Behavior YC mean NC mean Pearson R YC mean NC mean Pearson R
# apps used 47.8 51.0 .038 59.5* 47.9* .256*
App duration (seconds) 96.2** 122.4** -.220* 119.6 116.3 .033
Micro-usage breakpoint (seconds) 22.7*** 29.9*** -.256* 28.5 28.9 .039
Apps per session 2.6 3.1 -.032 3.2 2.9 .095
Messages per day 43.7* 33.8* .143 36.5 37.6 0.070
Calls per day 9.9* 6.4* .189 7.1 7.9 -.092
App switch speed 10.09* 10.74* -.279** 10.56 10.62 -.099
Early morning pct usage 12.54 10.1 0.228* 11.46 10.38 0.27*
Mid morning pct usage 29.56** 26.54** 0.136 27.88 26.98 0.162
Afternoon pct usage 33.44 33.91 -.033 34.77 33.57 -.008
Night pct usage 22.08** 27.12** -0.346** 24.46 26.51 -0.253*
Table 3: Results from our quasi-experiment. Statistically significant results are highlighted in bold. Older adults
who are cognitively young in Learning/Working Memory keep apps open for less time and use their phones earlier
in the morning. Older adults who are cognitively young in Psychomotor Function/Attention use more apps. Mann-
Whitney U test between YC and NC columns is used to test significance (∗ p < 0.05,**p < 0.01,***p < 0.001).
overall older adults micro-usage breakpoint of 27.5 seconds, apps more slowly is due to their mental capacity to retain
as reported earlier, cognitive ability can explain 79% of the the information necessary to complete the tasks, rather than
difference from the 21.4 second breakpoint in younger adults the physical ability to tap the correct areas.
reported by Morrison et al. [36].
Hour of day. Here we analyze the percent of app launches
Categorical/apps breakdown. As in the prior section of this that fall into a given time of day. Daytime sleepiness has
paper, we investigated both duration and percent of total been found to be highly correlated with cognitive ability in
usage in terms of categories. We also analyzed potential dif- older adults [39], and we hypothesized that daytime sleepi-
ferences in specific apps (only the top twenty apps in terms ness may manifest itself as relatively fewer launches during
of total launches were selected). Given there are 20 apps and the morning and daytime versus night. We broke down app
25 categories, each with two dimensions to evaluate them on, usage by time into four components: early morning (5am-
there is not room to list each result. Rather, we chose to list 7am), mid-morning (8am-12pm), afternoon (12pm-5pm), and
none of them, as no significant correlations were found after night (5pm-10pm). Our results appear to confirm this re-
correcting for multiple hypothesis testing (even before cor- lationship, particularly when looking at learning/working
rection, only three significant correlations were found). One memory. While 22.1% of usage takes place at night for YCs,
likely explanation is that as we evaluated granular behaviors 27.1% takes place at night for NCs. Interestingly, this is our
in our relatively small dataset, noise between participants only result in which YCs actually behave less like younger
became too great to statistically overcome. users: earlier, we observed that younger adults tend to use
their phones far more during late night hours than older
Messages. We found that the number of messages varies sig-
adults. Figure 3 shows this difference.
nificantly with Learning/Working Memory, with YCs send-
ing and receiving 10 messages more per day. As mentioned 6 PREDICTING COGNITIVE ABILITY
earlier, we are not aware of comparable data from younger
We designed a novel prediction task of predicting “cogni-
iPhone users. This result is in agreement with psychology
tively young” older adults – predicting whether an older
literature, which has found that social engagement has sig-
adult has the cognitive ability of a typical younger adult.
nificant links with cognitive ability among older adults [7].
To build such a model, we leveraged insights described in
Switching speed. We found that YCs in the Learning/Working previous sections. We demonstrated that despite the large
Memory composite switch apps 2/3 of a second faster than variation inherent to human behavior, and the relatively
NCs. One might expect to also see a difference in the Psy- small sample size in our dataset, we can achieve up to 83%
chomotor Function composite, given that switching apps ROC AUC for learning/working memory. This prediction
quickly likely requires some level of quick physical tapping task is designed to validate our empirical findings, and show
coordination. Surprisingly, we do not see a significant result that the results we report above can be used as generalizable
here, indicating that the likely reason older adults switch features in a predictive model.
Paper 168 Page 8CHI 2019 Paper CHI 2019, May 4–9, 2019, Glasgow, Scotland, UK
Figure 4: Accuracy for predicting cognitively young older
adults in terms of the Learning/Working Memory compos-
Figure 3: Cognitively young older adults launch a larger ite for each feature set. We reach 83% ROC AUC in a com-
percentage of apps in the morning, and cognitively normal bined Gradient Boosted Trees model with all features. For
older adults launch a larger percentage at night. the Psychomotor Function/Attention composite, only one
feature predicted better than random guessing: number of
apps used reached 72% ROC AUC.
Task Description
Based on a user’s app-usage behavior, we predicted whether
that user has the cognitive ability of a typical younger adult (1) Number of apps used: Number of unique apps opened.
or has experienced cognitive decline. We attempt this task (2) App duration: Mean duration across all apps opened.
for both of the CBB composites described in the previous (3) Micro-usage: A user’s micro-usage breakpoint and
section, and using the same normative data described in percent of app launches that are a micro-usage.
the previous section to determine which users fall into the (4) Category-specific: For each category, percent launches
cognitively young or cognitively normal groups. and mean duration of an app use in that category.
(5) App-specific: For each app, percent launches and
Experimental setup mean duration of an app use for that app.
For this classification task, we used the area under the ROC (6) Messages: Mean number of messages per day.
curve (ROC AUC) as our evaluation metric with Leave One (7) Switching speed: Average time taken to switch be-
Out cross-validation for estimation. We experiment with tween apps (switches filtered as described earlier).
L1-normed logistic regression and Gradient Boosted Trees (8) Usage by hour of day: Percent app launches by hour
[42], finding that the latter produced better results. (71% of the day.
vs. 83% ROC AUC). To avoid over-fitting, for models where (9) All: All features combined.
the number of feature vectors exceeds ten, we select the
ten best features using the training set of each Leave-One- Results
Out iteration, calculated from their ANOVA F-values. The Learning/Working Memory. Figure 4 shows the results from
hyper-parameter max tree depth is determined by a 20-fold predicting whether an older adult is cognitively young in
cross-validation using the training set within each LOO itera- terms of learning/working memory. With a Gradient Boosted
tion. As age-corrected normative data were used to compute Trees model that chooses from all available features, we
the CBB composites (i.e., Psychomotor/Attention and Learn- reach 83% ROC AUC. We note that micro-usage breakpoint,
ing/Working Memory), age was not entered as a covariate app switch duration, and usage by time of day result in the
in these analyses. Because of the unbalanced dataset (20.5% highest prediction performance. The combined model out-
of participants were cognitively young) and the trade-off be- performs each of the feature sets individually, suggesting
tween true-and false-positive rate associated with prediction, that together the features complement each other with new
we chose to compare models using the area under the re- information, rather than capturing the same information.
ceiver operating characteristic (ROC) curve (AUC) which is
Psychomotor Function/Attention. Predicting older adults who
equal to the probability that a classifier will rank a randomly
are cognitively young in terms of Psychomotor function /
chosen positive instance higher than a randomly chosen
attention from our app-usage behaviors proved to be sig-
negative one [2]. Thus, a random baseline will score 50%.
nificantly more challenging. We find that only one feature
Models. To illustrate the predictive power of the different produced an accuracy better than random guessing: number
types of app-usage behaviors reported earlier in this paper, of apps used, which produced an accuracy of 72% ROC AUC.
we define a series of models, each with a different feature This is not surprising, as we found few significant results for
set corresponding to one of these app-usage behaviors: this composite in our earlier quasi-experiment, but number
Paper 168 Page 9CHI 2019 Paper CHI 2019, May 4–9, 2019, Glasgow, Scotland, UK
of apps used showed a strong result with cognitively young a sizable number of older adults – those who are cognitively
older adults using 11.6 more apps than cognitively normal young – may be best treated as similar to a younger popula-
older adults. tion for features relating only to cognitive ability. However,
as we see when looking at usage by time of day, older adults
7 DISCUSSION who are cognitively young do not necessarily display signs of
There are several important limitations to our work. The first physical/lifestyle youth, and, in fact, moved in the opposite
stems from our sample size. At 84 participants, our dataset is direction from how younger adults behaved (Table 3).
larger than many papers which discuss app usage patterns There are two important implications of our work. First,
and which connect smartphone usage to psychological or our results suggest that smartphones could be used as passive
behavioral characteristics. However, an even larger dataset preliminary detection tools for cognitive decline by moni-
would enable analysis of more granular behaviors such as toring app usage patterns. This potentially enables alerts
specific app usage patterns and also would have enabled to to loved ones or suggestions that users seek professional
better control for confounders. While we made a strong effort medical advice. Second, prior work has described methods
to account for confounders that seemed most likely to impact to design interfaces while minimizing cognitive load [41].
our results, future work should further investigate these. For Related methods have been used to design smartphone in-
instance, while we remove participants with cognitive im- terfaces intended specifically for older adults [4]. However,
pairment, deafness, blindness, motor impairment disorders, these are likely not equally desirable for all older adults
and depression, there may be potential other medical con- because they can come at the cost of efficiency or utility.
founders that we were unable to consider. A larger and more Our results suggest that smartphones and their apps may be
diverse sample size would also enable further investigation able to dynamically adjust their interfaces to better support
of potential socio-economic confounders. the individual cognitive needs of older adults by passively
Another important limitation is that we did not directly re- detecting cognitive decline.
cruit younger adults to compare older adults with; rather, we
compare our results with prior work published on younger
adults. This resulted in two challenges: first, we were only 8 CONCLUSION
able to compare results for metrics that we replicate from We present a quantitative analysis of the smartphone app
prior work (rather than those we created ourself). Second, usage patterns of older adults. We find that older adults use
while we took care to reproduce the studies we compare fewer apps, keep them open longer, and use their phones
our results to as closely as possible, reproduction always earlier in the day. We also introduce analysis on what we call
opens up the door to potential differences in data collection, “app usage dynamics”, in which we investigate which apps
cleaning, or analysis methods that may influence results. We users switch into and how long it takes them to perform
also note that, by giving users new iPhones 7 installed with the switch. We then design a quasi-experiment to explain
a backup of their existing iPhones, it is possible that some the observed differences between older adults and younger
participants could experience a breaking-in period to adjust adults through cognitive ability, finding that usage patterns
to their new physical devices which could potentially impact of “cognitively young” older adults come close to matching
how they used their phones. those of younger adults for some metrics like number of
The final limitation relates to our quasi-experiment. While apps used, but not others like the times of day they use
quasi-experiments are a common and generally accepted their phones. We then show that the results presented in
method to estimate causal direction in behavioral health our quasi-experiment are sufficiently strong to predict older
research [28], we note that they are still estimates and not adults who are cognitively young with 83% ROC AUC. While
guaranteed to be correct to the same degree a controlled prior work suggests that differences in older adults usage of
randomly-assigned experiment would be. smartphones may be primarily attributable to differences in
Our results underscore prior qualitative results that older culture, values, and lifestyle, we find that for some behaviors,
adults are not a monolithic population. We believe there may differences can be largely explained by cognitive decline.
be opportunities to create accessibility features for smart-
phones that can take in to account the spectrum of cognitive
ability and its impact on usage patterns. We find that while ACKNOWLEDGEMENTS
cognitively young older adults are able to hold more infor- We thank our colleagues at Apple, including Gustav Larsson,
mation and be more expressive in their usage patterns and Nick Foti, Myoung Cha, Brian Kent, Jim Kretlow, Sherry Wu,
choices (1, 3, 4), and therefor have similar engagement pat- Silviana Ciurea-Ilcus, and Younghoon Kim for their contri-
terns when they do use phones, they are still effected by the butions.
physical results of aging (2). Therefore, our results show that
Paper 168 Page 10CHI 2019 Paper CHI 2019, May 4–9, 2019, Glasgow, Scotland, UK
REFERENCES Research and Education on Aging and Technology Enhancement (CRE-
[1] Muna S Al-Razgan, Hend S Al-Khalifa, Mona D Al-Shahrani, and Hes- ATE). Psychology and aging 21, 2 (2006), 333.
sah H AlAjmi. 2012. Touch-based mobile phone interface guidelines [17] Paul Dagum. 2018. Digital biomarkers of cognitive function. npj Digital
and design recommendations for elderly people: A survey of the lit- Medicine 1, 1 (2018), 10.
erature. In International Conference on Neural Information Processing. [18] Ana Correia de Barros, Roxanne Leitão, and Jorge Ribeiro. 2014. Design
Springer, 568–574. and evaluation of a mobile user interface for older adults: navigation,
[2] Tim Althoff and Jure Leskovec. 2015. Donor retention in online crowd- interaction and visual design recommendations. Procedia Computer
funding communities: A case study of donorschoose. org. In Proceed- Science 27 (2014), 369–378.
ings of the 24th international conference on world wide web. International [19] Trinh Minh Tri Do, Jan Blom, and Daniel Gatica-Perez. 2011. Smart-
World Wide Web Conferences Steering Committee, 34–44. phone usage in the wild: a large-scale analysis of applications and
[3] MONICA Anderson and ANDREW Perrin. 2017. Technology use context. In Proceedings of the 13th international conference on multi-
among seniors. Washington, DC: Pew Research Center for Internet & modal interfaces. ACM, 353–360.
Technology (2017). [20] Katayoun Farrahi and Daniel Gatica-Perez. 2008. Daily routine classifi-
[4] Farah Arab, Yasir Malik, and Bessam Abdulrazak. 2013. Evaluation of cation from mobile phone data. In International Workshop on Machine
PhonAge: an adapted smartphone interface for elderly people. In IFIP Learning for Multimodal Interaction. Springer, 173–184.
Conference on Human-Computer Interaction. Springer, 547–554. [21] Denzil Ferreira, Jorge Goncalves, Vassilis Kostakos, Louise Barkhuus,
[5] Ricardo Baeza-Yates, Di Jiang, Fabrizio Silvestri, and Beverly Harrison. and Anind K Dey. 2014. Contextual experience sampling of mobile
2015. Predicting the next app that you are going to use. In Proceedings application micro-usage. In Proceedings of the 16th international con-
of the Eighth ACM International Conference on Web Search and Data ference on Human-computer interaction with mobile devices & services.
Mining. ACM, 285–294. ACM, 91–100.
[6] Yin Bai, Bin Xu, Yuanchao Ma, Guodong Sun, and Yu Zhao. 2012. Will [22] Fluent. 2016. Devices & Demographics 2016.
you have a good sleep tonight?: sleep quality prediction with mobile [23] Jeremy Freese, Salvador Rivas, and Eszter Hargittai. 2006. Cognitive
phone. In Proceedings of the 7th International Conference on Body Area ability and Internet use among older adults. Poetics 34, 4-5 (2006),
Networks. ICST (Institute for Computer Sciences, Social-Informatics 236–249.
and Telecommunications Engineering), 124–130. [24] Andrea Girardello and Florian Michahelles. 2010. AppAware: Which
[7] Shari S Bassuk, Thomas A Glass, and Lisa F Berkman. 1999. Social mobile applications are hot?. In Proceedings of the 12th international
disengagement and incident cognitive decline in community-dwelling conference on Human computer interaction with mobile devices and
elderly persons. Annals of internal medicine 131, 3 (1999), 165–173. services. ACM, 431–434.
[8] Ghassan F Bati and Vivek K Singh. 2018. âĂIJTrust UsâĂİ: Mobile [25] Jacqueline Gottlieb, Pierre-Yves Oudeyer, Manuel Lopes, and Adrien
Phone Use Patterns Can Predict Individual Trust Propensity. In Pro- Baranes. 2013. Information-seeking, curiosity, and attention: compu-
ceedings of the 2018 CHI Conference on Human Factors in Computing tational and neural mechanisms. Trends in cognitive sciences 17, 11
Systems. ACM, 330. (2013), 585–593.
[9] Frank Bentley, Karen Church, Beverly Harrison, Kent Lyons, and [26] Caroline N Harada, Marissa C Natelson Love, and Kristen L Triebel.
Matthew Rafalow. 2015. Three hours a day: understanding cur- 2013. Normal cognitive aging. Clinics in geriatric medicine 29, 4 (2013),
rent teen practices of smartphone application use. arXiv preprint 737–752.
arXiv:1510.05192 (2015). [27] Eszter Hargittai, Anne Marie Piper, and Meredith Ringel Morris. [n.
[10] Matthias Böhmer, Brent Hecht, Johannes Schöning, Antonio Krüger, d.]. From internet access to internet skills: digital inequality among
and Gernot Bauer. 2011. Falling asleep with Angry Birds, Facebook and older adults. Universal Access in the Information Society ([n. d.]), 1–10.
Kindle: a large scale study on mobile application usage. In Proceedings [28] Anthony D Harris, Jessina C McGregor, Eli N Perencevich, Jon P
of the 13th international conference on Human computer interaction with Furuno, Jingkun Zhu, Dan E Peterson, and Joseph Finkelstein. 2006.
mobile devices and services. ACM, 47–56. The use and interpretation of quasi-experimental studies in medical
[11] Jennifer K Carroll, Anne Moorhead, Raymond Bond, William G informatics. Journal of the American Medical Informatics Association
LeBlanc, Robert J Petrella, and Kevin Fiscella. 2017. Who uses mobile 13, 1 (2006), 16–23.
phone health apps and does use matter? A secondary data analytics [29] James J Heckman, Jora Stixrud, and Sergio Urzua. 2006. The effects
approach. Journal of medical Internet research 19, 4 (2017). of cognitive and noncognitive abilities on labor market outcomes and
[12] Gokul Chittaranjan, Jan Blom, and Daniel Gatica-Perez. 2013. Mining social behavior. Journal of Labor economics 24, 3 (2006), 411–482.
large-scale smartphone data for personality studies. Personal and [30] Lisa A Jacobson, Matthew Ryan, Rebecca B Martin, Joshua Ewen,
Ubiquitous Computing 17, 3 (2013), 433–450. Stewart H Mostofsky, Martha B Denckla, and E Mark Mahone. 2011.
[13] Larry B Christensen, Burke Johnson, Lisa Anne Turner, and Larry B Working memory influences processing speed and reading fluency in
Christensen. 2011. Research methods, design, and analysis. (2011). ADHD. Child Neuropsychology 17, 3 (2011), 209–224.
[14] Matthew A Christensen, Laura Bettencourt, Leanne Kaye, Sai T Mo- [31] Bran Knowles and Vicki L Hanson. 2018. The wisdom of older tech-
turu, Kaylin T Nguyen, Jeffrey E Olgin, Mark J Pletcher, and Gre- nology (non) users. Commun. ACM 61, 3 (2018), 72–77.
gory M Marcus. 2016. Direct measurements of smartphone screen- [32] Lenhart, Amanda, Pew Research Center. 2015. âĂIJTeen, Social Media
time: relationships with demographics and sleep. PloS one 11, 11 (2016), and Technology Overview 2015. [Online; accessed 20-September-
e0165331. 2018].
[15] Michael Crabb and Vicki L Hanson. 2016. An analysis of age, technol- [33] Eric Hsueh-Chan Lu, Yi-Wei Lin, and Jing-Bin Ciou. 2014. Mining
ogy usage, and cognitive characteristics within information retrieval mobile application sequential patterns for usage prediction. In Gran-
tasks. ACM Transactions on Accessible Computing (TACCESS) 8, 3 (2016), ular Computing (GrC), 2014 IEEE International Conference on. IEEE,
10. 185–190.
[16] Sara J Czaja, Neil Charness, Arthur D Fisk, Christopher Hertzog, [34] Paul Maruff, Elizabeth Thomas, Lucette Cysique, Bruce Brew, Alex
Sankaran N Nair, Wendy A Rogers, and Joseph Sharit. 2006. Fac- Collie, Peter Snyder, and Robert H Pietrzak. 2009. Validity of the
tors predicting the use of technology: findings from the Center for CogState brief battery: relationship to standardized tests and sensitivity
Paper 168 Page 11CHI 2019 Paper CHI 2019, May 4–9, 2019, Glasgow, Scotland, UK
to cognitive impairment in mild traumatic brain injury, schizophrenia, [46] Neil Selwyn. 2004. The information aged: A qualitative study of older
and AIDS dementia complex. Archives of Clinical Neuropsychology 24, adults’ use of information and communications technology. Journal
2 (2009), 165–178. of Aging studies 18, 4 (2004), 369–384.
[35] Donald McMillan, Alistair Morrison, and Matthew Chalmers. 2013. A [47] Paula Alexandra Silva, Kelly Holden, and Philipp Jordan. 2015. Towards
Comparison of Distribution Channels for Large-Scale Deployments of a list of heuristics to evaluate smartphone apps targeted at older adults:
iOS Applications. In Developments in Technologies for Human-Centric a study with apps that aim at promoting health and well-being. In
Mobile Computing and Applications. IGI Global, 222–239. System Sciences (HICSS), 2015 48th Hawaii International Conference on.
[36] Alistair Morrison, Xiaoyu Xiong, Matthew Higgs, Marek Bell, and IEEE, 3237–3246.
Matthew Chalmers. 2018. A Large-Scale Study of iPhone App Launch [48] Vivek K. Singh and Isha Ghosh. 2017. Inferring Individual Social Capi-
Behaviour. In Proceedings of the 2018 CHI Conference on Human Factors tal Automatically via Phone Logs. Proc. ACM Hum.-Comput. Interact.
in Computing Systems. ACM, 344. 1, CSCW, Article 95 (Dec. 2017), 12 pages. https://doi.org/10.1145/
[37] Elizabeth L Murnane, Saeed Abdullah, Mark Matthews, Matthew Kay, 3134730
Julie A Kientz, Tanzeem Choudhury, Geri Gay, and Dan Cosley. 2016. [49] Amanda L Smith and Barbara S Chaparro. 2015. Smartphone text input
Mobile manifestations of alertness: Connecting biological rhythms method performance, usability, and preference with younger and older
with patterns of smartphone app use. In Proceedings of the 18th Interna- adults. Human factors 57, 6 (2015), 1015–1028.
tional Conference on Human-Computer Interaction with Mobile Devices [50] Cary Stothart, Ainsley Mitchum, and Courtney Yehnert. 2015. The
and Services. ACM, 465–477. attentional cost of receiving a cell phone notification. Journal of ex-
[38] Ofcom. 2018. Adults’ Media Use And Attitudes Report. perimental psychology: human perception and performance 41, 4 (2015),
[39] Maurice M Ohayon and Marie-Françoise Vecchierini. 2002. Daytime 893.
sleepiness and cognitive impairment in the elderly population. Archives [51] Rui Wang, Gabriella Harari, Peilin Hao, Xia Zhou, and Andrew T
of internal medicine 162, 2 (2002), 201–208. Campbell. 2015. SmartGPA: how smartphones can assess and pre-
[40] Katherine E Olson, Marita A OâĂŹBrien, Wendy A Rogers, and Neil dict academic performance of college students. In Proceedings of the
Charness. 2011. Diffusion of technology: frequency of use for younger 2015 ACM international joint conference on pervasive and ubiquitous
and older adults. Ageing international 36, 1 (2011), 123–145. computing. ACM, 295–306.
[41] Sharon Oviatt. 2006. Human-centered design meets cognitive load [52] Rui Wang, Weichen Wang, Alex daSilva, Jeremy F Huckins, William M
theory: designing interfaces that help people think. In Proceedings of Kelley, Todd F Heatherton, and Andrew T Campbell. 2018. Track-
the 14th ACM international conference on Multimedia. ACM, 871–880. ing Depression Dynamics in College Students Using Mobile Phone
[42] F. Pedregosa, G. Varoquaux, A. Gramfort, V. Michel, B. Thirion, O. and Wearable Sensing. Proceedings of the ACM on Interactive, Mobile,
Grisel, M. Blondel, P. Prettenhofer, R. Weiss, V. Dubourg, J. Vanderplas, Wearable and Ubiquitous Technologies 2, 1 (2018), 43.
A. Passos, D. Cournapeau, M. Brucher, M. Perrot, and E. Duchesnay. [53] Weinan Wang and Osmar R Zaïane. 2002. Clustering web sessions
2011. Scikit-learn: Machine Learning in Python. Journal of Machine by sequence alignment. In Database and Expert Systems Applications,
Learning Research 12 (2011), 2825–2830. 2002. Proceedings. 13th International Workshop on. IEEE, 394–398.
[43] Ahmad Rahmati, Chad Tossell, Clayton Shepard, Philip Kortum, and [54] Henry H Wilmer, Lauren E Sherman, and Jason M Chein. 2017. Smart-
Lin Zhong. 2012. Exploring iPhone usage: the influence of socioeco- phones and cognition: A review of research exploring the links be-
nomic differences on smartphone adoption, usage and usability. In tween mobile technology habits and cognitive functioning. Frontiers
Proceedings of the 14th international conference on Human-computer in psychology 8 (2017), 605.
interaction with mobile devices and services. ACM, 11–20. [55] Ides Y Wong, Simon S Smith, and Karen A Sullivan. 2012. The relation-
[44] Paul R Rosenbaum. 2002. Observational studies. In Observational ship between cognitive ability, insight and self-regulatory behaviors:
studies. Springer, 1–17. Findings from the older driver population. Accident Analysis & Pre-
[45] Lena Rosenberg, Anders Kottorp, Bengt Winblad, and Louise Nygård. vention 49 (2012), 316–321.
2009. Perceived difficulty in everyday technology use among older [56] Sha Zhao, Julian Ramos, Jianrong Tao, Ziwen Jiang, Shijian Li, Zhaohui
adults with or without cognitive deficits. Scandinavian journal of Wu, Gang Pan, and Anind K Dey. 2016. Discovering different kinds
occupational therapy 16, 4 (2009), 216–226. of smartphone users through their application usage behaviors. In
Proceedings of the 2016 ACM International Joint Conference on Pervasive
and Ubiquitous Computing. ACM, 498–509.
Paper 168 Page 12You can also read