Assembly District 40 - The Education Gap in Los Angeles County Where Does Your District Fall?
←
→
Page content transcription
If your browser does not render page correctly, please read the page content below
Assembly District 40

     The Education Gap
   in Los Angeles County
Where Does Your District Fall?

                 UCLA/IDEA
     INSTITUTE FOR DEMOCRACY, EDUCATION, AND ACCESS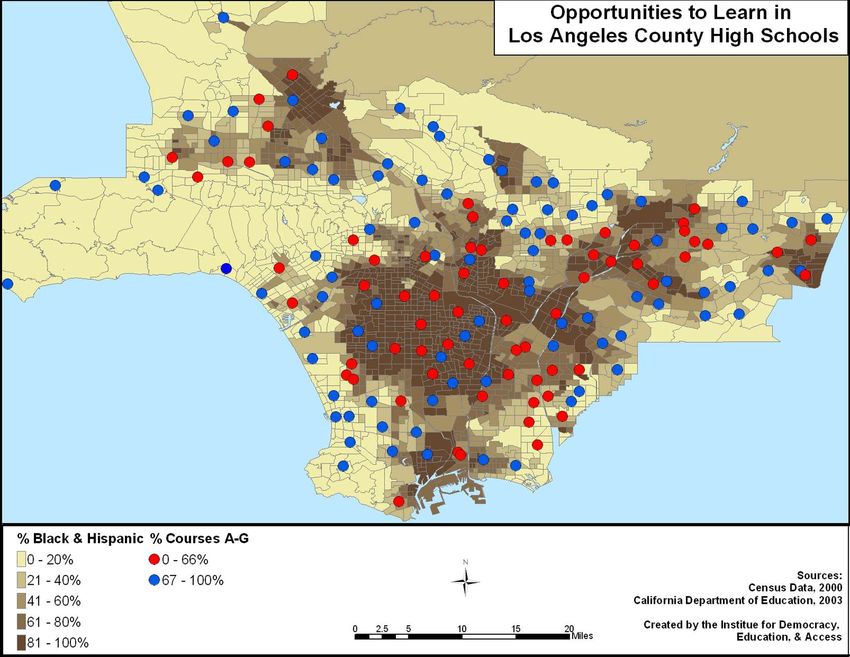
On the Cover:
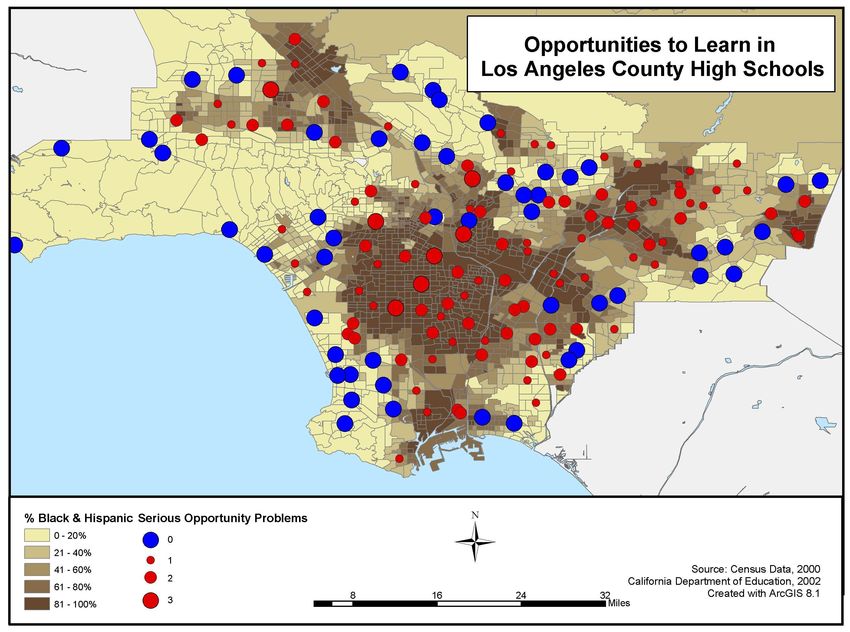
Educational Opportunity Gaps in Los Angeles County
The map on the cover displays the gaps in educational opportunities in Los Angeles County. The
background color on the map shows the racial composition of the county’s neighborhoods, with the
darker shades indicating larger percentages of African American and Latino residents. The dots on
the map represent the county’s comprehensive high schools. The schools represented by red dots are
those that suffer from such severe problems as serious shortages of qualified teachers (more than 20%
not certified by the state), overcrowded facilities that house twice as many students as the state
recommends, and too few courses to allow all students to complete the bare minimum requirements
for CSU or UC. The larger the red dot, the more of these problems the high school has. The schools
represented by blue dots have none of these problems. The map shows clearly that high schools
located in predominantly African American and Latino communities have far more of these severe
educational problems than high schools in communities where the residents are predominantly white.
Published in 2004 by
UCLA/IDEA
Institute for Democracy Education and Access (IDEA)
1041 Moore Hall
UCLA
Los Angeles, CA 90095
IDEA welcomes your comments and suggestions for how to make reports like this one more useful to you and your
staff as you go about the important task of leading California into the future. We will be happy to meet with you or
your staff to discuss anything in this report, or anything related to providing greater educational opportunity for the
students of California. For further information please contact Michelle Renée at :
www.ucla-idea.org, or 310-267-4412.Educational Opportunities and Outcomes in Your Legislative District
This report provides the best available information on the educational opportunities and
outcomes for K-12 students in your legislative district. It provides statistics about the public schools
in your district, about schools statewide, and about schools in the state’s “basic aid”1 school districts.
Each chart allows you to compare your district’s schools to those in the state as a whole and to
those in school districts with the most resources. The appendices to this report provide detailed
data about each of the public schools in the communities you represent.
Most Californians have heard about and are disturbed by gaps in achievement test scores,
high school graduation, and college preparation. However, many are unaware of the presence and
seriousness of clear gaps in schooling opportunities. The data we provide here reveal achievement
gaps, high school graduation gaps, college preparation gaps, and basic opportunity gaps between
students in your district and those in California’s most advantaged communities. Taken together
the data also show that these gaps are closely linked. Students in Los Angeles schools with fewer
resources and opportunities learn less; they are less likely to graduate from high school; and those
who do graduate are less likely to be prepared for college.
This report was prepared by UCLA’s Institute for Democracy, Education and Access (IDEA).2
IDEA is committed to providing the government and public with solid information that will help
the state ensure that all California students receive high quality schooling. This particular report
follows up on findings from IDEA’s recent study, “Separate and Unequal 50 Years After Brown:
California’s Racial Opportunity Gap” that was presented to the legislature education committees
in June, 2004.3 That study found many California schools to be extraordinarily deficient in the
most basic educational conditions and opportunities. It also found that in Los Angeles County,
nearly a quarter of majority white schools and 60 percent of schools with African American and
Latino student bodies lack qualified teachers, appropriate instructional materials, and uncrowded
facilities. IDEA prepared this new report to help you and the other legislators from Los Angeles
County better understand the extent to which California’s educational gaps affect your district
specifically.
Which side of the achievement gap is your district on?
As a central component of California’s accountability system, the Academic Performance
Index (API) reports educational outcomes—how well students perform on a standardized test of
learning. Comparing the API scores across California reveals significant gaps in educational
achievement.
1 “Basic aid” school districts are those with sufficient local revenues that they receive only a basic supplement from
the state and do not share in the reallocation of funds mandated by the Serrano v. Priest decision.
2 IDEA researchers Eileen Horng, Michelle Renee, David Silver, and Joanna Goode contributed to this report.
3 “Separate and Unequal 50 Years After Brown: California’s Racial Opportunity Gap,”
http://www.idea.gseis.ucla.edu/publications/idea/index.htmlLegislative District California Basic Aid Districts
Average API
900
809.00
800
714.00 717.00
700
600
500
400
300
200
100
0
Average API
Source: California Basic Educational Data System (CBEDS), 2002-2003.
Which side of the high school graduation and college preparation gaps is your district on?
How well are schools in your district helping students prepare for college or for a competitive
job? Are students graduating from high school? Are they completing the coursework necessary
for them to even apply for admission to a CSU or UC campus? The College Opportunity Ratio
(COR), shown in the chart below, measures how well high schools are doing in helping students
earn a diploma and graduate from high school ready for college. California’s statewide COR for
2002 was 100:69:27. This means that for every 100 9th graders in 1998, 69 students received a high
school diploma four years later, and 27 graduates passed the courses required for admission to CSU
and UC with at least a C grade. In contrast, for every 100 9th graders in the Basic Aid school
districts, 76 received diplomas four years later and 42 completed the courses that CSU and UC
require. Here is how your district stacks up:Legislative District California Basic Aid Districts
College Opportunity Ratio (COR)
100.00 100.00 100.00
100
90
80 76.00
69.00
70
58.00
60
50 42.00
40
30 27.00
25.00
20
10
0
9th Graders High School Graduates College-Ready High School
Fall 1998 Spring 2002 Graduates Spring 2002
Source: CBEDS 1998; 2002
It’s not just demographics.
What makes some schools’ outcomes so different from others? A major reason for these
gaps is the gap in educational opportunities. Some schools offer more of the basic tools for learning,
and students at these higher-resource schools show, on average, higher achievement, higher rates
of high school graduation, and higher rates of college preparation. Some people claim incorrectly
that these differences are only reflections of differences among students—e.g., their community’s
wealth and their family background. But the data demonstrate huge differences in schooling
opportunities that impact learning.
One might expect that California would provide students who face the most challenges with
equal or even better learning resources in order to narrow the gaps in achievement and college
preparation. But the opposite is true. The charts below show that schools with more low-income
students and students of color have less of the basics for learning. Student achievement, as measured
by test scores, is correlated with—not caused by—student demographics. The next graph describes
the student demographics of your district. The section that follows describes some the educational
opportunity problems your students face at all levels of the K-12 system.Legislative District California Basic Aid Districts
70 66.00
Student Demographics
69.70
60
54.10
48.80
50
40
30 24.60
19.40
20
10
0
% of students that receive free/reduced lunch % of students that are underrepresented minorities
Source: CBEDS, 2002-2003
Which side of the opportunity gap is your district on?
The state collects very little data about the conditions and resources in schools. We present
what is available in the charts below. The first provides data about teacher shortages and overcrowding
in elementary, middle, and junior high schools. The second graph provides these same indicators
for high schools.
Legislative District California Basic Aid Districts
Educational Opportunities
Elementary, Middle, Junior High School
30
27.10
25
20 18.50
15 13.20
12.20
11.20 11.40
10.00
10
4.70
5
0.0
0
% of teachers that are less-than-fully % of teachers in their first or % schools that are critically overcrowded
certified second year of teaching
Source: CBEDS, 2002-2003Legislative District California Basic Aid Districts
Educational Opportunities
High School 44.40
45
40
35
30
25 22.60
20
15.10
13.80
15 13.00 12.50
9.50
10 8.60
5
0.0
0
% of teachers that are less-than-fully % of teachers in their first or % schools that are critically overcrowded
certified second year of teaching
Source: CBEDS, 2002-2003
The opportunities measured by these three indicators are significant. Research documents
that teacher quality is critical to how much students learn. The first indicator shows the percentage
of teachers who are not fully certified by the State. Though a credential does not guarantee that
a teacher is of high quality, a credential is a standard used by the state to ensure that every teacher
has the minimum qualifications to teach. In only 9 of the 40 legislative districts with schools in
Los Angeles County does the percentage of certified elementary and middle school teachers reach
or exceed the percentage of certified teachers in the state, and none has as high a percentage of
crendentialed teachers as the basic aid districts. In only 5 of the legislative districts does the
percentage of certified high school teachers reach or exceed the percentage in the state as a whole;
only 2 of the 40 districts have a higher percentage than the basic aid districts. Notably, these 2
districts—Senate District 19 and Assembly District 37—include only 2 LA County high schools
each.
Teacher experience also affects achievement. Teachers, like other professionals, continue to
acquire skills and improve their practice over time. The second indicator on the chart above, the
percentage of teachers in your district who have only taught for one or two years, reveals how many
teachers have not had the time or experience to hone their skills. Additionally, when there are large
numbers of new teachers in a school, it is likely that the school suffers from high rates of teacher
turnover that disrupt the stability of the school and continuity of instruction. In general, students
in lower income communities are much more likely to have uncertified or inexperienced teachers.The third indicator shows the percentage of schools that are “critically overcrowded.” This
means that the school has more than twice as many students as it should. Overcrowding affects all
aspects of student learning. Statewide data demonstrate that it is low-income students of color –
particularly in LAUSD – who are consigned to the most overcrowded schools. Notice that while
8.6% of high schools across the state are critically overcrowded, there are no critically overcrowded
schools in basic aid districts.
Notably, these indicators of educational opportunity are interrelated. Teachers with credentials
and more experience often choose to teach in schools with better working conditions (for example,
with less overcrowding). As a result, the problems compound one other.
Moreover, there are great disparities in how much we spend on the one ingredient of a
quality education that matters most, the classroom teacher. As the chart below shows, California
spends about $2,500 per student on teachers’ salaries. In only 4 of the 40 districts (all Assembly
districts) does the amount spent per student on teacher salaries exceed the statewide per pupil
expenditures by more than $100, and the highest district spends only $177 more. At the same
time, the spending per pupil in 9 of the 40 Los Angeles County legislative districts falls more than
$100 per student below the statewide per pupil expenditures. In stark contrast, the basic aid
districts spend 37.5% more on teachers’ salaries per student. That’s $883.52 more per student than
the state spends per student.
Legislative District California Basic Aid Districts
Per Pupil Expenditures for Teachers’ Salaries
3500 $3236.91
3000
2500 $2353.39
$2218.13
2000
1500
1000
500
0
Per Pupil Expenditure for Teachers' Salaries
4
Source: CBEDS, 2002-2003; district teacher salary schedules.
4 Salary data is available for 2290 schools across the state.Finally, schools differ in the curriculum that they provide to students, with some schools
providing far more challenging learning opportunities than others. At the high school level, such
differences in class offerings can affect students’ achievement and also determine whether or not
students will graduate from high school prepared for college. To satisfy the CSU and UC eligibility
requirements, for example, a high school student must take 15 courses (about 2/3rds of all his or her
high school classes) that have been approved by the universities as “college preparatory.” That
means that a school must make sure that at least 2/3rds of a school’s classes have been approved by
CSU and UC, if it wants to give all of its students a chance to prepare for college.
The map below shows that many schools in Los Angeles County have a weak college
preparatory curriculum. The dots on the map represent the county’s comprehensive high schools.
The schools represented by white dots are those where less than 2/3rds of the classes help students
prepare for college. Schools represented by black dots are those where at least 2/3rds of the classes
are approved college preparatory courses. The background shade on the map shows the racial
composition of the county’s neighborhoods, with the darker shades indicating larger percentages
of African American and Latino residents. The map shows clearly that high schools located in
predominantly African American and Latino communities tend to have weaker college preparation
opportunities.The Bottom Line
By going beyond test scores, the information in this report presents a very different picture
of California’s educational gaps. It shows that California students suffer from severe opportunity
gaps as well as achievement gaps. Unfortunately, California collects very little information about
the opportunities the state and local school districts provide to students. There is no measure of
how many schools have the textbooks or science equipment they need, no measure of how many
classrooms are in disrepair, no measure of how safe school campuses are, and no measure of how
many students are in overcrowded classrooms.5 Considering the enormous taxpayer investment
in schools each year, this lack of information reveals that the state also has a serious accountability
gap.
In this report we only look at your district as a whole, but there are often great disparities
between schools within the same district. In particular, the opportunity gaps for low-income
children and children of color are even greater when we look at school-by-school comparisons.
The appendices that follow provide more detailed information about how each of the schools in
your district scores on several measures that can help you assess the extent of your district’s gaps.
The bottom line is that there are likely to be thousands of students and families in your legislative
district who are deprived of an adequate education.
Additional Information
The appendices that follow provide you with information about the individual schools in your district.
6
• Appendix A: College Opportunity Ratio Maps.
The first map displays the COR for all students in each high school in your district. The next map(s) show the COR
for students from racial/ethnic groups that are underrepresented and well represented at the University of California
for each high school in the Legislative district.
The background coloring on the map also shows the relationship between a high school’s COR and the wealth of its
surrounding community. Generally, schools in higher wealth communities prepare more 9th graders for college, but
the COR for underrepresented students of color at such schools is much lower than the COR for white and Asian
American students.
• Appendix B: School Specific demographics, education opportunities and outcomes.
In this table, the different indicators explained earlier in the report are listed individually for each school in your district.
An empty cell indicates that data was not available.
5 For a recent comprehensive report on problems in California public schools, see the “Report on the Status of Public
School Education in California” on the website of the William and Flora Hewlett Foundation, www.hewlett.org.
6 The College Opportunity Ratio was developed by UC ACCORD. Maps showing the CORs for high schools in
each California legislative district are available on the UC ACCORD website www.ucaccord.org2002 College Opportunity Ratio (COR)
Total Students Assembly District 40
Lloyd E. Levine
Monroe
100:50:21 College-Ready:
Graduates completing courses
required for CSU and UC
admissions with a grade of
Cleveland C or better.
100:63:36
COR
Van Nuys
9th Graders Fall 1998
Canoga Park 100:48:20
Birmingham
100:41:12 Reseda 100:52:12
Graduates Spring 2002
100:56:16 College-Ready Graduates
El Camino Real Median Household Income
100:70:37
$0 - 35,446
Sherman Oaks
$35,447 - 53,843
100:83:44
$53,844 - 76,046
$76,047 - 111,765
$111,766 - 200,001
0 1 2
Miles
Data Source: California Department of Education and Census 2000
Created by UC/ACCORD
College Opportunity Ratio (COR):
# 9th graders___: # Graduates four years later___: # College-ready graduates ___2002 College Opportunity Ratio (COR)
Underrepresented Assembly District 40
Lloyd E. Levine
Monroe
Cleveland 100:46:16
100:52:19 Underrepresented:
Students from groups with low
UC participation - -
Canoga Park African American, Latino,
100:36:8 Reseda
and American Indian
100:49:9
College-Ready:
El Camino Real Graduates completing courses
Birmingham Van Nuys required for CSU and UC
100:58:16
Sherman Oaks 100:47:7 100:37:9 admissions with a grade of
100:77:26 C or better.
COR
White and Asian American 9th Graders Fall 1998
Monroe Graduates Spring 2002
100:72:51
College-Ready Graduates
Cleveland
100:84:70 Median Household Income
Van Nuys $0 - 35,446
Canoga Park 100:68:41 $35,447 - 53,843
Reseda
100:65:29
El Camino Real 100:74:35 $53,844 - 76,046
100:76:47
$76,047 - 111,765
Birmingham
Sherman Oaks $111,766 - 200,001
100:64:23
100:89:59
0 1 2
Data Source: California Department of Education and Census 2000
Created by UC/ACCORD Miles
College Opportunity Ratio (COR):
# 9th graders___: # Graduates four years later___: # College-ready graduates ___Assembly District 40
Appendix B - School Specific Data
The following table demonstrates how each of the schools in your district is faring in terms of educational opportunities and outcomes.
Achievement and Attainment Student Demographics Educational Opportunities
__________________________ __________________________ _________________________________________________________________________
School API COR (HS % students % students % teachers % teachers in $ spent per pupil Critically % courses A-
only) receiving f/r URM less-than-fully first/second on teachers’ overcrowded G approved
lunch certified year salaries (Y/N) (HS only)
Anatola Avenue Elementary 688 n/a 73 73.12 17.86 17.86 2,625.77 N n/a
Andasol Avenue Elementary 839 n/a 35 36.13 7.14 10.71 2,520.18 N n/a
Balboa Gifted/High Ability Magnet Elementary 978 n/a 27 23.85 0.00 3.33 2,362.22 N n/a
Bassett Street Elementary 682 n/a 94 94.44 25.00 16.18 2,423.00 Y n/a
Bertrand Avenue Elementary 678 n/a 94 89.31 14.81 7.41 2,875.67 N n/a
Birmingham Senior High 603 100:52:12 57 71.30 26.06 19.01 1,903.28 N 65.95
Blythe Street Elementary 664 n/a 85 81.58 17.86 3.57 2,468.24 N n/a
Calahan Street Elementary 793 n/a 51 46.32 4.17 4.17 2,575.78 N n/a
Canoga Park Elementary 630 n/a 89 93.00 19.44 22.22 2,616.35 Y n/a
Canoga Park Senior High 576 100:41:12 69 82.02 21.78 8.91 2,118.50 Y 59.63
Cantara Street Elementary 725 n/a 89 86.97 12.20 9.76 2,707.97 N n/a
Capistrano Avenue Elementary 753 n/a 61 60.23 23.08 11.54 2,947.38 N n/a
CHIME Charter 638 n/a 0 40.38 16.67 33.33 N n/a
Cleveland (Grover) High 637 100:63:36 65 62.51 20.93 18.60 1,793.78 N 75.00
Cohasset Street Elementary 693 n/a 93 90.08 13.04 8.70 2,635.82 Y n/a
Columbus (Christopher) Middle n/a 73 73.66 15.00 11.67 1,977.56 N n/a
Columbus Avenue School 649 n/a 98 92.60 32.14 42.86 N n/a
Dearborn Street Elementary 724 n/a 50 52.26 18.75 12.50 2,720.62 N n/a
El Camino Real Senior High 748 100:70:37 24 34.53 15.67 14.18 1,692.33 Y 68.35
Fullbright Avenue Elementary 703 n/a 89 82.15 12.50 15.63 2,504.36 N n/a
Fulton (Robert) Middle 563 n/a 83 90.63 37.37 15.15 1,990.58 Y n/a
Garden Grove Elementary 762 n/a 85 78.13 20.69 10.34 2,928.65 N n/a
Gault Street Elementary 684 n/a 85 87.25 20.00 13.33 2,902.29 N n/a
Gledhill Street Elementary 744 n/a 80 75.64 11.36 0.00 2,887.13 N n/a
Hale (George Ellery) Middle 745 n/a 32 38.99 13.33 17.78 1,679.68 Y n/a
Hamlin Street Elementary 774 n/a 58 55.37 20.83 8.33 2,930.63 N n/a
Hart Street Elementary 693 n/a 89 93.38 9.26 7.41 2,737.42 Y n/a
Haynes Elementary 834 n/a 31 38.10 5.88 11.76 2,364.34 N n/a
Hazeltine Avenue Elementary 655 n/a 92 89.54 16.44 17.81 2,492.55 Y n/a
Holmes (Oliver Wendell) Middle 710 n/a 58 64.68 15.87 11.11 1,905.56 N n/a
Justice Street Elementary 861 n/a 25 22.07 3.85 3.85 2,727.20 N n/a
Kindergarten Learning Academy n/a 90 95.44 35.71 35.71 Y n/a
Lemay Street Elementary 769 n/a 84 85.06 19.05 23.81 2,990.68 N n/a
Limerick Avenue Elementary 667 n/a 83 80.80 20.00 10.00 2,472.53 Y n/a
Lockhurst Drive Elementary 796 n/a 27 35.42 6.45 9.68 2,907.24 N n/a
Lorne Street Elementary 782 n/a 51 53.33 5.56 2.78 2,527.66 N n/aAssembly District 40
Achievement and Attainment Student Demographics Educational Opportunities
__________________________ __________________________ _________________________________________________________________________
School API COR (HS % students % students % teachers % teachers in $ spent per pupil Critically % courses A-
only) receiving f/r URM less-than-fully first/second on teachers’ overcrowded G approved
lunch certified year salaries (Y/N) (HS only)
Magnolia Science Academy 636 n/a 0 75.00 71.43 64.29 N n/a
Mayall Street Elementary 760 n/a 63 53.86 10.71 7.14 2,900.67 N n/a
Melvin Avenue Elementary 745 n/a 69 65.40 26.32 13.16 2,829.36 N n/a
Monroe (James) High 561 100:50:21 69 85.32 26.50 15.00 1,833.75 Y 62.34
Mulholland (William) Middle 589 n/a 80 81.58 31.46 22.47 2,310.11 N n/a
Multicultural Learning Center 589 n/a 80 91.59 50.00 33.33 N n/a
Napa Street Elementary 583 n/a 90 95.65 26.19 2.38 2,619.62 Y n/a
Newcastle Elementary 696 n/a 88 82.27 42.31 26.92 N n/a
Northridge Middle 594 n/a 79 85.30 22.95 24.59 2,136.13 N n/a
Parthenia Street Elementary 700 n/a 100 91.27 12.77 4.26 2,545.54 Y n/a
Pomelo Drive Elementary 875 n/a 9 17.60 4.88 2.44 2,525.02 N n/a
Porter (George K.) Middle 720 n/a 44 63.82 17.65 7.35 1,998.21 N n/a
Reseda Elementary 760 n/a 87 81.59 10.71 7.14 2,631.63 N n/a
Reseda Senior High 607 100:56:16 62 71.35 20.39 13.59 1,942.18 N 62.58
Sherman Oaks Ctr. for Enriched Studes 802 100:83:44 38 44.46 20.29 17.39 N 53.40
Shirley Avenue Elementary 782 n/a 76 82.71 23.81 21.43 2,601.70 N n/a
Stagg Street Elementary 730 n/a 75 74.35 24.00 20.00 2,683.63 N n/a
Sunny Brae Avenue Elementary 656 n/a 82 88.00 10.20 6.12 2,678.44 Y n/a
Sutter (John A.) Middle 616 n/a 79 79.83 22.06 10.29 2,085.89 N n/a
Sylvan Park Elementary 650 n/a 93 95.46 14.06 1.56 2,642.12 Y n/a
Topeka Drive Elementary 819 n/a 24 29.70 16.67 10.00 2,688.43 N n/a
Tulsa Street Elementary 784 n/a 69 63.99 11.76 11.76 2,842.66 N n/a
Valerio Primary Center 773 n/a 88 91.19 13.64 18.18 Y n/a
Valerio Street Elementary 676 n/a 91 91.01 20.83 8.33 2,646.85 Y n/a
Valley Community Charter 656 n/a 37 61.43 72.73 27.27 N n/a
Van Nuys Elementary 651 n/a 92 96.41 16.67 29.17 2,592.44 Y n/a
Van Nuys Senior High 613 100:48:20 65 65.69 29.63 14.07 1,627.07 Y 70.05
Vanalden Avenue Elementary 776 n/a 81 65.48 10.00 3.33 2,514.59 N n/a
Vintage Street Fundamental 844 57 50.83 5.88 11.76 2,207.37 N
Welby Way Elementary 919 n/a 14 19.21 15.00 15.00 2,435.16 N n/a
Winnetka Avenue Elementary 723 n/a 84 70.19 19.44 8.33 2,855.43 N n/a
Woodlake Avenue Elementary 823 n/a 16 22.45 9.09 12.12 2,271.24 N n/aYou can also read