Assessing the Impact of COVID-19 Public Health Stages on Paediatric Emergency Attendance
←
→
Page content transcription
If your browser does not render page correctly, please read the page content below
International Journal of
           Environmental Research
           and Public Health

Article
Assessing the Impact of COVID-19 Public Health
Stages on Paediatric Emergency Attendance
Thérèse McDonnell 1, * , Emma Nicholson 1 , Ciara Conlon 1 , Michael Barrett 2,3,4 ,
Fergal Cummins 5 , Conor Hensey 6 and Eilish McAuliffe 1
 1    Centre for Interdisciplinary Research Education and Innovation in Health Systems, UCD School of Nursing,
      Midwifery & Health Systems, University College Dublin, D04 C7X2 Dublin, Ireland;
      emma.nicholson@ucd.ie (E.N.); ciara.conlon@ucd.ie (C.C.); Eilish.McAuliffe@ucd.ie (E.M.)
 2    Children’s Health Ireland at Crumlin, D12 N512 Dublin, Ireland; Michael.Barrett@olchc.ie
 3    Women’s and Children’s Health, School of Medicine, University College Dublin, D04 C7X2 Dublin, Ireland
 4    National Children’s Research Centre, D12 N512 Dublin, Ireland
 5    REDSPOT (Retrieval, Emergency and Disaster Medicine Research and Development),
      Emergency Department, Limerick University Hospital, V94 F858 Limerick, Ireland; Fergal.Cummins@hse.ie
 6    Children’s Health Ireland at Temple Street, D01 XD99 Dublin, Ireland; Conor.hensey@cuh.ie
 *    Correspondence: therese.mcdonnell@ucd.ie; Tel.: +353-1-716-6689

 Received: 10 August 2020; Accepted: 10 September 2020; Published: 15 September 2020

 Abstract: This study outlines the impact of COVID-19 on paediatric emergency department (ED)
 utilisation and assesses the extent of healthcare avoidance during each stage of the public health
 response strategy. Records from five EDs and one urgent care centre in Ireland, representing
 approximately 48% of national annual public paediatric ED attendances, are analysed to determine
 changes in characteristics of attendance during the three month period following the first reported
 COVID-19 case in Ireland, with reference to specific national public health stages. ED attendance
 reduced by 27–62% across all categories of diagnosis in the Delay phase and remained significantly
 below prior year levels as the country began Phase One of Reopening, with an incident rate ratio
 (IRR) of 0.58. The decrease was predominantly attributable to reduced attendance for injury and
 viral/viral induced conditions resulting from changed living conditions imposed by the public health
 response. However, attendance for complex chronic conditions also reduced and had yet to return to
 pre-COVID levels as reopening began. Attendances referred by general practitioners (GPs) dropped by
 13 percentage points in the Delay phase and remained at that level. While changes in living conditions
 explain much of the decrease in overall attendance and in GP referrals, reduced attendance for complex
 chronic conditions may indicate avoidance behaviour and continued surveillance is necessary.

 Keywords: COVID-19; paediatric; public health; emergency medicine; delayed attendance; avoidance

1. Introduction
     On 11th March 2020, a global pandemic was declared by the World Health Organisation (WHO)
due to the outbreak of a novel coronavirus (SARS-CoV-2) or COVID-19. Despite public health appeals
to reassure the public that it was safe to access health services, significant changes in emergency
department (ED) utilization patterns have been observed [1–5].
     Using national health authority administration data, two studies from Ireland and Portugal show
a reduction in the proportion of all patients presenting at ED across all acuity presentations [1,6].
Factors contributing to lower utilization of health services include public health emergency directed
population restrictive measures (e.g., halted travel/sports and closed schools/childcare facilities) [7].
Shifts in health-seeking behaviours also contribute, with an unwillingness to access healthcare driven

Int. J. Environ. Res. Public Health 2020, 17, 6719; doi:10.3390/ijerph17186719     www.mdpi.com/journal/ijerph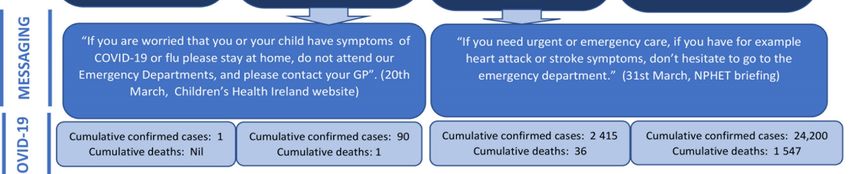
Int. J. Environ. Res. Public Health 2020, 17, 6719 2 of 24
by concerns about contagion in hospital settings [8,9]. Evidence from SARS and MERS epidemics have
shown that risk preventative behaviours, such as hospital avoidance, were widely practised, with fear
of infection associated with avoidance of healthcare facilities [10–14]. Of concern was an increase in
cases triaged ‘very urgent/immediate’ among those admitted; however, without presenting complaint
or diagnosis, this finding is difficult to interpret [1,6]. Delayed presentations and restricted access
to health care has worrying implications (excess morbidity and mortality), particularly for children
with serious or chronic conditions or protection concerns [9,15]. Delayed diagnosis and treatment for
complex chronic conditions may result in rapid deterioration in the health of a child and can have fatal
consequences [9]. To the best of our knowledge no study tracks the nature of attendance by children
throughout the course of the public health response to the virus.
The aim of this paper is to assess how the nature of paediatric attendance at the ED altered
throughout each of the COVID-19 related public health emergency stages, from the first confirmed case.
2. Materials and Methods
2.1. Data
A national database of paediatric emergency department (ED) attendance which would facilitate
year on year detailed analysis was not available. With the assistance of on-site system managers,
anonymised clinical and demographic data were extracted from the electronic patient records of all
children aged under 16 attending three paediatric EDs and an urgent care centre (UCC) in Dublin
(referred to as Dublin), and two mixed adult/paediatric EDs located in regional cities (Regional),
Limerick and Cork. Approximately 28% of the Irish population live in Dublin, which has three
dedicated public paediatric emergency departments and one paediatric UCC. County Cork has a
population of approximately 540,000, representing 11% of the national population, while County
Limerick has a population of approximately 200,000, representing 4% of the national population.
The proportion of the population aged under 16 is comparable in the Cork and Limerick areas,
and approximately 2% higher for the greater Dublin Area [16]. All three Dublin hospitals and the
UCC are easily accessed by a large local population, both by car and public transport. However, the
population served by the Regional hospitals is more dispersed, with many patients having a longer
commute to the ED and more limited public transport options. This is reflected in the proportion of ED
visits referred by general practitioners (GPs), with more patients attending a GP prior to visiting the
Regional EDs. Medical card status provides us with some information on the socio-economic status of
the areas served by each of the participating hospitals. Medical card ownership, which entitles access to
health services at no charge and is granted primarily to those on low incomes [17], is above the national
average in the areas served by the ED located in Limerick, though below the national average in areas
served by the Cork ED. While the Dublin hospitals serve a diverse population and the mix of patients
attending each hospital varies in terms of disadvantage, on average the population in areas served
by these hospitals has a medical card ownership rate below the national average [16,17]. These five
hospitals and the UCC represent approximately 48% of the national annual census of paediatric
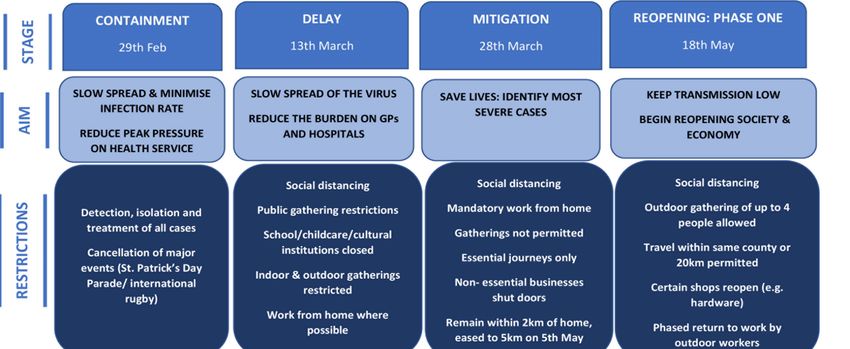
(under 16 years) ED attendances [18]. Appendix A illustrates the location of each participating site.
Data included date/time, gender, month and year of birth, linked episodes of care, mode of
arrival, source of referral, presenting complaint, triage score, disposition (for all) and diagnosis
(Dublin hospitals and UCC only). All EDs utilised a five-point triage scale (1 = life threatening to
5 = non-urgent).
The COVID-19 emergency public health stages (Figure 1) were directed by the Irish National
Public Health Emergency Team (NPHET). The first COVID-19 case in Ireland was seen on 29th February
2020 and this analysis refers to the period in 2020 prior to this case as Pre-COVID. The Containment
phase, the period from the first reported case to the closure of schools on 12th March, involved the
identification and containment of all cases of COVID-19. The Delay phase focused on creating health
system capacity through the cancellation of elective procedures and minimising the spread of the virus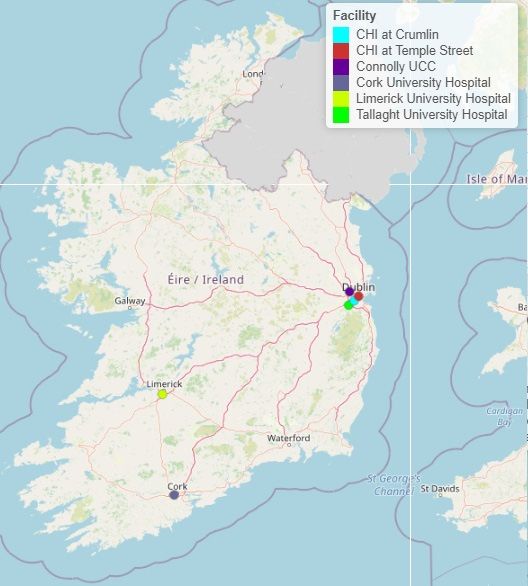
Int. J. Environ. Res. Public Health 2020, 17, 6719                                             3 of 24

through social distancing, school and childcare facility closures, and advice to work from home where
possible. Ireland introduced mandatory stay-at-home measures on 28th March, entering a seven-week
Mitigation phase. One of the study hospitals in Dublin transferred out all its paediatric services to
another location (including redirecting all paediatric ED patients to the two paediatric EDs and the
UCC in Dublin) on this date to safely maximise capacity for adult COVID-19 patients at the co-located
adult hospital. The country began the first stage of a five-stage reopening on 18th May.
Int. J. Environ. Res. Public Health 2020, 17, 6719                                                                                    4 of 24
         Int. J. Environ. Res. Public Health 2020, 17, x FOR PEER REVIEW                                                   4 of 25

                                                                              Figure
                                                                           Figure    1. Public
                                                                                  1. Public    health
                                                                                            health    stagesofofCOVID-19
                                                                                                    stages       COVID-19response.
                                                                                                                          response.

       Int. J. Environ. Res. Public Health 2020, 17, x; doi: FOR PEER REVIEW                         www.mdpi.com/journal/ijerph
Int. J. Environ. Res. Public Health 2020, 17, 6719 5 of 24
2.2. Statistical Approach
The primary outcome was presented as mean daily attendance for each of the health stages
from 1 January 2020 to 31 May 2020. Negative binomial regressions were estimated and adjusted for
seasonal trends and year effects, and the incident rate ratio (IRR) was reported. Prior year comparison
was adjusted for seasonality, with 2018 and 2019 attendance averaged to adjust for year specific
variation. Secondary outcomes included referrals by a general practitioner (GP), admissions from the
ED, presentations triaged as urgent and low urgency, and the level of attendance with ambulance as
the mode of arrival. This analysis evaluated changes in the pattern of attendance in aggregate and also
investigated regional variation in outcomes.
ED diagnosis data was available for the Dublin hospitals. However, as none of these hospitals
used matching diagnostic coding, a detailed mapping exercise was conducted using International
Classification of Disease (ICD) categorisation as a guide [19] and with input from ED and paediatric
clinicians, to ensure consistent categorisation across hospitals (Appendix C). Categorisation was
further consolidated into summarised categories of conditions, based on expected prevalence under
the restrictive conditions imposed by the pandemic related public health responses. For example,
all conditions predominantly contagious in nature were likely to be impacted in a similar manner by
the low level of personal contact (“Infectious”), while the suspension of sporting and other physical
activities, coupled with the requirement to remain close to home, were likely to have a similar effect
on many types of injuries (“Trauma and Physical Activity”). Graphic analysis illustrates weekly
attendance by summary category and variation on prior year by public health stage for the more
detailed categories.
Stata16 (StataCorp, College Station, Texas, USA) was used to analyse the data and estimate the
results. Due to sample size limitations, analysis of temporal trends in attendance by patients with
chronic complex conditions was based on overall visits during each stage, with prior year comparison
used to identify variation. Chronic complex condition (CCC) was defined as any medical condition that
can be reasonably expected to last at least 12 months (unless death intervenes) and to involve either
several different organ systems or one organ system severely enough to require specialty paediatric
care, and probably some period of hospitalisation in a tertiary care centre [20]. Conditions categorized
as CCC are detailed in Appendix C.
2.3. Ethics
Ethical approval has been granted by the COVID-19 National Research Ethics Committee,
established by the Minister of Health in Ireland to deliver an expedited review process for COVID-19
research (reference code: 20-NREC-COV-034). Due to the collection of non-personal and anonymous
data, explicit consent was not required for the data collected for this study. In accordance with data
protection regulations, the data was anonymised at each site by relevant hospital staff before being
transferred securely to the research team.
3. Results
Paediatric ED attendance for the three-month period from March to May 2020 was 21,545, a drop
of 46% on 39,772 for the same period in 2018/2019. Pre-COVID attendance (Jan/Feb 2020) was already
below prior years (Table 1) with an IRR of 0.93 (CI 0.89–0.98), and below the comparable prior year
period during the two-week Containment phase with an IRR also of 0.93 (CI 0.85–1.01). ED attendance
dropped significantly below prior years during the Delay phase with an IRR of 0.58 (CI 0.54–0.64)
during the two week period following the closure of schools and childcare facilities, and reached its
lowest in late March, running 54% below prior years as the country entered the seven-week Mitigation
phase or “lockdown”, with an IRR of 0.46 (CI 0.44–0.49). Both the number and proportion of attendances
referred by a GP experienced a large and sustained drop during the Delay phase (IRR 0.37: CI 0.30–0.46),
with 21% of visits referred, compared with 34% in prior years. Admissions were below prior yearsInt. J. Environ. Res. Public Health 2020, 17, 6719 6 of 24
during the pre-COVID period (IRR 0.92: CI 0.86–0.97) and experienced a sustained reduction similar to
that in attendances during the Delay phase, although the proportion of visits resulting in admission
remained stable at 14%–15% throughout the public health stages. The proportion of attendances
triaged as urgent also remained consistent and, with the exception of a brief increase during the
Containment phase, the proportion of visits triaged as low urgency also remained stable throughout.
The proportional attendance by children aged 13 to 15 dropped most substantially in the Delay and
Mitigation stages; however, the age-profile of attendance during Phase One of Reopening was similar
to pre-COVID proportions, albeit based on a much lower level of attendance.
The pattern of attendance at the Dublin (Table 2) and Regional hospitals (Table 3) throughout
the public health stages was comparable, with two exceptions. Attendance at the Regional hospitals
began to drop during the Containment phase (IRR 0.75: CI 0.67–0.83) while the number of visits at
the Dublin hospitals remained similar to prior years, and the increase in attendance during Phase
One of Reopening at the Regional hospitals was also below that of the Dublin hospitals (Regional IRR
0.5: CI 0.44–0.56; Dublin IRR 0.6: CI 0.55–0.66). While the proportion of visits referred by a GP at the
Dublin hospitals was below that of the Regional hospitals for all periods, the level and proportion of
referrals began to drop at the Regional hospitals during the Containment phase (IRR 0.77; CI 0.66–0.91).
Both Dublin and the Regional hospitals experienced a significant drop in GP referrals during the Delay
phase, and the proportion of GP referred visits remained 9 and 11 percentage points respectively
below the prior year rates during Phase One of Reopening. The rate of admissions from the ED at the
Regional hospitals was above prior years throughout all public health stages, while the proportion of
attendances resulting in admission at the Dublin hospitals was similar to prior years.
Figure 2 charts the percentage change compared to prior years for each of the main categories
of diagnosis for the Dublin hospitals by public health stage, with a detailed breakdown reported in
Appendix B. For patients with multiple diagnoses, the first diagnosis was used in this analysis. Figure 3
charts weekly attendance at a more summarised category of diagnosis throughout the public health
stages from January to June 2020, with conditions grouped based on their expected prevalence within
the context of the restrictive living conditions.
Attendance for all categories of diagnosis decreased during the Delay phase by between 27–62%.
Virus related attendances typically represented between 33–47% of overall ED attendance during
this five-month period in prior years. Viral related attendances form the majority of the summary
category Infectious, which saw the greatest drop in the Delay phase, and this explains much of the
overall decrease in attendances. Presentations within this summary category continued at a low level,
as families stayed at home and schools and workplaces remained closed. ED admissions dropped for
these conditions, though the proportion of Infectious admissions did increase. Sepsis presentations
were comparable to prior periods. Attendance related to Trauma/Physical Activity also dropped during
the Delay phase but began to rise steadily during the Mitigation phase. ED attendances relating to
Personal Safety, such as poisonings, overdoses, and insertion/ingestion of foreign objects, accounting
for approximately 2% of visits, dropped during the Mitigation phase, and rose somewhat during Phase
One of Reopening. Mental health presentations, mainly by children aged 13−15, typically accounting
for less than 1% of ED visits (three per day), dropped to a mean of just one per day during the Delay
phase, rose slightly during the Mitigation phase but remained below pre-COVID and prior year levels
in late May. The proportion of mental health presentations (13−15 years) admitted during the Delay
and Mitigation phases was higher at 49%, compared with 42% in prior years.Int. J. Environ. Res. Public Health 2020, 17, 6719 7 of 24
Table 1. Characteristics of average daily paediatric emergency department attendance by public health COVID-19 response stage.
Pre-COVID Containment Delay Mitigation Reopening: Phase One
Date from 01/01/2020 29/02/2020 13/03/2020 28/03/2020 18/05/2020
Date to 28/02/2020 12/03/2020 27/03/2020 17/05/2020 31/05/2020
Number of Days 59 13 15 51 14
Daily Visits % % % % %
Observed Mean 396 100% 370 100% 232 100% 195 100% 257 100%
Prior Years Mean 444 100% 396 100% 435 100% 435 100% 450 100%
IRR 0.93 0.93 0.58 0.46 0.58
Confidence Interval 0.89 0.98 0.85 1.01 0.54 0.64 0.44 0.49 0.53 0.63
p-value 0.004 0.086 0.000 0.000 0.000
GP Referrals
Observed Mean 133 34% 115 31% 49 21% 42 21% 54 21%
Prior Years Mean 157 35% 131 31% 149 34% 140 32% 143 32%
IRR 0.88 0.85 0.37 0.30 0.38
Confidence Interval 0.78 0.99 0.69 1.07 0.30 0.46 0.26 0.34 0.31 0.47
p-value 0.033 0.163 0.000 0.000 0.000
Admitted
Observed Mean 57 14% 54 15% 34 15% 29 15% 36 14%
Prior Years Mean 63 14% 60 14% 64 15% 62 14% 64 14%
IRR 0.92 0.89 0.55 0.46 0.57
Confidence Interval 0.86 0.97 0.79 0.99 0.49 0.62 0.43 0.49 0.51 0.64
p-value 0.004 0.030 0.000 0.000 0.000
Triage urgent (score 1 or 2)
Observed Mean 85 21% 78 21% 47 20% 38 19% 53 20%
Prior Years Mean 91 20% 80 19% 88 20% 87 20% 88 19%
IRR 0.97 0.95 0.58 0.44 0.60
Confidence Interval 0.91 1.03 0.85 1.06 0.52 0.65 0.41 0.48 0.54 0.68
p-value 0.255 0.340 0.000 0.000 0.000Int. J. Environ. Res. Public Health 2020, 17, 6719 8 of 24
Table 1. Cont.
Pre-COVID Containment Delay Mitigation Reopening: Phase One
Date from 01/01/2020 29/02/2020 13/03/2020 28/03/2020 18/05/2020
Date to 28/02/2020 12/03/2020 27/03/2020 17/05/2020 31/05/2020
Number of Days 59 13 15 51 14
Triage low urgency (score 4 or 5)
Observed Mean 150 38% 146 40% 90 39% 77 39% 105 41%
Prior Years Mean 164 37% 150 35% 164 38% 173 40% 184 41%
IRR 0.97 0.98 0.61 0.46 0.58
Confidence Interval 0.91 1.03 0.88 1.10 0.54 0.68 0.43 0.50 0.52 0.65
p-value 0.328 0.781 0.000 0.000 0.000
Arrival by ambulance
Observed Mean 24 6% 26 7% 18 8% 12 6% 14 5%
Prior Years Mean 25 6% 24 5% 25 6% 23 5% 26 6%
IRR 1.13 1.25 0.87 0.58 0.63
Confidence Interval 1.05 1.22 1.10 1.42 0.76 1.00 0.53 0.64 0.53 0.73
p-value 0.002 0.001 0.057 0.000 0.000
Other statistics n Std Dev n Std Dev n Std Dev n Std Dev n Std Dev
ICU admissions in
34 11 10 20 4
period (actual)
ICU admissions per day
0.6 0.6 0.8 0.8 0.7 0.6 0.4 0.6 0.3 0.5
(mean)
Age category (% proportion)
Under 2 107 16 27% 93 13 25% 76 13 33% 55 9 28% 63 11 25%
Age 2 to 5 86 12 22% 81 9 22% 59 13 25% 45 9 23% 50 6 19%
Age 5 to 12 130 29 33% 122 24 33% 71 14 31% 66 15 34% 95 17 37%
Age 13 to 15 74 21 19% 74 22 20% 27 8 12% 29 9 15% 49 8 19%
n is daily unless otherwise stated. 95% confidence intervals; prior year 2018/2019 are averaged mean attendance; percentages are of the total number of visits for the period; while Phase
One is a three-week period from 18th May to 8th June, this analysis covers the period to 31 May 2020; estimation is by negative binominal regression and IRR is the incident rate ratio;
admissions, including ICU admissions, are from emergency department (ED) only.Int. J. Environ. Res. Public Health 2020, 17, 6719 9 of 24
Table 2. Paediatric emergency department attendance at Dublin hospitals by public health COVID-19 response stage.
Pre-COVID Containment Delay Mitigation Reopening: Phase One
Date from 01/01/2020 29/02/2020 13/03/2020 28/03/2020 18/05/2020
Date to 28/02/2020 12/03/2020 27/03/2020 17/05/2020 31/05/2020
Number of Days 59 13 15 51 14
Daily Visits % % % % %
Observed Mean 321 100% 310 100% 186 100% 158 100% 216 100%
Prior Years Mean 359 100% 317 100% 351 100% 351 100% 362 100%
IRR 0.94 0.97 0.59 0.47 0.60
Confidence Interval 0.89 0.99 0.88 1.06 0.54 0.64 0.44 0.49 0.55 0.66
p-value 0.013 0.522 0.000 0.000 0.000
GP referral
Observed Mean 89 28% 80 26% 32 17% 25 16% 36 17%
Prior Years Mean 105 29% 88 25% 100 28% 95 27% 95 26%
IRR 0.88 0.89 0.36 0.28 0.37
Confidence Interval 0.76 1.02 0.68 1.17 0.27 0.47 0.23 0.32 0.28 0.49
p-value 0.097 0.417 0.000 0.000 0.000
Admitted
Observed Mean 37 12% 37 12% 21 11% 18 11% 23 11%
Prior Years Mean 43 12% 42 12% 43 12% 42 12% 43 12%
IRR 0.86 0.88 0.50 0.42 0.52
Confidence Interval 0.80 0.92 0.78 1.00 0.43 0.57 0.38 0.45 0.45 0.59
p-value 0.000 0.045 0.000 0.000 0.000
Triage urgent (score 1 or 2)
Observed Mean 64 20% 60 19% 37 20% 30 19% 43 20%
Prior Years Mean 70 19% 61 18% 68 19% 66 19% 67 18%
IRR 0.95 0.95 0.59 0.46 0.64
Confidence Interval 0.89 1.02 0.84 1.07 0.52 0.67 0.43 0.50 0.56 0.50
p-value 0.142 0.413 0.000 0.000 0.000Int. J. Environ. Res. Public Health 2020, 17, 6719 10 of 24
Table 2. Cont.
Pre-COVID Containment Delay Mitigation Reopening: Phase One
Date from 01/01/2020 29/02/2020 13/03/2020 28/03/2020 18/05/2020
Date to 28/02/2020 12/03/2020 27/03/2020 17/05/2020 31/05/2020
Number of Days 59 13 15 51 14
Triage low urgency (score 4 or 5)
Observed Mean 141 44% 140 45% 83 44% 71 45% 99 46%
Prior Years Mean 153 43% 139 41% 155 44% 162 46% 171 47%
IRR 0.97 1.00 0.59 0.45 0.59
Confidence Interval 0.91 1.03 0.89 1.13 0.53 0.67 0.42 0.49 0.52 0.66
p-value 0.320 0.939 0.000 0.000 0.000
Arrival by ambulance
Observed Mean 18 6% 19 6% 13 7% 9 6% 12 5%
Prior Years Mean 18 5% 16 5% 17 5% 17 5% 18 5%
IRR 1.20 1.37 0.94 0.66 0.74
Confidence Interval 1.10 1.30 1.18 1.59 0.80 1.11 0.60 0.74 0.62 0.88
p-value 0.000 0.000 0.478 0.000 0.001
Age category (% proportion) Std Dev Std Dev Std Dev Std Dev Std Dev
Under 2 86 13 27% 78 12 25% 61 12 33% 44 9 28% 52 10 24%
Age 2 to 5 69 10 22% 67 7 22% 47 11 25% 36 8 23% 42 5 19%
Age 5 to 12 107 25 33% 102 21 33% 58 14 31% 54 14 34% 83 16 38%
Age 13 to 15 60 18 19% 63 17 20% 22 7 12% 22 9 15% 40 7 18%
n is daily unless otherwise stated. 95% confidence intervals; prior year 2018/2019 are averaged mean attendance; percentages are of the total number of visits for the period; while Phase
One is a three-week period from 18th May to 8th June, this analysis covers the period to 31 May 2020; estimation is by negative binominal regression and IRR is the incident rate ratio;
admissions are from ED only.Int. J. Environ. Res. Public Health 2020, 17, 6719 11 of 24
Table 3. Paediatric emergency department attendance at Regional hospitals by public health COVID-19 response stage.
Pre-COVID Containment Delay Mitigation Reopening: Phase One
Date from 01/01/2020 29/02/2020 13/03/2020 28/03/2020 18/05/2020
Date to 28/02/2020 12/03/2020 27/03/2020 17/05/2020 31/05/2020
Number of Days 59 13 15 51 14
Daily Visits % % % % %
Observed Mean 75 100% 60 100% 46 100% 37 100% 41 100%
Prior Years Mean 85 100% 79 100% 85 100% 84 100% 88 100%
IRR 0.91 0.75 0.57 0.45 0.50
Confidence Interval 0.86 0.96 0.67 0.83 0.52 0.64 0.42 0.48 0.44 0.56
p-value 0.001 0.000 0.000 0.000 0.000
GP Referrals
Observed Mean 44 59% 35 59% 17 38% 16 44% 18 44%
Prior Years Mean 52 61% 44 51% 49 58% 46 55% 48 55%
IRR 0.87 0.77 0.39 0.35 0.40
Confidence Interval 0.79 0.94 0.66 0.91 0.32 0.46 0.31 0.39 0.33 0.48
p-value 0.001 0.002 0.000 0.000 0.000
Admitted
Observed Mean 20 27% 17 29% 13 28% 11 29% 13 32%
Prior Years Mean 20 24% 19 22% 21 25% 19 23% 21 24%
IRR 1.04 0.90 0.68 0.56 0.69
Confidence Interval 0.96 1.14 0.77 1.05 0.57 0.80 0.51 0.62 0.58 0.62
p-value 0.318 0.189 0.000 0.000 0.000
Triage urgent (score 1 or 2)
Observed Mean 20 27% 18 30% 10 23% 8 22% 10 24%
Prior Years Mean 21 25% 19 22% 20 23% 21 25% 21 24%
IRR 1.01 0.93 0.56 0.39 0.50
Confidence Interval 0.93 1.10 0.79 1.10 0.46 0.67 0.35 0.44 0.41 0.61
p-value 0.784 0.420 0.000 0.000 0.000Int. J. Environ. Res. Public Health 2020, 17, 6719 12 of 24
Table 3. Cont.
Pre-COVID Containment Delay Mitigation Reopening: Phase One
Date from 01/01/2020 29/02/2020 13/03/2020 28/03/2020 18/05/2020
Date to 28/02/2020 12/03/2020 27/03/2020 17/05/2020 31/05/2020
Number of Days 59 13 15 51 14
Triage low urgency (score 4 or 5)
Observed Mean 10 13% 6 11% 7 16% 6 16% 6 14%
Prior Years Mean 11 13% 11 12% 10 11% 11 13% 13 15%
IRR 0.98 0.68 0.76 0.57 0.53
Confidence Interval 0.85 1.13 0.51 0.90 0.59 1.00 0.49 0.67 0.39 0.70
p-value 0.769 0.008 0.046 0.000 0.000
Arrival by ambulance
Observed Mean 7 9% 7 12% 6 12% 3 8% 3 6%
Prior Years Mean 7 8% 7 8% 8 9% 7 8% 8 9%
IRR 0.98 1.00 0.78 0.45 0.37
Confidence Interval 0.85 1.12 0.79 1.28 0.60 1.01 0.37 0.55 0.26 0.52
p-value 0.77 0.98 0.06 0.00 0.00
Age category
(% proportion) n Std Dev n Std Dev n Std Dev n Std Dev n Std Dev
Under 2 21 6 27% 15 5 24% 15 4 33% 11 3 29% 11 4 27%
Age 2 to 5 17 4 22% 14 3 24% 12 4 27% 9 3 25% 8 3 21%
Age 5 to 12 24 6 33% 21 5 35% 13 4 29% 12 4 33% 12 3 29%
Age 13 to 15 14 5 19% 10 6 17% 6 2 11% 5 2 13% 9 3 23%
n is daily unless otherwise stated. 95% confidence intervals; prior year 2018/2019 are averaged mean attendance; percentages are of the total number of visits for the period; while Phase
One is a three-week period from 18th May to 8th June, this analysis covers the period to 31 May 2020; estimation is by negative binominal regression and IRR is the incident rate ratio;
admissions are from ED only.Int. J. Environ. Res. Public Health 2020, 17, 6719 13 of 24
Int. J. Environ. Res. Public Health 2020, 17, x FOR PEER REVIEW 13 of 25
60%
40%
20%
0%
-20%
-40%
-60%
-80%
-100%
Pre-COVID Containment Delay Mitigation Reopening: Phase One
Figure 2. Change by Diagnosis from prior year by Public Health Stage. Prior year 2018/2019 is average daily attendance for comparable period in 2018 and 2019.
Figure 2. Change by Diagnosis from prior year by Public Health Stage. Prior year 2018/2019 is average daily attendance for comparable period in 2018 and 2019.
Int. J. Environ. Res. Public Health 2020, 17, x; doi: FOR PEER REVIEW www.mdpi.com/journal/ijerphInt. J. Environ. Res. Public Health 2020, 17, 6719 14 of 24
Int. J. Environ. Res. Public Health 2020, 17, x FOR PEER REVIEW 14 of 25
Figure 3. Emergency department attendance by category of diagnosis. Infectious includes respiratory,
Figure 3. Emergency department attendance by category of diagnosis. Infectious includes respiratory,
ENT, infectious diseases and digestive; Trauma/Physical Activity refers to sprains, fractures and
ENT, infectious diseases and digestive; Trauma/Physical Activity refers to sprains, fractures and
bruising, head injuries, burns, lacerations and orthopaedic; Personal Safety includes toxicology,
bruising, head injuries, burns, lacerations and orthopaedic; Personal Safety includes toxicology, foreign
foreign objects (insertion/ingestion) and child protection/assault; Medical includes dermatology,
objects (insertion/ingestion) and child protection/assault; Medical includes dermatology, genitourinary
genitourinary & gynaecology, neurology, surgical, general, ophthalmology and infancy related;
& gynaecology, neurology, surgical, general, ophthalmology and infancy related; Mental Health refers
Mental Health refers to psychosocial presentations; Did Not Wait refers to patients who registered on
to psychosocial presentations; Did Not Wait refers to patients who registered on arrival but did not
arrival but did not wait to see a doctor. This varies with the average wait time and is generally higher
wait to see a doctor. This varies with the average wait time and is generally higher during busy period.
during busy period.
The summary category Medical, which groups clinical presentations that may be unaffected by
Attendance
the for allchanges
environmental categories of diagnosis
imposed by thedecreased during
public health the Delay
measures, phaseby
dropped by 43%
between
during27–62%.
the Delay
Virus related attendances typically represented between 33–47% of overall
phase, increased week on week during the Mitigation phase, but remained 21% below prior ED attendance during thisyear
five-month period in prior years. Viral related attendances form the majority
in Phase One of Reopening. Medical ED visits typically account for 17% of overall attendance and, of the summary
category
whileInfectious,
the level ofwhich saw the
attendance greatest
in prior yearsdrop
was in the from
stable DelaySeptember
phase, and to this
May,explains
visits havemuch of theover
dropped
overall
the decrease
summer in attendances.
months to a levelPresentations
comparablewithinto thatthis summary
of Phase Onecategory continued
of Reopening. The at a low
rate level,
of admission
as families stayed at home and schools and workplaces remained closed. ED admissions
for these conditions was 27% during the Delay phase, compared with prior year of 23%. Admission dropped for
these conditions, though the proportion of Infectious
rates returned to prior year levels during the Mitigation phase. admissions did increase. Sepsis presentations
were comparable
As patients to with
priorchronic
periods.complex
Attendance relatedaccount
conditions to Trauma/Physical
for less than Activity also dropped
0.5% of overall paediatric
during the Delay phase but began to rise steadily during the Mitigation
attendances, statistical analysis is challenging due to the small number of visits within phase. ED attendances
this category.
relating
Tableto4Personal
thereforeSafety, such total
presented as poisonings,
visits per overdoses,
public healthandstage
insertion/ingestion
compared with of the
foreign objects,
average for the
accounting for approximately 2% of visits, dropped during the Mitigation phase,
corresponding periods in 2018/19. Pre-COVID ED visits for these conditions were 25% below prior and rose somewhat
during
yearsPhase
(TableOne of Reopening.
4). Attendance droppedMental
duringhealth presentations,
the Delay stage and mainly
remained bydown
children aged
on prior 13−15,
years during
typically accounting for less than 1% of ED visits (three per day), dropped to
the Mitigation phase and Phase One of Reopening, with the period March to May 2020 running 45%a mean of just one per
day below
duringprior
the years.
Delay Mostphase,ofrose slightly during
this decrease relatedthe Mitigationand
to endocrine phase but remained
oncology belowwith
presentations, pre-89%
COVID and prior year levels in late May. The proportion of mental health presentations
of patients attending during this period admitted (78% in 2018/2019) and 78% triaged as urgent (13−15 years)
admitted
(74% induring the Delay and Mitigation phases was higher at 49%, compared with 42% in prior
2018/19).
years.
The summary category Medical, which groups clinical presentations that may be unaffected by
the environmental changes imposed by the public health measures, dropped by 43% during the Delay
phase, increased week on week during the Mitigation phase, but remained 21% below prior year in
Int. J. Environ. Res. Public Health 2020, 17, x; doi: FOR PEER REVIEW www.mdpi.com/journal/ijerphInt. J. Environ. Res. Public Health 2020, 17, 6719 15 of 24
Table 4. Paediatric emergency department attendance for Complex Chronic Conditions by public health COVID-19 response stage: (Dublin only).
Pre-COVID Containment Delay Mitigation Reopening: Phase One Total
2018/ Change 2018/ Change 2018/ Change 2018/ Change 2018/ Change 2018/ Change
2020 2020 2020 2020 2020 2020
2019 (n) 2019 (n) 2019 (n) 2019 (n) 2019 (n) 2019 (n)
Respiratory 2 0 2 0 1 −1 0 0 0 1 2 −1 3 0 3 6 3 4
Endocrine/
33 38 −5 9 7 2 3 6 −3 15 24 −9 4 13 −9 64 87 −23
Metabolic
Digestive 2 3 −1 0 2 −2 0 1 −1 1 4 −3 0 1 −1 3 10 −7
Haematology/
11 23 −12 3 4 −1 1 8 −7 6 16 −10 3 5 −2 24 54 −30
Oncology
Total 48 64 −16 12 13 −1 4 14 −10 23 45 −22 10 18 −8 97 153 −56
Figures are actual number of visits in the period. As 2020 was a leap year, one day extra is included in the 2020 Containment stage; Respiratory includes cystic fibrosis; Endocrine/Metabolic
includes diabetes and Addison’s disease; Digestive includes Crohn’s disease, ulcerative colitis and coeliac disease; Haematology/Oncology includes sickle cell anaemia, leukaemia,
neoplasm, tumour, space occupying lesion, and other oncology.Int. J. Environ. Res. Public Health 2020, 17, 6719 16 of 24
4. Discussion
This study analyses trends in paediatric ED attendance from before the first confirmed case
of COVID-19 in Ireland and throughout the stages of emergency public health restrictions in the
three-month period that followed. The greatest reduction occurred during the Delay phase, when the
Irish authorities were concerned that hospitals would be overwhelmed, and public health messaging
was designed to create capacity within the health system (Figure 1). Furthermore, as availability
of transport to and from EDs is a concern for many parents [21,22], public health restrictions on
travel and fear of using public transport may have led to some parents deciding not to access needed
healthcare [23]. The decrease in attendances for common childhood complaints, such as respiratory
and digestive illness and trauma and physical activity related injuries, may be largely explained
by changes in behaviour due to restrictions on movement as well as closure of schools, creches,
and cultural, sporting and social activities where such illnesses may typically have an opportunity to
spread. Influenza surveillance reports for this period indicate a very low incidence for all age groups,
particularly children aged under 14 [24]. The overall acuity of presentations and rate of hospital
admission remained relatively stable throughout each public health stage.
Although the incidence of COVID-19 among children is low, with 2% of confirmed cases in Ireland
as of 5th June aged under 15 [25], public health advice issued during the pandemic, particularly during
the Delay phase, did not differentiate between adults and children and urged patients not to attend
health services in person if they displayed symptoms associated with respiratory illness. Hospital
avoidance due to fear of infection has been documented in previous epidemics [13], with patients also
voicing concern about not wanting to burden the health system. However, such avoidance is problematic
if it places a child at risk, and identifying these children is challenging as the number of patients in
this category is small. If the aim of the public health messaging was to deter parents from bringing
their children to the ED, the sharp drop in the Delay phase does suggest that avoidance occurred.
Nonetheless, it is questionable whether this was an appropriate aim for paediatric services, with the
drop in attendance for endocrine, neurology, haematology and oncology and the increase in the rate of
admissions for complex chronic conditions, in particular, of concern. However, enhanced speciality
support (unburdened of scheduled care commitments), in the absence of an established paediatric
complex care programme, may explain some of the decrease in attendance. Further longitudinal
research is needed to monitor this trend over the duration of the pandemic to determine any changes
in morbidity and mortality outcomes.
The reduction in mental health presentations and the increase in the proportion of those admitted
requires attention. Children and adolescents may be particularly vulnerable to the impact of restrictions
on social contacts, closure of schools, and isolation on their mental health [26], the extent of which is
still not known, and therefore monitoring these presentations throughout the duration of the pandemic
is critical. The level of mental health presentations during the study period is comparable to the
summer/early autumn period in prior years and may reflect the incidence of mental health presentations
during school holidays. However, as the admission rate of these presentations is higher than prior years,
potentially indicating a greater severity of presentation, this may be reflective of delayed presentation.
The lack of community mental health services and support due to the constraints of the public health
measures may also explain this increased severity. Increased admissions may, however, indicate greater
capacity to admit, particularly cases that may be perceived as “borderline admit”.
The decline in the proportion of GP referred visits may be due to an overall decrease in attendance
by paediatric patients at general practice. Many GPs moved to remote consultations from the onset of
the pandemic, conducting fewer face-to-face consultations. GPs also played a critical role in referring
probable cases of COVID-19 for testing, so accessibility for non-COVID illness may have been an issue.
However, the decreased GP referral rate may also be somewhat attributable to a change in the referral
process. GP referrals are captured on ED systems on the presentation of a referral letter and, as a GP
referral entitles patients to a waiver of the usual ED charge of €100 for those without a medical card,Int. J. Environ. Res. Public Health 2020, 17, 6719 17 of 24
capture of such referrals on ED systems is generally robust. However, some remote consultations may
have resulted in advice to attend the ED without a GP issuing an accompanying letter.
Implications for Policy and Practice
This study analysed almost half of the national paediatric ED attendances, and therefore provides
robust confirmation of the decrease in ED utilisation during each phase of the COVID-19 stages.
The findings are relevant for planning for any future spikes in COVID-19 as well as possible future
global pandemics, highlighting the need for careful consideration of the possible impact of public
health messaging on children’s health.
The change in the rate of referrals from GPs may reflect the diversion of general practice resources
to managing the response to COVID-19, and their accessibility. Future health service planning should
prioritise general practice accessibility. The drop in attendance for complex chronic conditions may
be difficult to address, and policy makers will need to ensure public messaging does not deter
parents with children displaying symptoms indicative of such conditions from seeking potentially
life-saving diagnosis and treatment. Beyond the pandemic there may be an opportunity to learn from
the experience of the past months and to encourage more efficient use of the ED by parents. Prior to
the onset of COVID-19, attendances at EDs had been increasing, with some public health interventions
and changes in service provision aimed at reducing this rise [27,28]. Understanding the changes in
parents’ decision-making and behaviour, including where they sought help and advice in place of the
ED, may provide useful learning for supporting care for childhood illness outside of the ED setting.
5. Limitations
Data relating to diagnostic categories was only available for the Dublin hospitals and therefore,
these findings may not reflect regional outcomes. However, as the largest paediatric health service
providers in the country, these hospitals and the urgent care centre account for a sizeable portion of ED
attendances nationally. Additionally, while all efforts were made to account for reporting errors in this
data, a small number of coding errors may remain. The small sample size of visits for chronic complex
conditions presents a challenge, though monitoring such attendances is critical given the potential
impact of delayed attendance on the health of these children.
6. Conclusions
Presentations to the ED have declined sharply, particularly among children, in the weeks
immediately following the onset of the COVID-19 pandemic. Delayed or reduced access to paediatric
emergency care can have severe consequences and concern has been expressed that the reduction in
ED attendance may be due to avoidance behaviour. This study uses a unique sample of paediatric
ED attendance to understand changes in ED presentations from the most restrictive phase of public
health COVID-19 response through to the beginning of reopening. While a reduction in attendance
for respiratory conditions, infectious diseases and certain injuries can be attributed to the restrictive
living conditions imposed in response to COVID-19, a sustained decrease in medical attendance,
and for complex chronic conditions in particular, may be indicative of avoidance behaviour. Decreased
referrals from GPs may be indicative of reduced accessibility to general practice due to the pressure on
GPs to manage the response to COVID-19. Surveillance of the nature of paediatric ED attendance must
continue to ensure the identification of those at risk due to delayed attendance and to inform public
health messaging as the burden placed on families of living through a pandemic persists.
7. Future Research
There is little evidence of the longer-term impact on health seeking behaviour during public health
emergencies, and changes in attendance patterns, admission rates and mortality need to be monitored
as the pandemic progresses over the coming months. This analysis forms part of a 12-month study [29]
which will monitor paediatric ED attendance as the prevalence of and living conditions associatedInt. J. Environ. Res. Public Health 2020, 17, x FOR PEER REVIEW 19 of 25
Int. J. Environ. Res. Public Health 2020, 17, 6719 18 of 24
conditions associated with COVID-19 evolve. Additionally, there is a need to understand any
behavioural changes from the perspective of parents and families to provide context for changes in
with COVID-19 evolve. Additionally, there is a need to understand any behavioural changes from the
attendance patterns. Parental preferences when accessing unscheduled healthcare are being assessed
perspective of parents and families to provide context for changes in attendance patterns. Parental
as part of a related study [30] and a survey of parents in order to understand health seeking behaviour
preferences when accessing unscheduled healthcare are being assessed as part of a related study [30]
by parents for their children during COVID-19 forms part of this current study [23,29].
and a survey of parents in order to understand health seeking behaviour by parents for their children
The decline in paediatric ED attendance is clear and the restrictions on movements and social
during COVID-19 forms part of this current study [23,29].
gatherings, coupled with normal seasonal patterns of attendance, explains much of this variance.
The decline in paediatric ED attendance is clear and the restrictions on movements and social
General practice referrals to ED have significantly decreased. This large nationally representative
gatherings, coupled with normal seasonal patterns of attendance, explains much of this variance.
study does indicate that attendance by the less frequently encountered chronic complex patients may
General practice referrals to ED have significantly decreased. This large nationally representative study
still be of concern during the pandemic. However, the potential for the systemic changes and the
does indicate that attendance by the less frequently encountered chronic complex patients may still be
COVID-19 public health response to have a long term detrimental effect on children’s and young
of concern during the pandemic. However, the potential for the systemic changes and the COVID-19
people’s health may still be underappreciated [31] and continued surveillance of paediatric ED
public health response to have a long term detrimental effect on children’s and young people’s health
attendance is needed, particularly as the risk of a further wave of COVID-19 increases.
may still be underappreciated [31] and continued surveillance of paediatric ED attendance is needed,
Author Contributions:
particularly Conceptualization,
as the risk of a further waveT.M., E.N. and E.M.;
of COVID-19 Methodology, T.M.; Validation, T.M., E.N., C.C.,
increases.
M.B., C.H., F.C. and E.M.; Formal Analysis, T.M.; Investigation, T.M.; Resources, E.N., M.B., C.H., F.C. and E.M.;
Data Curation,
Author T.M.; Writing—Original
Contributions: Conceptualization, Draft Preparation,
T.M., T.M.;Methodology,
E.N. and E.M.; Writing—Review
T.M.; & Editing, E.N.,
Validation, T.M.,C.C.,
E.N.,M.B.,
C.C.,
M.B., C.H.,
C.H., F.C. E.M.;
F.C. and and E.M.; Formal Analysis,
Visualization, T.M.; Investigation,
T.M.; Supervision, E.N. and T.M.; Resources,
E.M.; E.N., M.B., C.H.,E.N.;
Project Administration, F.C. and E.M.;
Funding
Data Curation,
Acquisition, T.M.;
T.M., Writing—Original
E.N. and E.M. All authors Draft Preparation,
have read and T.M.; Writing—Review
agreed & Editing,
to the published E.N.,
version C.C.,
of the M.B., C.H.,
manuscript.
F.C. and E.M.; Visualization, T.M.; Supervision, E.N. and E.M.; Project Administration, E.N.; Funding Acquisition,
T.M., E.N.The
Funding: andCUPID
E.M. All authors have
COVID-19 read
Project is and agreed
funded to the
by the published
Health version
Research Boardof(HRB)
the manuscript.
under the HRB COVID-
19 Pandemic Rapid Response Funding call (grant number: COV19-2020-076).
Funding: The CUPID COVID-19 Project is funded by the Health Research Board (HRB) under the HRB COVID-19
Pandemic Rapid Response Funding call (grant number: COV19-2020-076).
Acknowledgments: We would like to thank Conor Deasy, Ciara Martin and David Joyce for their assistance
with this project. We We
Acknowledgments: would
would alsolike
liketotothank Conor Deasy,
acknowledge Ciara Martin
the assistance and
of the Davidmanagers
system Joyce for their assistance
and data with
analysts at
this project.
each We would
of the hospitals in also like to the
compiling acknowledge
data includingthe assistance
Zoja Trenz,of the system
Cathal managers
McKinley, andBoyle,
Breda data analysts at each
Neil Ryan, of
Bryan
the hospitals in compiling the data including Zoja Trenz, Cathal McKinley, Breda Boyle, Neil Ryan, Bryan Lynch,
Lynch, Helen Kiernan, Sylvia O’Donnell and James Carr.
Helen Kiernan, Sylvia O’Donnell and James Carr.
Conflicts of Interest:
Conflicts of Interest: The
The authors
authors declare
declare no no conflict
conflict of
of interest.
interest.
Appendix A
Figure A1. Location
Figure A1. Location of
of participating
participating sites.
sites.Int. J. Environ. Res. Public Health 2020, 17, 6719 19 of 24
Appendix B
Table A1. Mean daily paediatric emergency department attendance, by category, by public health COVID-19 response stage: Dublin only.
Pre-COVID Containment Delay Mitigation Reopening: Phase One
Number of days 59 13 15 51 14
2020 2018/19 % 2020 2018/19 % 2020 2018/19 % 2020 2018/19 % 2020 2018/19 %
Did not wait 5.1 15.7 −67% 5.6 16.8 −67% 2.1 11.7 −82% 1.6 12.3 −87% 2.6 13.2 −80%
Injury: Fractures etc. 47.5 51.3 −7% 50.5 54.7 −8% 24.5 65.0 −62% 31.2 79.6 −61% 50.1 92.6 −46%
Digestive 31.5 33.0 −4% 31.6 32.3 −2% 13.8 35.9 −62% 13.6 37.0 −63% 17.1 34.3 −50%
Normal 16.0 20.7 −23% 15.2 17.3 −12% 8.7 21.2 −59% 13.1 18.3 −28% 15.0 16.9 −11%
Orthopaedic 7.3 5.8 26% 6.5 4.8 36% 2.5 6.2 −59% 3.7 7.2 −48% 5.2 6.4 −18%
Psychosocial 3.1 2.5 23% 3.8 2.8 33% 1.0 2.4 −58% 2.0 2.8 −29% 2.6 3.4 −23%
Neurology 8.3 8.6 −4% 7.5 6.9 9% 4.1 8.9 −54% 3.7 7.1 −48% 5.3 8.0 −34%
Ophthalmology 4.6 3.6 26% 3.7 2.7 38% 1.9 3.9 −52% 2.2 4.0 −45% 2.6 3.7 −28%
Other 5.1 7.0 −27% 4.7 5.5 −15% 3.2 5.7 −44% 2.7 6.5 −58% 3.7 6.3 −41%
Other Injury 42.5 36.2 17% 41.3 38.7 7% 25.8 42.6 −39% 35.2 45.7 −23% 52.0 51.7 1%
Ear Nose Throat 21.3 23.4 −9% 20.3 22.6 −10% 13.9 22.8 −39% 7.4 23.7 −69% 8.1 22.8 −65%
Genito/Gynaecology 8.3 8.6 −3% 9.1 8.2 11% 4.8 7.9 −39% 5.2 7.7 −32% 6.4 8.4 −24%
Infectious Diseases 37.1 49.6 −25% 34.8 31.4 11% 20.7 32.3 −36% 7.5 26.7 −72% 10.7 28.5 −62%
General 10.4 7.9 32% 7.5 6.6 14% 4.5 7.0 −36% 4.9 7.5 −35% 7.5 7.8 −4%
Toxicology 2.8 2.4 20% 3.2 2.2 46% 2.3 3.5 −34% 1.5 2.6 −41% 2.4 2.8 −14%
Dermatology 10.6 10.0 6% 8.3 9.2 −9% 6.5 9.8 −34% 5.6 10.0 −44% 7.6 10.2 −26%
Surgical 7.3 7.4 −1% 7.0 7.4 −5% 5.1 7.5 −32% 5.2 7.9 −35% 6.6 7.1 −6%
Infancy Related 2.8 2.4 17% 2.9 3.0 −1% 2.1 3.0 −29% 1.9 2.9 −33% 3.0 3.0 1%
Respiratory 49.8 62.8 −21% 46.3 44.3 5% 38.8 53.3 −27% 9.7 41.3 −77% 7.4 35.6 −79%
Total 321.4 358.8 −10% 310.0 317.2 −2% 186.4 350.7 −47% 158.1 351.0 −55% 215.9 362.3 −40%
Attendance is mean daily visits for Dublin hospitals only as data on diagnosis not available for Regional hospitals; Table A1 is organised from the largest year on year drop in the Delay
phase to the lowest % increase/decrease (-) 2020 on prior years; Prior year 2018/2019 is average daily attendance for comparable period in 2018 and 2019.Int. J. Environ. Res. Public Health 2020, 17, 6719 20 of 24
Appendix C
Table A2. Mapping of Diagnoses, including Complex Chronic Conditions.
Infectious
Bronchitis, Bronchiolitis, Croup, Whooping cough, Asthma, Other Respiratory, Pneumonia, Cystic Fibrosis, Pneumothorax,
Respiratory Haemoptysis, Viral Induced Wheeze, Dyspnoea, Respiratory disorder, Respiratory arrest, Streptococcus pneumoniae, Pleurisy, LRTI,
URTI, Pertussis, Wheezing, Stridor, Pleural Effusion, Hay Fever, Aspiration, Chronic Lung Disease
Labrynthitis, Tonsillitis, Rhinitis, Sinus infection, Tinnitus, Eustachian tube disorder, Tonsillar Haemorrhage, Epistaxis, Sinusitis,
Ear Nose Throat Quinsy, Cervical lymphadenitis, Stomatitis, Post op tonsillar bleed, Sleep apnoea, Pharyngitis, Disorder of ear, Perforated eardrum,
Otitis media, Otitis Externa, Other ENT problem, Discharging ear, Nasal injury, Laryngomalacia, Mastoiditis, Laryngitis
Abdominal Pain, intestinal infection, Disease of digestive system, Gastroenteritis, Anal Fissure, Bleeding P.R., Oesophagitis, Crohn’s
Disease, Coeliac Disease, Constipation, Toddler’s Diarrhoea, Gastritis/enteritis, GORD, Gastro-oesophageal reflux, Threadworm,
Digestive Haematemesis, Hepatitis, Inflammatory Bowel Disease, Disease of intestine, Ulcerative colitis, Viral intestinal infection, Liver disease,
Acute pancreatitis, Haemorrhoids, Non-specific Abdominal Pain, Irritable bowel syndrome, Pancreatitis, Peptic Ulcer Disease, Cramp
and spasm, Mesenteric Adenitis, Other G.I.T., Dysphagia
Tuberculosis, Scarlet fever, Haemophilus influenzae, Bacterial infection unspecified, Varicella, Measles, Influenza, Herpes,
Gingivostomatitis, Mumps, Infectious mononucleosis, Other specified viral diseases, Viral infection, Candidiasis/Candida,
Infectious Disease Unspecified parasitic disease, Chicken Pox, Coxsackie disease, H1N1, Hand, Foot & Mouth Disease, Malaria, Viral Illness, Other,
Infectious Disease, Parvovirus, Pertussis, Roseola, Meningococcal infection, Meningitis, Pyrexia of unknown origin (PUO), Fever
without source/unspecified, Other Infection (various), Sepsis, Toxic Shock Syndrome
Trauma/Physical Activity
Injury: Fracture, Buckle Fracture, Bruise/Contusion/Haematoma, Amputation, Fingertip injury, Dislocation, Pulled Elbow, Query Fracture,
Fracture/Sprain/Dislocation/Bruise Nail bed injury, Subungual Haematoma, Sprain, Toddler’s Fracture, Salter-Harris I/II/III/IV, Sprain/Soft Tissue Injury
Concussion, Head Injury, Unspecified injury of head, Superficial injury of head, Trauma - Head/Brain, Abrasion, Change of Cast,
Tooth Avulsion, Bite, Burn, Scald, Stab Wound, Dental Injury, Chest Injury, Crush Injury, Trauma, fracture of tooth, Genital Trauma,
Other Injury: Head Injury, Burns,
Gunshot wound, Wound, Insect bite, RTA, Erythema, Laceration, Multiple injuries, Other Injury, Change of POP,
Lacerations, Other
Pneumothorax—Traumatic, Puncture Wound, Superficial injury, Open wound, Needlestick injuries, Scratch wound, Sting, Sunburn,
Removal of cast, Partial thickness burn
Apophysitis, Arthrosis, Back Pain, Baker’s cyst, Haemarthrosis, Discitis, Bursitis, Dysplastic/Dislocation Hip, Cauda Equina
Syndrome, Irritable Hip, Joint Pain, Limp, Plantar Fasciitis, Severs Disease, Synovitis, Disc Herniation, Myalgia, Effusion of joint,
Orthopaedic
Unspecified disorder of bone, Osgood Schlatter Disease, Osteomyelitis, Perthe’s Disease, Sacrococcygeal disorders, Other Orthopaedic
Problem, Ganglion, Trigger thumb, Tendonitis, Slipped capital femoral epiphysis, Orthopaedic follow-up care, Anterior Knee painInt. J. Environ. Res. Public Health 2020, 17, 6719 21 of 24
Table A2. Cont.
Personal Safety
Accidental Alcohol Poisoning, Accidental Domestic Poisoning, Accidental Drugs Poisoning, Accidental Farming/Gardening Product
Poisoning, Accidental Inhalation Poisoning, Accidental Other Poisoning, Accidental Paracetamol Ingestion, Alcohol Intoxication,
Alcohol Withdrawal, Alcoholism, Amphetamine Overdose, Anti-convulsant Overdose, Anti-depressant Overdose, Aspirin Overdose,
Carbon Monoxide Poisoning, Chemical Exposure, Deliberate Ingestion, Deliberate Inhalation, Food poisoning, Ingestion – Accidental,
Toxicology
Inhalation Injury, Other Sedative Overdose, Other Toxicology, Sting Insect Venomous, Aminophenol derivatives, Nonopioid analgesic,
Anaesthetic unspecified, Benzodiazepines, Other and unspecified drugs, Ethanol, Alcohol, Tricyclic Overdose, Noxious substance
eaten, Cocaine, Tricyclic Overdose, Head Shop Products, Overdose, Other Toxicology, Opioids, Ingestion deliberate, Deliberate Other
Poisoning
Abandoned Child, Social Problems, Alleged/Possible CSA, Alleged/Possible NAI, Sexual abuse, Alleged Assault, Physical Assault,
Child Protection/Assault
Rape/Sexual Assault
Foreign Body, Ingested Foreign Body, Foreign body in genitourinary, Foreign body in cornea, Surgical Foreign Body, ENT Foreign
Foreign Body
Body
Medical
Cellulitis, Eczema, warts, Scabies, Dermatitis, Other dermatology problem, Verruca, Erythema Multiforme, Herpes, Adverse Drug
Dermatology Reaction, Urticaria, Haemangioma, Molluscum contagiosum, Impetigo, Viral exanthem, Paronychia, Psoriasis, Rash, Shingles,
Scalded Skin Syndrome, Steven Johnson, Nail disorder, Tinea
Palpitations, Cardiac Arrest, Cardiac Arrhythmia, Heart Failure, Heart Murmur, Hypertension, Pulmonary Embolism,
Cardiac/Vascular S.V.T./Supraventricular tachycardia, Bradycardia, Cardiac other, Congenital heart disease, Congestive Heart Disease, Congestive
Heart Failure, Tachycardia
Known Addison’s Disease, DM 1 DKA, DM 1 with Hyperglycaemia, DM 1 with Hypoglycaemia, DM Known DKA, DM Known
Hypoglycaemia, DM New DKA, DM New Hyperglycaemia, DM New Hypoglycaemia, Known Diabetes Insipidus, Diabetes Mellitus,
Endocrine/Metabolic Hypoglycaemia, Hypercalcaemia, Hypernatraemia, Other Endocrine, Thyrotoxicosis, Disorder of adrenal gland, Metabolic disorder,
Fatty Acid Oxidation Disorder, Congenital Adrenal Hyperplasia, Galactosaemia, Hyperinsulism, Metabolic disease, Mitochondrial
Disorder Other, Metabolic Storage Disorder, Urea Cycle Defect
General Collapse, Nut Allergy, Egg Allergy, Fish Allergy, Allergic Reaction, Anaphylaxis, Other General, Costochondritis, Collapse,
Apnoea, Dehydration, Dental, Nausea and vomiting, Vaccination, Faint (vasovagal episode), Chest Pain, Faint (vasovagal episode),
General/Rheumatology
Enlarged lymph nodes, Temporomandibular joint disorder, Gingivo Stomatitis, Arthritis, Hyperventilation, Hypothermia, Kawasaki
Disease, Torticollis, Mouth Ulcers, Myositis, Oedema, Unspecified soft tissue disorder, Other General, Syncope, Osteoarthritis
Anaemia, Bleeding disorder, Henoch Schonlein Purpura, Leukaemia, Sickle-cell disorders, Allergic purpura, Agranulocytosis,
Idiopathic thrombocytopenic, Thrombocytopenia, Haemoglobinopathy, Space Occupying Lesion/Tumour, ITP, Other Haematology,
Haematology/Oncology
Haemophilia, Clotting Disorder, Neutropenia, Acquired haemolytic anaemia, Lymphadenopathy, Neoplasm, Oncology/Malignancy,
TumourYou can also read