Austin Community Foundation Mid-Year Market & Performance Update - August 2021 Helping Clients Prosper
←
→
Page content transcription
If your browser does not render page correctly, please read the page content below
Helping Clients Prosper

                    Austin Community Foundation Mid-Year Market
                    & Performance Update
                    August 2021
This report is intended for the exclusive use of clients or prospective clients of Fiducient
Advisors. The information contained herein is intended for the recipient, is confidential and
may not be disseminated or distributed to any other person without the prior approval of
Fiducient Advisors. Any dissemination or distribution is strictly prohibited. Information has
Disclosure been obtained from a variety of sources believed to be reliable though not independently
verified. Any forecasts represent future expectations and actual returns; volatilities and
correlations will differ from forecasts. This report does not represent a specific investment
recommendation. Please consult with your advisor, attorney and accountant, as appropriate,
regarding specific advice. Past performance does not indicate future performance and there
is a possibility of a loss.Market Themes
24
22.0
22 21.1
▐ Year-To-Date
20
QTD
18 17.5
16 15.0
14
Total Returns (%)
13.3
12 12.0
10.4
10 8.8
8.5 7.4
8
6.1 6.8
6
5.0 4.4
4 3.6 4.3
3.9 3.9
3.2
0.2 2.7 2.4
2 1.8
1.7 1.4
0.5 0.9
0
-2 -1.6 -1.8
-4 -3.0
TIPS Municipals 5- U.S. Core High Yield High Yield Foreign EM Debt U.S Large U.S. Small International Emerging U.S. Equity S&P Real Commodities Hedge
Year Bond Municipals Bond (Unhedged) Cap Cap Developed Markets REITs Assets Funds
*Hedge fund returns are lagged 1 month. Sources: FactSet, J.P. Morgan, Russell, MSCI, FTSE Russell, Alerian. Hedge Funds returns as of 5/31/21/21. All other returns as of 6/30/21.
Fixed Income Equity Real Asset / Alternatives
+ Interest rates moved lower at the longer end of the curve and + Optimism continued into the 2nd quarter as vaccinations + REITs continued to benefit from increasing demand and low
were slightly higher inside of 5-years. continue to progress and many restrictions were lifted across the interest rates.
country.
+ Investment grade and high yield spreads compressed during - Emerging market equities lagged their developed market + Commodities benefitted most from large increases in energy,
the quarter. counterparts as many developing countries struggled to control namely oil, although strong performance was broad based
Covid-19 outbreaks. across sectors.
See disclosures for list of indices representing each asset class. Past performance does not indicate future performance and there is a possibility of a loss.
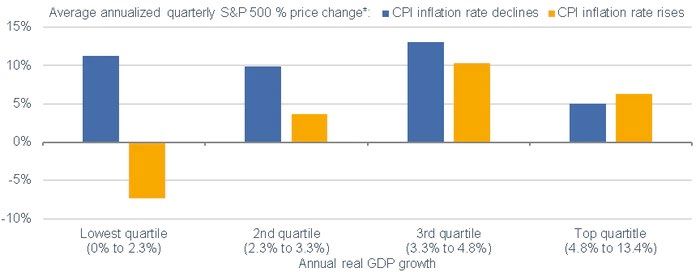
www.FiducientAdvisors.com 3Inflation Forces with Strong Economic Growth (1950 – March of 2021)
• When inflation rose, but economic growth was in its highest quartile, stocks not only rose; they rose at a
faster clip than when inflation was falling in that same growth zone.
• Above trend inflation is not necessarily detrimental to stock market returns if also accompanied by strong
economic growth
Low Growth High Growth
AND Higher AND Higher
Inflation. Inflation
Source: Charles Schwab, The Leuthold Group, 1950-3/31/2021. *Based only on economic expansions (all quarters when trailing y/y real GDP growth rate was positive). Past performance is no guarantee of future results.
www.FiducientAdvisors.com 4The Case For Diversification
2011 2012 2013 2014 2015 2016 2017 2018 2019 2020 YTD 10Yr (Ann)
TIPS Emerging Markets U.S. Small Cap U.S. Equity REITs U.S. Equity REITs U.S. Small Cap Emerging Markets High Yield Munis U.S. Large Cap U.S. Small Cap U.S. Equity REITs U.S. Large Cap
13.6 18.2 38.8 30.1 3.2 21.3 37.3 4.8 31.5 20.0 22.0 14.8
High Yield Munis High Yield Munis U.S. Large Cap High Yield Munis Municipals 5-Year High Yield International Dev. Municipals 5-Year U.S. Equity REITs U.S. Large Cap Commodities U.S. Small Cap
9.3 18.1 32.4 13.8 2.4 17.1 25.0 1.7 26.0 18.4 21.1 12.3
U.S. Equity REITs U.S. Equity REITs International Dev. U.S. Large Cap High Yield Munis U.S. Large Cap U.S. Large Cap Foreign Bond U.S. Small Cap Emerging Markets U.S. Small Cap U.S. Equity REITs
8.3 18.1 22.8 13.7 1.8 12.0 21.8 0.5 25.5 18.3 17.5 9.4
EM Debt
Core Bond International Dev. Balanced Core Bond U.S. Large Cap Commodities Core Bond International Dev. TIPS U.S. Large Cap High Yield Munis
(unhedged)
7.8 17.3 12.2 6.0 1.4 11.7 0.0 22.5 11.0 15.3 7.0
15.2
EM Debt
Municipals 5-Year Hedge Funds Balanced Core Bond Emerging Markets U.S. Small Cap TIPS Emerging Markets Balanced International Dev. High Yield
(unhedged)
6.9 9.0 5.1 0.6 11.2 14.6 -1.3 18.4 8.8 8.8 6.7
16.9
EM Debt
High Yield U.S. Small Cap High Yield U.S. Small Cap Hedge Funds Balanced High Yield Balanced International Dev. Hedge Funds Balanced
(unhedged)
5.0 16.3 7.4 4.9 -0.3 13.6 -2.1 17.5 7.8 8.4 6.6
9.9
Foreign Bond U.S. Large Cap U.S. Equity REITs TIPS International Dev. U.S. Equity REITs High Yield Munis Hedge Funds High Yield Core Bond Emerging Markets International Dev.
4.2 16.0 2.5 3.6 -0.8 8.5 9.7 -4.0 14.3 7.5 7.4 5.9
EM Debt
U.S. Large Cap High Yield Municipals 5-Year Hedge Funds TIPS Balanced Hedge Funds U.S. Large Cap Hedge Funds Balanced Hedge Funds
(unhedged)
2.1 15.8 0.8 3.4 -1.4 7.6 7.8 -4.4 7.1 7.1 4.7
13.5
Balanced Balanced Foreign Bond Municipals 5-Year Foreign Bond TIPS High Yield U.S. Equity REITs High Yield Munis High Yield High Yield Munis Emerging Markets
0.9 11.5 -1.0 3.2 -2.3 4.7 7.5 -4.6 10.7 7.1 6.1 4.3
EM Debt
TIPS Core Bond Foreign Bond Balanced Foreign Bond Foreign Bond Balanced Core Bond Foreign Bond High Yield TIPS
(unhedged)
7.0 -2.0 2.9 -3.3 3.2 6.5 -5.8 8.7 7.0 3.6 3.4
-1.8
EM Debt
U.S. Small Cap Foreign Bond Emerging Markets High Yield U.S. Small Cap High Yield Munis U.S. Equity REITs TIPS High Yield Munis TIPS Core Bond
(unhedged)
-4.2 5.3 -2.6 2.5 -4.4 3.0 5.2 8.4 4.9 1.7 3.4
-6.2
Hedge Funds Hedge Funds High Yield Munis Emerging Markets High Yield Core Bond Core Bond U.S. Small Cap Hedge Funds Municipals 5-Year Municipals 5-Year Foreign Bond
-5.7 4.8 -5.5 -2.2 -4.5 2.6 3.5 -11.0 7.8 4.3 0.2 2.9
EM Debt
Commodities Core Bond TIPS International Dev. Emerging Markets International Dev. Municipals 5-Year Commodities Commodities Core Bond Municipals 5-Year
(unhedged)
-13.3 4.2 -8.6 -4.9 -14.9 1.0 3.1 -11.2 7.7 -1.6 2.7
2.7
EM Debt EM Debt EM Debt EM Debt EM Debt
International Dev. Municipals 5-Year Hedge Funds TIPS International Dev. Foreign Bond Commodities
(unhedged) (unhedged) (unhedged) (unhedged) (unhedged)
-12.1 3.0 0.5 3.0 -13.8 6.3 -3.1
-9.0 -5.7 -14.9 -1.7 0.5
Emerging Markets Commodities Commodities Commodities Commodities Municipals 5-Year Commodities Emerging Markets Municipals 5-Year U.S. Equity REITs Foreign Bond Commodities
-18.4 -1.1 -9.5 -17.0 -24.7 -0.4 1.7 -14.6 5.4 -8.0 -3.0 -4.4
See disclosures for list of indices representing each asset class. Past performance does not indicate future performance and there is a possibility of a loss.
www.FiducientAdvisors.com 5Austin Community Foundation:
Performance Review – Long-Term Active
Year to
Performance Ending Last 12 Last Last Last
Q2 2021 Date
6/30/21 (Net of Fees) Months 3 Years 5 Years 10 Years
(6/30/21)
Long-Term Active
5.46% 10.15% 33.76% 11.92% 10.64% 7.10%
Investment Pool
Long-Term Active
Investment Pool Custom 5.22% 9.62% 30.04% 11.04% 10.24% 6.36%
Benchmark
Please reference the disclosures at the end of this presentation for additional information related to the material presented.Austin Community Foundation: Portfolio Snapshot
Long-Term Active
Total Current Strategic Target Over/ Under Weight
Asset Classes
Allocation Allocation Strategic Target
Cash 1.7% 2.0% -0.3%
TIPS 0.0% 0.0% 0.0%
Broad Domestic Bonds 10.3% 10.0% 0.3%
Dynamic Bonds 3.7% 4.0% -0.3%
Global Bonds 1.8% 2.0% -0.2%
High Yield Bonds 1.0% 1.0% 0.0%
Global Fixed Income & Cash Total 18.6% 19.0% -0.4%
Large-Cap U.S. Equity 22.3% 20.0% 2.3%
Mid-Cap U.S. Equity 5.3% 5.0% 0.3%
Small-Cap U.S. Equity 2.9% 3.0% -0.1%
International Equity 16.9% 17.0% -0.1%
Emerging Markets Equity 10.5% 10.0% 0.5%
US REITs 4.1% 4.0% 0.1%
Global Equities (Public) Total 62.1% 59.0% 3.1%
Broad Real Assets 3.1% 6.0% -2.9%
Real Assets Total 3.1% 6.0% -2.9%
Direct Hedge Funds 9.7% 10.0% -0.3%
Private Debt* 0.2% 1.0% -0.8%
Private Equity FOF** 6.3% 5.0% 1.3%
Alternatives Total 16.3% 16.0% 0.3%
Total Assets 100.0% 100.0% 0.0%
Please reference the disclosures at the end of this presentation for additional information related to the material presented.Austin Community Foundation:
Performance Review – Long-Term Passive
Year to Since
Performance Ending Last 12 Last Last
Q2 2021 Date Inception
6/30/21 (Net of Fees) Months 3 Years 5 Years
(6/30/21) (2/1/17)
Long-Term Passive
6.03% 10.93% 32.69% 11.81% N/A 11.55%
Investment Pool
Long-Term Passive
Investment Pool 6.02% 10.16% 32.56% 12.45% N/A 12.08%
Custom Benchmark
Please reference the disclosures at the end of this presentation for additional information related to the material presented.Austin Community Foundation: Portfolio Snapshot
Long-Term Passive
Total Current Strategic Target Over/ Under Weight
Asset Classes
Allocation Allocation Strategic Target
Cash 2.2% 2.0% 0.2%
TIPS 0.0% 0.0% 0.0%
Broad Domestic Bonds 16.6% 17.0% -0.4%
Foreign Bonds 0.0% 0.0% 0.0%
Emerging Market Bonds 0.0% 0.0% 0.0%
High Yield Bonds 0.9% 1.0% -0.1%
Global Fixed Income & Cash Total 19.7% 20.0% -0.3%
Large-Cap U.S. Equity 31.2% 31.0% 0.2%
Mid-Cap U.S. Equity 5.9% 6.0% -0.1%
Small-Cap U.S. Equity 3.9% 4.0% -0.1%
Developed International Equity 21.9% 22.0% -0.1%
Emerging Market Equity 12.2% 12.0% 0.2%
US REITs 5.2% 5.0% 0.2%
Global Equities Total 80.3% 80.0% 0.3%
Total Assets 100.0% 100.0% 0.0%
Please reference the disclosures at the end of this presentation for additional information related to the material presented.Austin Community Foundation:
Performance Review – Mid-Term Active
Year to Since
Performance Ending Last 12 Last Last
Q2 2021 Date Inception
6/30/21 (Net of Fees) Months 3 Years 5 Years
(6/30/21) (9/1/18)
Mid-Term Active
5.58% 8.42% 26.96% N/A N/A 11.19%
Investment Pool
Mid-Term Active
Investment Pool 5.30% 7.80% 24.72% N/A N/A 10.82%
Custom Benchmark
Please reference the disclosures at the end of this presentation for additional information related to the material presented.Austin Community Foundation: Portfolio Snapshot
Mid-Term Active
Total Current Strategic Target Over/ Under Weight
Asset Classes
Allocation Allocation Strategic Target
Cash 3.3% 2.0% 1.3%
TIPS 0.0% 0.0% 0.0%
Broad Domestic Bonds 19.2% 20.0% -0.8%
Dynamic Bonds 7.6% 8.0% -0.4%
Global Bonds 2.8% 3.0% -0.2%
High Yield Bonds 1.9% 2.0% -0.1%
Global Fixed Income & Cash Total 34.8% 35.0% -0.2%
Large-Cap U.S. Equity 23.6% 23.0% 0.6%
Mid-Cap U.S. Equity 5.0% 5.0% 0.0%
Small-Cap U.S. Equity 2.8% 3.0% -0.2%
Developed International Equity 16.6% 17.0% -0.4%
Emerging Market Equity 9.0% 9.0% 0.0%
Broad Real Assets 3.0% 3.0% 0.0%
US REITs 5.3% 5.0% 0.3%
Global Equities Total 65.2% 65.0% 0.2%
Total Assets 100.0% 100.0% 0.0%
Please reference the disclosures at the end of this presentation for additional information related to the material presented.Austin Community Foundation:
Performance Review – Mid-Term Passive
Year to Since
Performance Ending Last 12 Last Last
Q2 2021 Date Inception
6/30/21 (Net of Fees) Months 3 Years 5 Years
(6/30/21) (1/1/17)
Mid-Term Passive
5.18% 8.18% 24.72% 10.61% N/A 9.88%
Investment Pool
Mid-Term Passive
Investment Pool Custom 5.23% 7.72% 24.62% 11.02% N/A 10.31%
Benchmark
Please reference the disclosures at the end of this presentation for additional information related to the material presented.Austin Community Foundation: Portfolio Snapshot
Mid-Term Passive
Total Current Strategic Target Over/ Under Weight
Asset Classes
Allocation Allocation Strategic Target
Cash 2.4% 2.0% 0.4%
TIPS 0.0% 0.0% 0.0%
Broad Domestic Bonds 29.5% 30.0% -0.5%
Foreign Bonds 0.0% 0.0% 0.0%
Emerging Market Bonds 0.0% 0.0% 0.0%
High Yield Bonds 3.0% 3.0% 0.0%
Global Fixed Income & Cash Total 34.9% 35.0% -0.1%
Large-Cap U.S. Equity 24.9% 25.0% -0.1%
Mid-Cap U.S. Equity 5.0% 5.0% 0.0%
Small-Cap U.S. Equity 3.0% 3.0% 0.0%
Developed International Equity 17.8% 18.0% -0.2%
Emerging Market Equity 10.1% 10.0% 0.1%
US REITs 4.2% 4.0% 0.2%
Global Equities Total 65.1% 65.0% 0.1%
Total Assets 100.0% 100.0% 0.0%
Please reference the disclosures at the end of this presentation for additional information related to the material presented.CLOSING THOUGHTS
Robust First Half Returns Have Set the Bar High
• Double digit growth highlights strong economic recovery
• “Real” assets have rebounded with inflation expectations
Expectations Have Moderated, but Stocks Still Necessary for Long Term Investors
• Valuations drive long term returns – markets at new highs = challenge to maintain current pace of returns
• Stocks expensive relative to history, but bonds even more expensive
Tailwinds Persist, Headwinds Lurk
• Strong economic data and corporate earnings provide support to current prices
• Number of potential market moving events setup for Fall
• Delta Variant
• Political Policy – Infrastructure, Taxes, etc
• Bond Market Tapering
www.FiducientAdvisors.com 14DISCLOSURES All material and information is intended for DiMeo Schneider & Associates, L.L.C. business only. Any use or public dissemination outside firm business is prohibited. Information is obtained from a variety of sources which are believed though not guaranteed to be accurate. Any forecast represents median expectations and actual returns, volatilities and correlations will differ from forecasts. Past performance does not indicate future performance. This presentation does not represent a specific investment recommendation. Please consult with your advisor, attorney and accountant, as appropriate, regarding specific advice. When referencing asset class returns or statistics, the following indices are used to represent those asset classes. Each index is unmanaged and investors can not actually invest directly into an index: Cash - Citigroup 90 Day T-Bill; TIPS - Barclays US Treasury TIPS; Aggregate Bond - Barclays US Aggregate Bond Index; High Yield - Barclays US Corporate High Yield; Foreign Bond - Barclays Global Aggregate Ex USD; Emerging Debt - JPMorgan GBI-EM Global Diversified Unhedged Index; Large Value - Russell 1000 Value; Large Blend - S&P 500; Large Growth - Russell 1000 Growth; Small Value - Russell 2000 Value; Small Blend - Russell 2000; Small Growth - Russell 2000 Growth; International - MSCI EAFE; Emerging Markets - MSCI EM; REITs - FTSE NAREIT Equity REITs; Commodities - Bloomberg Commodity Index; MLP - Alerian MLP; Hedge Funds - HFRI Fund of Funds Composite Index; Balanced - 5% Barclays US Treasury TIPS, 10% Barclays US Aggregate Bond Index, 4.5% Barclays Global Aggregate Ex USD, 4.5% Barclays Global Aggregate Ex USD (Hedged), 9% Barclays US Corporate High Yield, 2% JPMorgan GBI-EM Global Diversified Unhedged Index , 16% S&P 500, 5% Russell 2000, 12% MSCI EAFE, 7% MSCI EM, 5% FTSE NAREIT Equity REITs, 5% Bloomberg Commodity Index, 5% Alerian MLP, 10% HFRI Fund of Funds Composite Index
You can also read