Automatic Ranking of Iconic Images
←
→
Page content transcription
If your browser does not render page correctly, please read the page content below
Automatic Ranking of Iconic Images

                      Tamara L. Berg                                            D. A. Forsyth
             University of California, Berkeley                   University of Illinois, Urbana Champaign
                   Berkeley, CA 94720                                         Urbana, IL 61801
                  millert@cs.berkeley.edu                                        daf@cs.uiuc.edu

                         Abstract                                     well, from a good aspect and in an uncluttered way, as an
                                                                      iconic image. We believe that such iconic representations
    We define an iconic image for an object category (e.g.            should exist for many categories, especially landmarks as
eiffel tower) as an image with a large clearly delineated             we study in this paper, because people tend to take many
instance of the object in a characteristic aspect. We show            photographs of these objects and among this large number
that for a variety of objects such iconic images exist and ar-        there will be many taken from similar characteristic views.
gue that these are the images most relevant to that category.            In this paper, we show that iconic images can be identi-
Given a large set of images noisily labeled with a common             fied rather accurately in natural datasets by segmenting im-
theme, say a Flickr tag, we show how to rank these images             ages with a procedure that identifies foreground pixels, then
according to how well they represent a visual category. We            ranking based on the appearance and shape of those fore-
also generate a binary segmentation for each image indi-              ground regions. This foreground/background segmentation
cating roughly where the subject is located. The segmenta-            also yields a good estimate of where the subject of the im-
tion procedure is learned from data on a small set of iconic          age lies.
images from a few training categories and then applied to
several other test categories. We rank the segmented test im-         1.1. Previous Work
ages according to shape and appearance similarity against
                                                                          There has been some previous work on automatically de-
a set of 5 hand-labeled images per category. We compute
                                                                      termining the subject of photographs. Li et al. [12] auto-
three rankings of the data: a random ranking of the im-
                                                                      matically determine the object of interest in photographs.
ages within the category, a ranking using similarity over the
                                                                      However, their focus is on images with low depth of field.
whole image, and a ranking using similarity applied only
                                                                      Banerjee and Evans [2] propose an in-camera main subject
within the subject of the photograph. We then evaluate the
                                                                      segmentation algorithm that uses camera controls to auto-
rankings qualitatively and with a user study.
                                                                      matically determine the subject. Since we collect our im-
                                                                      ages from the web we cannot use this method. The work
                                                                      most related to ours in this area is Luo et al. [13] who use
1. Introduction
                                                                      region segmentation and probabilistic reasoning to automat-
    There are now many popular websites where people                  ically determine subjects in unconstrained images, although
share pictures. Typically, these pictures are labelled, with          they do this in a very different manner than our method.
labels indicating well-known objects depicted. However,                   Segmentation is well studied and cannot be reasonably
the labellings are not particularly accurate, perhaps because         surveyed in the space available. Most related to our work
people will label all pictures in a memory card with a par-           are segmentation algorithms involving Markov Random
ticular label. This means, for example, that the photograph           field models dating back to Geman and Geman [7] and stud-
of the Eiffel Tower and a photograph of a friend taken in a           ied by many others since. We use a Markov Random field
nearby cafe will both have the label eiffel tower. Our                segmentation described by Boykov and Kolmogorov [4].
user study results show that about half of the pictures for the       This is an implementation of a min-cut/max-flow algorithm
categories we used on Flickr represent the category poorly.           to compute a two label segmentation efficiently.
    All this means that these collections are hard to use for             There has been extensive work on ranking images for
training object recognition programs, or, for that matter, as         content retrieval [1, 8, 11, 15] and on automatically re-
a source of illustrations, etc. We would like to rank such            ranking search results [5, 6, 14]. We focus on the area of
sets of images according to how well they depict the cate-            ranking iconic images and include a notion of where the
gory. We refer to an image that depicts a category member             object lies within the picture as an aid to doing this task.

                                                                  1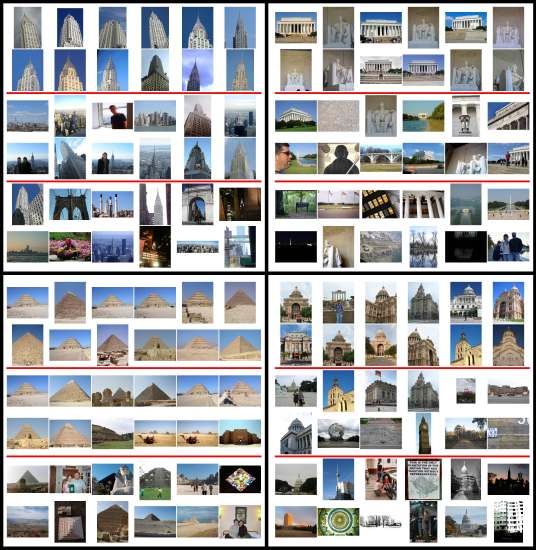
2. Computing Segmentations
                                                                       The goal of the segmentation portion of our method is
                                                                    to automatically detect the region of the image correspond-
                                                                    ing to the subject of the photograph. As such, we want to
                                                                    compute a binary segmentation of subject and background.
                                                                    Because this segmentation has only two labels we can use
Figure 1. Some example segmentations of photographs into object     a very efficient min-cut/max-flow algorithm developed by
and background labels. Our segmentation procedure is learned        Boykov and Kolmogorov [4]. Images are modeled as a
from a small set of 110 hand segmented iconic images from           Markov Random Field where for an image, each pixel cor-
a few training categories (eiffel tower, golden gate                responds to a node of the graph, with edges between each
bridge, colosseum and stonehenge). It is then applied               node and the source and sink nodes, as well as edges be-
to test images of previously unseen categories. While it is quite   tween the pixel and its four neighboring pixels in the image.
difficult to build a foreground/background segmentation algorithm
                                                                       Segmentation parameters are learned on a set of training
that works on all images in general, our segmenter works well on
iconic images with large, clearly delineated objects.
                                                                    images from 4 training categories and then applied to new
                                                                    images from test categories. The features used to compute
                                                                    our segmentations will be described in section 2.1 and com-
                                                                    puting the unary and binary potentials for the edge weights
Another related paper from Ke et al. [9] concentrates on the        will be described in section 2.2.
problem of ranking images according to their photographic
quality. This quality measure is somewhat related to our            2.1. Image Features
notion of iconic images which ideally should also be high
quality images.                                                         We compute 7 features describing each pixel: focus, tex-
                                                                    ture, hue, saturation, value, vertical position and horizontal
   Many people believe that segmentation and recognition
                                                                    position. These features were selected because we tend to
are linked in some natural way. There have been some pa-
                                                                    believe that the subject of a photograph is more likely to be
pers showing that segmentation can help improve recog-
                                                                    sharp, textured, more vivid in color and brighter than the
nition results. Barnard et al. [3] show that different pos-
                                                                    background. We also believe that the subject will be more
sible segmentations can be judged according to how well
                                                                    likely to lie in either the middle of the photo or be placed
they predict words for regions and that word prediction
                                                                    at one of the intersections suggested by the rule of thirds (a
can be improved by using these segmentations. Liebe and
                                                                    common rule of good subject placement in photographs).
Schiele [10] use segmentation as a way of integrating indi-
                                                                        Focus is computed in a 3x3 window around each pixel
vidual image cues and show that this multi-cue combination
                                                                    as the average ratio of high pass energy to low pass energy.
scheme increases detection performance compared to any
                                                                    Texture is also computed in a 3x3 window by computing
cue in isolation.
                                                                    the average texture response to a set of 6 bar and spot filters.
   We integrate aspects from all of these areas, automati-          Hue, saturation and value correspond to their respective val-
cally detecting the subject of photographs using segmenta-          ues at each pixel. Location for each pixel is represented as
tion methods and re-ranking images according to how well            its x location and y location divided by the image width
they represent a visual category.                                   and height respectively. Each of these features has a value
                                                                    ranging between 0 and 1.

1.2. Data                                                           2.2. Learning Potentials
   Our dataset consists of photographs collected from                   We use training data to learn how our features con-
Flickr for a set of 13 categories. We use all pub-                  tribute to the probability of subject versus background and
lic photos uploaded over a period of one year con-                  to the probability of a discontinuity between neighboring
taining that category in any associated text.    Each               pixel labels. We use 110 training images from 4 cate-
category contains between 4,000 and 40,000 images.                  gories (colosseum, eiffel tower, golden gate
Four categories are used for training our segmentation              bridge and stonehenge) that have been hand seg-
algorithm: colosseum, eiffel tower, golden                          mented into object and background. These training images
gate bridge and stonehenge. Nine categories are                     were selected to be highly iconic images with large, clearly
used for testing: capital building, chrysler                        delineated subjects.
building, empire state building, lincoln                                There are two types of potentials necessary for our seg-
memorial, sphinx, statue of liberty, sydney                         mentation algorithm. The unary potentials correspond to
opera house, taj mahal and pyramid.                                 the probability of a pixel being subject (edge weights be-
tween pixels and the source node) and the probability of a      compute is a random ranking of the images. The second
pixel being background (edge weights between pixels and         ranking uses similarity in appearance to the ground truth
the sink node). The second potential type are the binary po-    images for the appropriate category. The last ranking that
tentials between neighboring nodes. These correspond to         we compute uses our figure/ground segmentations to com-
the probability of the labels being the same between neigh-     pute similarity based on appearance and shape.
boring nodes.
   All feature vectors in the training images are clustered
                                                                3.1. Ranking Without Segmentations
together using k-means clustering with 1000 clusters. The
probability of subject and background, P (source|pixel)             To rank the images we use the same 7 dimensional fea-
and P (sink|pixel), are computed for each cluster as            ture vectors as used for segmentation. These vectors have
the percentage of training pixels within the cluster la-        some idea of color, location, focus and texture. For each
beled as object and background respectively. The prob-          training and test image we compute the average over all pix-
ability of two neighboring pixels having the same label,        els in the image of these feature vectors. The test images are
P (same|pixeli , pixelj ) where i and j are neighboring pix-    then compared to all training images using the normalized
els, is computed as the percentage of such occurrences given    correlation of their average feature vectors. The test images
the pixel’s cluster index and the neighboring pixel’s cluster   are ranked according to their maximum correlation value to
index.                                                          any training image.

2.3. Segmentation Results
                                                                3.2. Ranking With Segmentations
    For a test image, features are computed for each pixel.
These features are associated with the index of the closest         For our ranking with segmentation information we com-
cluster center. Each pixel then inherits the source and sink    pare test images to training images using similarity in shape
probabilities of its cluster index. Each pair of neighboring    and appearance. First the segmentation is run on all of the
pixels is assigned the pre-computed probability of having       training and test images.
the same label given their cluster indices. We compute the          Shape similarity between test and training images is
edges for the image’s graph as the logs of these probabili-     computed as the normalized correlation between their bi-
ties (where edges have symmetric weights) and run the min-      nary segmentation masks. This should give larger values to
cut/max-flow algorithm on them.                                 shapes that are more similar, though it is a somewhat rough
    We don’t expect the segmentation to work perfectly for      measure of shape similarity.
images in general as determining figure/ground segmenta-            Appearance vectors are calculated by taking the average
tions is quite a difficult task. However, by definition the     feature vector within the region marked as object. Appear-
images that are iconic should have a large object instance      ance similarity between two images is then computed as
in the midst of a fairly uncluttered background. Thus, these    the normalized correlation between average feature vectors.
images should be relatively easy to segment. As long as our     Because the appearance is computed only over the region
segmenter works on these images it should help to deter-        marked as object, this measure is more robust to changes
mine which of the large pool of images are the representa-      in background than the similarity computed for the ranking
tive ones.                                                      without segmentation.
    In figure 1 we show some segmentation results on 6 ex-          Test images are then ranked according to their maxi-
ample images. In each of these images the segmentation          mum correlation to any training image where correlation to
algorithm is able to automatically determine the subject of     a training image is computed as the sum of their appearance
the photograph. Doing this allows us to compute similarity      and shape correlations.
between images using the appearance of only those parts
of the image that correspond to the object of interest which
will be used in our ranking task, section 3.2. The segmenta-    4. Results
tion also gives us an idea of the support of the object which
is used to find objects with similar shapes.                        We have produced ranked results for 9 test categories.
                                                                We judge our rankings qualitatively by showing some
3. Ranking Images                                               highly ranked photos for our three methods. More results
                                                                of this nature can be viewed in the supplementary material
   For each test category we select 5 iconic ground truth im-   associated with our paper. We also judge our results quanti-
ages as training. We compute rankings against the training      tatively according to the results of a user study which com-
images using three alternative methods and compare their        pares the goodness of our top ranked images to top ranked
results. As a baseline computation, the first ranking that we   images ranked using the two alternative methods.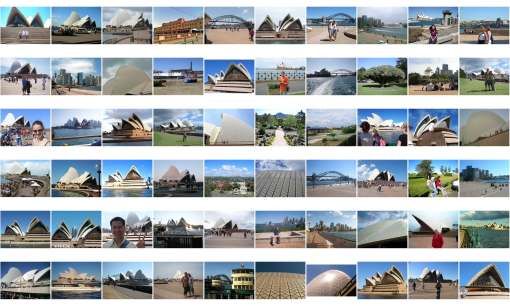
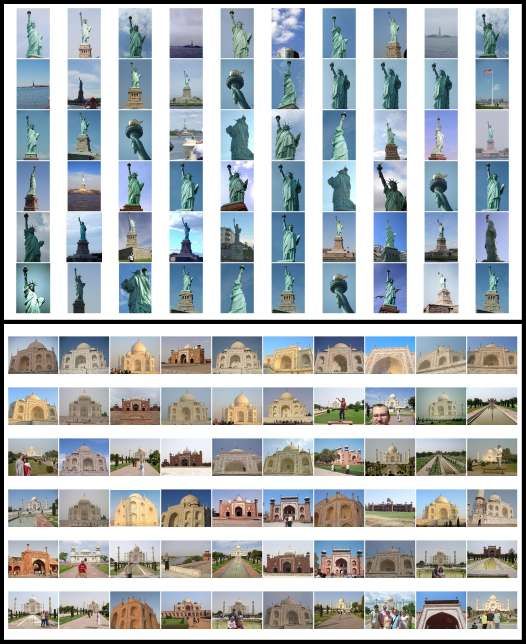
Figure 2. The top 60 ranked images (ranked left to right) for the statue of liberty and taj mahal categories. Several iconic
representations of the statue of liberty are highly ranked including the iconic torch. Images of the taj mahal are highly ranked despite color
variations. Some of the highly ranked buildings are incorrect, consisting of pictures of another (red) building on the taj mahal grounds
because this building is similar in appearance and shape. Errors like these might be difficult for non-domain experts to spot.
With Segmentation               Without Segmentation                     Random
             category       1s      2s       3s              1s       2s       3s             1s        2s         3s
             pyramid      0.7879 0.1919 0.0202             0.4242 0.3636 0.2121             0.2600    0.2300     0.5100
              lincoln     0.7273 0.2121 0.0606             0.4200 0.3000 0.2800             0.3061    0.2959     0.3980
             chrysler     0.6417 0.1917 0.1667             0.3000 0.3917 0.3083             0.2500    0.3083     0.4417
               statue     0.6364 0.2818 0.0818             0.4909 0.2545 0.2545             0.2110    0.3211     0.4679
                 taj      0.5152 0.2525 0.2323             0.4227 0.2784 0.2990             0.2727    0.2727     0.4545
              sphinx      0.3737 0.3232 0.3030             0.4286 0.3571 0.2143             0.1579    0.2316     0.6105
              sydney      0.2828 0.2929 0.4242             0.2900 0.2600 0.4500             0.2800    0.3300     0.3900
              capital     0.2653 0.1735 0.5612             0.1684 0.1474 0.6842             0.1250    0.1354     0.7396
              empire      0.1700 0.3300 0.5000             0.2300 0.2600 0.5100             0.1400    0.2800     0.5800
             average      0.4889 0.2500 0.2611             0.3528 0.2903 0.3569             0.2225    0.2672     0.5102

Table 1. Results of our user study. Users were asked to rate randomly sampled images the top 100 images for each type of ranking as to
how well they represented each category where 1 corresponded to “Very Well”, 2 “Moderately Well”, 3 “Poorly”, and 4 “Don’t know”.
The above numbers correspond to the percentage of each rating by the users for our ranking with segmentation (1st 3 columns), ranking
without segmentations (2nd 3 columns), ranking randomly (3rd 3 columns). As can be seen from the random results, almost half the
images collected from Flickr are judged to be poor representations of the category. So, being able to select the good images from among
these is an important task. Our ranking that incorporates segmentation information performs better than both a random ranking and the
ranking without segmentation on 6 of the 9 categories and does quite well on several of the categories (pyramid, lincoln memorial,
chrysler building, statue of liberty and taj mahal). For example, 79% of the top 100 rated pyramid images received
ratings that they represented the category “Very Well” and 73% of the top 100 lincoln memorial pictures were rated “Very Well”.
From these numbers we can see that segmentation makes a clear, obviously useful difference for our system. Other categories such as
the sydney opera house and the empire state building are more challenging because the object is often presented only in
cluttered scenes where a segmentation into figure/ground is quite difficult. None of the rankings perform very well on these images.

4.1. Ranked Images                                                    ings without segmentation (middle), and the random rank-
                                                                      ing (bottom) is startling. Our method is able to extract im-
    In figure 2 we show the top 60 ranked images (ranked left         ages containing iconic photographs of the building whereas
to right) for the statue of liberty and taj mahal                     the two other rankings show views where even if the build-
categories. These images have been ordered using our                  ing is present, it is present in a much less iconic context.
method of ranking which includes figure/ground segmenta-              The ranking without segmentation seems to select images
tion information. Many of the top ranked images from these            that have approximately the right overall make-up (when
categories correspond to good representations of the cate-            judged based on color for example), but since it is consider-
gory. Several of the highly characteristic aspects are rep-           ing the whole image equally it is not able to make the dis-
resented in these images including the highly iconic torch.           tinction between skyline images and iconic close up images
Images of the Taj Mahal are highly ranked by our system               containing only the Chrysler building.
despite color variations depending on time of day. A few of               Our rankings for the lincoln memorial and the
the highly ranked buildings are incorrect, showing images             pyramid category are also significantly better than those
of another (red) building on the Taj Mahal grounds. This              of the random ranking and the ranking without segmen-
building is highly ranked because it has a very similar ap-           tation. For the lincoln memorial category, we are
pearance and shape. Errors like these might be difficult for          able to rank multiple characteristic aspects (both the out-
non-domain experts to spot.                                           door view of the memorial building and the inside view of
    In figure 3 we show the top ranked images using segmen-           Lincoln’s statue). Even though the method of ranking with-
tation, the top ranked images without using segmentation,             out segmentation was presented with the same training im-
and the top images for a random ranking of the images (sep-           ages it still produces a much less compelling ranking. This
arated by red lines). The four quadrants each show a differ-          is true for the pyramid category as well.
ent test category where the upper left contains images from               Capital building was our most muddled category.
the chrysler building category, the upper right the                   This was partially due to the fact that during collection we
lincoln memorial, the lower left the pyramid cate-                    had in mind images depicting the U.S. Capitol building in
gory and the lower right the capital building cate-                   Washington D.C., but incorrectly spelled the query as capi-
gory.                                                                 tal building. The term capital building can be used to refer
    For the chrysler building category the difference                 to any state (etc) capital building. Therefore, the images
between our ranking including segmentation (top), the rank-           collected tend to depict different capitals from around the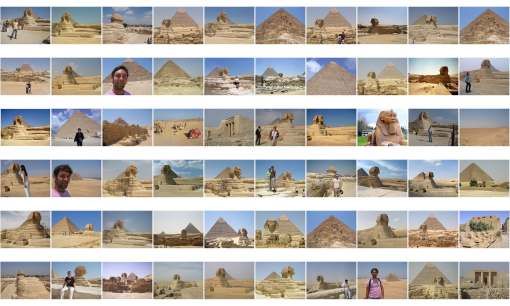
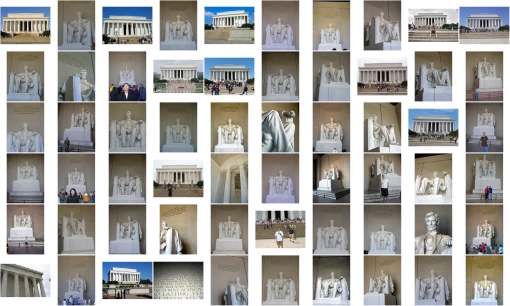
Figure 3. Each quadrant contains images from a category of objects ranked in three ways (separated by red lines): by our system using
appearance and shape of segmented objects, by a ranking using appearance similarity across the whole image, and by a random ranking
of images within the category. The upper left quadrant contains images from the chrysler building category, the upper right
the lincoln memorial category, the lower left the pyramid category, and the lower right the capital building category.
Notice that our system performs quite favorably compared to the appearance and random based rankings. For some categories (chrysler
building, pyramid, lincoln memorial) it does quite well. Notice that for the lincoln memorial class we are able to rank
multiple characteristic aspects (both the outdoor view of the Memorial and Lincoln’s statue). The ranking without segmentation performs
much less favorably on this category because it has no information about what areas of the image need to be similar (the regions containing
the object) and which can vary (background). This is also true for the chrysler building in which the ranking without segmentation
seems to pick images based on their color similarity rather than images that share a common object. Even for the somewhat ill-defined
capital building category, our system finds domed buildings, many of which are capital buildings of various locations.
globe including the Wisconsin, and Texas capital buildings.      as 1s). For our ranking including segmentation versus the
Many of these buildings actually have similar shapes to the      ranking without segmentation, t is calculated to be 1.6429,
U.S. Capitol building and so are hard to distinguish. As can     giving about a 7% chance of observing these results if the
be seen in figure 3 the top images ranked for this category      means were actually equal. For the our ranking with seg-
don’t all depict the U.S. Capitol building, but do tend to be    mentation versus the random ranking, t is calculated to be
photographs of quite similar looking domed buildings.            3.05 or about a 3% chance of observing these results given
                                                                 equal means. This suggests that the difference between our
4.2. User Ranking                                                ranking and the two alternative methods is a statistically sig-
                                                                 nificant difference.
    We also judge our performance based on user ratings.
                                                                    Some comments that the users had were related to the
Twenty-three volunteers (mostly graduate and undergradu-
                                                                 confusion in exactly what the definition of a category is.
ate students) with no idea of the purpose of the experiment
                                                                 They were presented with just the category name and so
were asked to label a random selection of images sampled
                                                                 some were unsure how to rate images showing other ver-
from the top 100 images from each type of ranking. For
                                                                 sions of the category than the standard meaning (e.g. pho-
each image, the user was asked to label it according to how
                                                                 tographs of a sphinx house cat in the sphinx category).
well it represented a category, where 1 corresponds to a rat-
                                                                 There was also much confusion about the capital build-
ing of “Very Well”, 2 to “Moderately Well”, 3 to “Poorly”,
                                                                 ing category mostly because of the capitol, capital problem
and 4 to “Don’t Know”. Besides the written instructions we
                                                                 mentioned previously. Most users labeled images with the
also provided a visual aid of several example images from a
                                                                 U.S. capitol building in mind rather than the broader defini-
training category, eiffel tower, labeled as 1, 2 or 3.
                                                                 tion of capital building.
    We show the tallied results for each of the three rankings
in table 1. For each ranking method and for each category,
the table shows the percentage 1s, 2s, and 3s assigned to the    5. Conclusion & Future Work
top 100 images from that ranking.                                    We have shown that it is possible to rank images accord-
    According to the numbers for the random ranking, about       ing to how well they represent a given category. We use the
50% of the images that we collected from Flickr are judged       fact that iconic representations of a category should appear
to be poor examples of the category name. Being able to          with high frequency and similar appearance in a set of im-
automatically select the high quality images from this noisy     ages linked by the fact that they have all been associated
set is an important and nontrivial task.                         with a common label (Flickr tag). We have also demon-
    If we measure performance as the percentage of the           strated that incorporating a rough idea of where the object
100 top-ranked images that received a rating of 1, then          is located in the image can improve our performance signif-
we see that our ranking with incorporated segmentation           icantly.
information performs better than both a random rank-                 The user comments we received reinforce the fact that
ing and the ranking without segmentation on 6 of the 9           notion of a category is a confusing and slippery thing. More
test categories. We do quite well on several of the cat-         study should be put into determining what is meant by a
egories (pyramid, lincoln memorial, chrysler                     category.
building, statue of liberty and taj mahal).
                                                                     For future work we would like to rank images in a com-
For example, 79% of our 100 top-ranked pyramid im-
                                                                 pletely unsupervised manner. We tried various methods of
ages receive ratings indicating that they represent the cate-
                                                                 ranking including clustering and ways to select ground truth
gory “Very Well” and 73% of our 100 top-ranked lincoln
                                                                 images according to how iconic they seemed or how simi-
memorial pictures are rated “Very Well”. From these fig-
                                                                 lar they were to the bulk of images. None of our attempts
ures we can see that segmentation makes a clear, obviously
                                                                 were successful and seemed to indicate that this is a harder
useful difference for our system.
                                                                 problem than it might seem. One last thing we would like to
    Other categories such as the sydney opera house and the      work on is some functional definition of iconicness accord-
empire state building are more challenging because the ob-
                                                                 ing to perceptual cues of figure/ground like surroundedness
ject is often presented only in cluttered scenes where a seg-    and above/below.
mentation into figure/ground is quite difficult. None of the
rankings perform very well on these images.
    We use a t-test to determine whether the difference in       References
sample means is significant for the three different ranking       [1] J. Bach, C. Fuller, R. Humphrey, and R. Jain. The virage
methods. The t-test is calculated as the ratio of the differ-         image search engine: An open framework for image man-
ence between the sample means to the variability of the val-          agement. In SRIVD, 1996. 1
ues. We compute this for the average percentage of images         [2] S. Banerjee and B. Evans. Unsupervised automation of pho-
ranked as representing the category “Very Well” (labeled              tographic composition rules in digital still cameras. In Conf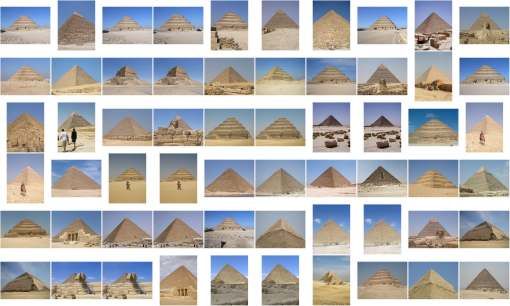
on Sensors, Color, Cameras and Systems for Digital Photog-
raphy, 2004. 1
[3] K. Barnard, P. Duygulu, R. Guru, P. Gabbur, , and D. Forsyth.
The effects of segmentation and feature choice in a transla-
tion model of object recognition. In CVPR, 2003. 2
[4] Y. Boykov and V. Kolmogorov. An experimental comparison
of min-cut/max-flow algorithms for energy minimization in
vision. PAMI, Sept. 2004. 1, 2
[5] R. Fergus, L. Fei-Fei, P. Perona, and A. Zisserman. Learning
object categories from google’s image search. In ICCV, Oct.
2005. 1
[6] R. Fergus, P. Perona, and A. Zisserman. A visual category
filter for google images. In ECCV, May 2004. 1
[7] S. Geman and D. Geman. Stochastic relaxation, gibbs dis-
tributions and the bayesian restoration of images. PAMI,
6:721–741, 1984. 1
[8] T. Gevers and A. Smeulders. Content-based image retrieval
by viewpoint-invariant color indexing. In IVC, 1999. 1
[9] Y. Ke, X. Tang, and F. Jing. The design of high-level features
for photo quality assessment. In CVPR, 2006. 2
[10] B. Leibe, K. Mikolajczyk, and B. Schiele. Segmentation
based multi-cue integration for object detection. In BMVC,
2006. 2
[11] J. Li and J. Wang. Automatic linguistic indexing of pictures
by a statistical modeling approach. PAMI, pages Vol 25, no.
9, 1075–1088, 2003. 1
[12] J. Li, J. Wang, R. Gray, and G. Wiederhold. Multiresolution
object-of-interest detection of images with low depth of field.
In CIAP, 1999. 1
[13] J. Luo, S. Etz, A. Singhal, and R. Gray. Performance-
scalable computational approach to main subject detection
in photographs. In HVEI VI, 2001. 1
[14] S. Tong and E. Chang. Support vector machine active learn-
ing for image retrieval. In ACM multimedia, 2001. 1
[15] R. Veltkamp and M. Tanase. Content-based image retrieval
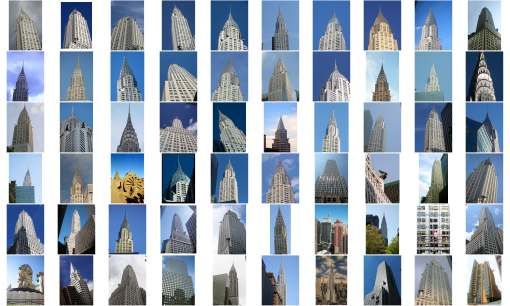
systems: A survey. In T.R. Utrecht University, 2000. 1Figure 4. The top 60 ranked images (ranked left to right) for the chrysler building and lincoln memorial categories.
Figure 5. The top 60 ranked images (ranked left to right) for the sphinx and pyramid categories.
Figure 6. The top 60 ranked images (ranked left to right) for the sydney opera house and capital building categories.
You can also read