Banco Santander Chile - Institutional Presentation - June 2019 - Santander Chile Investor ...
←
→
Page content transcription
If your browser does not render page correctly, please read the page content below
Banco
Santander
Chile
Institutional Presentation

June 2019

 1
AGENDA

 CHILE: A STABLE AND DIVERSIFIED COUNTRY

 SOUND FINANCIAL SYSTEM WITH GROWTH POTENTIAL

 SANTANDER CHILE: A LEADING BANK

 ADVANCES ON OUR STRATEGIC OBJECTIVES

 2
 1

Chile: A Stable and Diversified Country

 DID YOU KNOW…? DEMOGRAPHICS CULTURE
 Chile is one of the longest There are 18.8 million
 countries in the world, Chile is known as the land of
 Chileans.
 spanning 4,620 kilometers, poets, having various Nobel
 with a width of just over 150 Prize Winners, including
 85% of the country’s population Gabriela Mistral (the first Latin
 km. lives in urban areas. America Nobel Prize of
 The Andes mountains trace the Literature) and Pablo Neruda.
 entire length of Chile, covering
 5.6 million people live in the Isabel Allende is a Chilean
 capital, Santiago. writer, famous for novels that
 approximately 80% of its
 surface. fuse autobiographical and
 There are 127 per 100 magic realism aspects.
 Easter Island, one of the most inhabitants that have cellphone
 remote communities in the subscriptions. Soccer is the most popular
 world, is Chilean. sport in Chile. Arturo Vidal &
 Between 2014 and 2017, Alexis Sánchez are currently
 Atacama Desert in the North is inmigration increased by the most famous players
 the driest place on Earth. 232%, coming especially from
 Haiti and Venezuela.
 Chile’s North experiences more
 than 200 cloudless nights a Estimated life span is 79.1
 year, providing clear skies for years.
 some of the largest telescopes
 in the world. The literacy rate for the
 population is 97.5%.
 Puerto Williams is the
 southernmost permanent Chile has the lowest amount of
 human settlement in the population below the poverty
 world. line in Latin America, reaching
 3
 8.6% in 2017. 2
Chile: A Stable and Diversified Country

 Our main trade partners are China and USA
 Exports: US$69 billion Imports: US$75 billion
 Chemicals Petroleum & diesel
 #4 Forestry & 8% Agriculture/ 10%
 pulp Silviculture
 Other food 10% 2%
 & drinks
 5%
 By Products

 By Products
 Wine
 #5 3%
 Copper
 Salmon 52%
 #4 7% Industry
 #1 88%
 Agriculture
 10% Other
 minerals
 5%
 Exporter ranking in the
 world Japan
 4%

 Rest China
 By Country

 Mercosur
 26% 34% By Country 18%
 China
 Japan 32% USA
 9% 25%
 Eurozone
 USA
 14% Eurozone
 17%
 21%
 4
 3
 1. Source: Banco Central de Chile(BCCh), Dec. 2018
Chile: A Stable and Diversified Country
 Diversified economy and high sovereign rating
 Chile: Key economic indicators1,2 Chile’s economy is well diversified1
 GDP by economic sector, %
 Population: 19.1mn 4% 2% Mining
 4.5% Manufacturing
 GDP3: US$296bn 11% Public services
 GDP per capita (PPP): US$15,780 11% Construction
 Commerce
 Exports / GDP: 25% 3% Trans & Comm
 Investment / GDP : 23% 37% 7% Service
 Net public debt / GDP: 8% Public admin.
 10%
 9% Fishing & agriculture
 JCR: AA- / Mdy: A1/ SP: A+/
 Others
 Sovereign ratings: Fch: A

 Low public debt3,4 High sovereign rating5
 Gross public debt, % GDP
 USA
 Australia
 104 UK
 70 Chile
 53 China
 27 Japan
 Mexico
 Peru
 Chile Adv. Econ. Latam EM Brazil
 Ba2 Ba3 Baa3 Baa2 Baa1 A3 A2 A1 Aa3 Aa2 Aa1 Aaa

 5
 4
1. Source: Central Bank of Chile, BCCh, and IMF. 2. Source: International Monetary Fund, 10/2017. 3. Source: Central Bank of Chile, Dec. 2018
 4. Source: World Bank, Current international dollar 5. Source: Moody’s

Chile: A Stable and Diversified Country
 GDP growth expectations
GDP Investment
 YoY real growth of fixed capital formation, %
 YoY real growth, %

 4.0 4.7 4.2 4.8
 3.2
 2.4
 1.6 1.5

 -1.3
 -2.7
 2016 2017 2018 2019 (e) 2020(e) 2016 2017 2018 2019 (e) 2020 (e)

Inflation Central Bank ST Reference Rate
Annual change in UF inflation, % %

 3.50
 2.9 2.9 2.50 2.75
 2.8 2.5 2.00 2.25
 1.7

 2016 2017 2018 2019 (e) 2020 (e) 2016 2017 2018 2019 (e) 2020 (e)
 6
 5
 Source: Banco Central de Chile and estimates Santander Chile

Chile: A Stable and Diversified Country
 …with a pick up in investment in various sectors
 Five year investment portfolio Growth by Sectors (YoY growth, %)
 US$bn 2017 2018 2019 (f) 2020 (f)
 120
Millares

 Agro/Fishing 1.8 5.7 -0.5 3.3
 100 Mining -1.8 5.2 -1.2 1.2

 80 Manufacturing 1.8 3.9 0.3 1.7

 Construction -3.2 3.2 3.6 5.2
 60
 Utilities 5.6 5.0 3.0 2.9
 40 Commerce 2.6 5.0 3.3 4.0

 20 Transportation 2.0 4.4 3.9 3.3

 Communications 3.4 4.7 3.1 3.1
 0
 1Q13 1Q14 1Q15 1Q16 1Q17 1Q18 1Q19 Services 1.2 3.6 3.4 3.4
 Mining Public Infrastructure
 Public Admin. 2.0 1.1 2.5 3.1
 Energy Real State
 Other GDP 1.3 4.0 2.7 3.2

 7
 Source: Central Bank of Chile / Corporación de Bienes de Capital and estimates Santander Chile 6
Chile: A Stable and Diversified Country
 Development of Chilean democracy has led to solid nation

 Late 19th
 1810 century 1970 1973 1982 1988 1990’s 2010 2018
 ……………………………………………………………………………………………………………..………………………………………….….

Chile becomes Large- Salvador Hyperinflation, Chile suffers General Rapid economic Chile is hit Today,
 an scale Allende is no foreign one of the Pinochet growth during by one of Chile is
 independent mining of elected as reserves and worst economic loses the 1990’s. the biggest considered
 country from nitrate President. Social GDP decline crisis after referendum Inflation was earthquakes South
 Spain and C
 spending leads to a neoliberal and steps stabilized and of 8.8 America’s
 copper increases, constitutional economic down in 1990 trade magnitude, most stable
 begins. especially in crisis. On policies are put as head of liberalization and by a and
 housing, September 11, in place. The state. policies were put tsunami prosperous
 education and the Chilean government in place, enabling immediately country.
 health, with an military stages a bails out five Chile to integrate after.
 effort to coup against banks and to the global
 redistribute Allende, dissolves three economy.
 wealth. The enforcing a others.
 country’s basic military
 resources are dictatorship.
 nationalized. General
 Augusto
 Pinochet is later
 proclaimed as
 President.

 8
 7
AGENDA

 CHILE: A STABLE AND DIVERSIFIED COUNTRY

 SOUND FINANCIAL SYSTEM WITH GROWTH POTENTIAL

 SANTANDER CHILE: A LEADING BANK

 ADVANCES ON OUR STRATEGIC OBJECTIVES

 9
 8
Sound Financial System with Good Growth Potential
 Solid Financial System
 87%
 As of Dec. 2018 Ch$ bn US$ bn Of total
 25 19 loans in Top
Assets 246,265 354.0 Banks in Banks in 6 banks
 financial Increased financial
Loans 178,578 256.3 system Concentration system
 93%
Deposits 138,924 199.1 2009 2018 Of total
 deposits in
Equity 20,736 29.7 Top 6 banks
Net income 2,395 3.4 Evolution of Return on Equity (%)
NIM 3.9% 34.85
Cost of credit 1.1%
NPL ratio 1.9% 21.62
 18.15
 16.35
Coverage ratio 128.4%
 17.99 17.50
Efficiency ratio 50.9% 14.18
 11.55
ROAA 1.0%
ROAE 12.5% 2009 2010 2011 2012 2013 2014 2015 2016 2017 2018
Core capital 10.7%
 Chilean banking system Santander
BIS ratio 13.3%
 No banking crisis in Chile since the beginning of the
 1980’s thanks to prudent regulations and strong
 supervisory bodies. 10
 11
Source: Chilean Banking Regulator (CMF)
Sound Financial System with Good Growth Potential

 The main figures of the banking system
 Loan Market Share1 Deposit Market Share1
 18.4% 17.3% 17.9% 18.1% 16.7%
 14.0% 14.0% 13.5% 12.6% 12.0%
 9.9%
 8.3%

 Return over Average Equity1 Net Interest Margin1,2
 18.2% 17.6% 4.1% 4.3%
 14.9% 15.1% 3.6% 3.5% 3.8% 3.4%
 11.5%
 4.8%

 Return over Average Assets1 Efficiency1,3
 1.6% 62.1%
 1.5% 55.6%
 44.8% 45.9% 49.2%
 1.0% 1.1% 41.4%
 0.5% 0.5%

 11
1. As of June 2019. Source: CMF 2. NIM: Net interest margin divided by average interest earning assets. Efficiency ratio: Oper. Expense excluding impairment / 12
Net interest income + fee income + financial transactions, and Other operating income, net
Sound Financial System with Good Growth Potential

 Developed banking system with high growth potential
 Loans to GDP, 2018 (%)1
 145
 87

 1 47 60 49 42 36
 2 40
 High Chile Brasil Colombia Peru Mexico
 income

 1 Loans to companies over GDP 2 Loans to individuals over GDP
 The large corporates make up around 1% of all the The mortgage market is deep in Chile and many
 companies, but have 80% of the total debt. households have long-term stable debt.

 Commercial lending by type of client Individual loans penetration2
 1.4
 3.5
 15%
 79.3
 95.1
 5% 16%
 25%
 8.0 9%
 12.7 3%
 % of number of debtors % of total debt Chile Mexico Brazil
 Mortgage Consumer
 SME Middle-market Corporates
 Source: SBIF, 2018 12
1. Or latest available information. Source: World Bank, weighted by size of world 2. Sources: for Chile: SVS, SBIF and SVS; for Mexico: Comisión Nacional
economies. Chilean loan include bank and non-bank lending. Source Chile: Santander Chile Bancaria y de Valores; for Brazil: IBGE 9
based on information from SBIF, BCCh, CMF and Superintendency of Social Security.
Sound Financial System with Good Growth Potential

 Loans multiplier of 1.4x

 Loan growth multiplier1
 4.0

 3.5

 3.0

 2.5 AVG:1.4x
 Elasticity = 1.6x
 2.0 Elasticity = 1.3x
 2012 - 2015
 2016 - 2018
 1.5

 1.0 Elasticity = 1.2x
 2010 – 2011
 0.5

 0.0

 -0.5
 2010 2011 2012 2013 2014 2015 2016 2017 2018

 Loans should continue to grow 1.4 times GDP

 13
 10
1. Calculated using nominal loan growth per year over nominal GDP growth per year. Source: SBIF and Central Bank
Sound Financial System with Good Growth Potential Household debt rising but still low compared to other nations Household debt to disposable income, % Household debt to disposable income, % 80 70 250 60 200 50 150 40 30 100 20 50 10 0 0 06 07 08 09 10 11 12 13 14 15 16 17 18 Q1-2007 Q1-2008 Q1-2009 Q1-2010 Q1-2011 Q1-2012 Q1-2013 Q1-2014 Q1-2015 Q1-2016 Q1-2017 Consumer loans to disposable income Australia Chile Canada Czech Republic Mortgage loans to disposable income France Ireland Germany Slovenia Sweden United States Household debt to disposable income has been increasing, but remains at low levels compared to other countries. 14 Source: Banco Central de Chile 19
Sound Financial System with Good Growth Potential
 Mortgage penetration is still rising but is also still low
Mortgage loans to GDP OECD sample Real estate price indexes
 % Yearly growth of moving average last four quarters, %
120 12

100
 9

 80
 6

 60

 3
 40
 Repeat sale index
 0 Stgo Price Index
 20
 Chilean construction chamber index

 0 -3
 TUR

 FRA

 SWE
 PER

 CZE
 SVN

 SVK

 EST

 BEL

 ESP
 LUX
 COL

 IRL

 NLD
 ROU

 LVA
 CHL

 GRC

 NOR
 RUS
 URY

 BOL
 ARG
 PRY

 BRA

 HRV
 HUN

 POL

 AUT

 PRT
 GBR

 DNK
 ECU

 BGR

 LTU

 ITA

 DEU
 MLT

 USA
 FIN

 -6
 09 10 11 12 13 14 15 16
 Source: Central Bank of Chile Financial Stability Report IIH 2018, XXIX
 Reunión de Presidentes de los Bancos Centrales de América del Sur,
 McKinsey Global Institute y European Mortgage Federation. 1. VW-ARS estimator presented in Shiller (1990). Four-quarter moving
 average of the index's growth rate is shown. Areas indicate 95%
 confidence intervals of significance

 Source: Banco Central de Chile and Chilean Internal Revenue Service

 Mortage loans to GDP have been rising but are still low compared to other OECD countries.

 Real estate prices accelerated after the earthquake in 2010 and before the VAT was applicable to the sale of used properties in 2016.

 15
 18
 Source: Banco Central de Chile; Financial Stability report 2S2018
Sound Financial System with Good Growth Potential
 High growth of middle income population with increasing
 importance of Millennials
 Population Distribution by Income
 Middle-class: %
 2 3 6 6 7
 highest 8 12
 22 27
 growing 38
 48
 segment, and 62
 35 65
 should reach 40 78
 over 16 million 39
 37
 by 2029 41
 30 27 24
 18
 9 4 3 9
 0
 1987 1990 2000 2009 2015 2017 2029(f)
 Below poverty line Low-income Middle-class High-income
 Millennials: Population Distribution by Age
 4 million
 Millennials: 4
 individuals or
 million
 over 20% of
 the total
 population

 0-4 10-14 20-24 30-34 40-44 50-54 60-64 70-74 80-84 90-94
 16 >100

 Population growth as estimated by Santander. Population distribution in accordance with 2017 census as reported by the National Institute of Statistics.
Sound Financial System with Good Growth Potential
 Asset quality has been stable despite increasing regulation and
 market shocks in the region
All financial institutions regulated by the CMF (previously the SBIF) use Chilean Bank GAAP as the accounting standard. The main
difference to other accounting standards is that under Chilean Bank GAAP, loan loss allowances are calculated based on specific
guidelines set by the local regulator, using an expected loss approach. Through the years, the local regulator has been updating their
standardized provisioning models, becoming more conservative. To date, the local regulator has announced that it will not be adopting
IFRS 9.
 Total loans: Non-performing loans (NPL) and coverage (%)
 134%
 136%
 123% 125% 123%
 121%
 107% 2016: Standard
 Economic Crisis provisioning model
 US and Europe 92% 2014: Changes to for mortgages (B1).
 89%
 84% provisioning Higher provisioning
 73% models: Consumer for LTV > 90%
 and Commercial
 2016-2017 GDP
 growth slowdown in
 Sept 2015 Earthquake in Chile
 2.8% 2.9% 2.7%
 Coquimbo Chile- 8.3Mw
 2.6%
 Feb 2010 Earthquake in 2.1% 2.0% 2.0% 1.8% 2.0% 1.9%
 Maule Chile- 8.8Mw 1.7%
 and destructive Tsunami April 2014 Earthquake in
 Iquique Chile- 8.2Mw
 dic-09

 dic-10

 dic-11
 mar-12

 dic-12

 dic-13

 dic-14

 dic-15

 dic-16

 dic-17
 mar-09

 mar-10

 mar-11

 mar-13

 mar-14
 jun-14

 mar-15

 mar-16

 mar-17

 mar-18
 jun-09

 jun-10

 jun-11

 jun-12

 jun-13

 jun-15

 jun-16

 jun-17

 jun-18
 sep-16
 sep-09

 sep-10

 sep-11

 sep-12

 sep-13

 sep-14

 sep-15

 sep-17

 sep-18
 NPL (1) Coverage (2)
 17
 22
1. Loans with 90 days or more overdue. 2. Stock of provisions divided by NPLs. Source: SBIF
Sound Financial System with Good Growth Potential

 Competition has been consolidating throughout the years
 Total loans to clients by bank
 Santander
 BCI
 Banco de Chile Santander’s
 growth has been
 Itaú Corpbanca organic
 Scotiabank throughout the
 years, but
 recently
 acquired
 Santander
 Consumer Chile,
 an autofinancing
 Banco Ripley company.
jun-2013 jun-2014 jun-2015 jun-2016 jun-2017 jun-2018 jun-2019 …
 2013 2015 2015 2016 2018 2018 2018 2018

Ripley moves Scotiabank BCI acquires Itaú acquires BCI buys over Scotiabank BCI acquires Falabella will
its credit card buys City National Corpbanca, Walmart’s acquires TotalBank in moves its
business into Cencosud’s in Florida, becoming credit card BBVA Florida, USA CMR credit
 Banco Ripley credit card USA Itaú business card business
 business Corpbanca into Banco
 Fallabella
 18
 14
Sound Financial System with Good Growth Potential
 Strong presence of institutional investors that provide liquidity
Pension Funds: Total: US$ 209 bn Financial institucions

 - Active participants along the entire curve. Central Bank & Gov.
 21% Bonds
 - Approximately 75% of GDP. Corporate bonds
 44%
 - Internal policies require a local credit quality rating of investment Investment funds
 18%
 grade.
 Domestic equity
 - Limits by issuer and instruments. 9%
 6% Foreign investment
 2%

Life Insurance companies: Total: US$ 62 bn
 1% 2%
 - Very predictable flows of financing long-term liabilities. Fixed Income

 - Approximately 20% of GDP. 16% Equity

 - Major investors when the term exceeds 10 years - focus on 13%
 Foreign invesment
 instruments with terms to 20 years or more. 60% Real state inv.
 8% Loans
 - No minimum rating required to invest.
 Others

Mutual Funds: Total: US$ 56 bn
 Financial
 - Mutual funds and individual investors focused primarily on short- 8% institutions
 7% Equity
 term profitability and/or liquidity.
 9%
 - Approximately 20% of GDP. Investment funds
 10% 63%
 - Major investors when the terms of the instruments do not Central Bank &
 exceed five years. Gov. bonds
 Corporate bonds
 - Limits by issuer and instruments.

 19
Source: Superintendencia de AFP’s, SVS y Santander
 15
Sound Financial System with Good Growth Potential
 Unique savings cycle gives stability to market funding sources
 Chile’s savings, US$ billion*
 Banks

 267
 244
 63 Annuity Life
 insurance
 Deposits
 169
 Pension savings

 204
 Pension
 10 Deposits by pension funds / Ins. funds
 30 Invest. in bonds by pension funds / Ins.
Other bond
 holders 35

 Funding LT savings
 In Chile, 10% of salaries are put into pension funds throughout the duration of an individual’s work life. Pension funds then fund banks
 through deposits and investment in bonds. Since their investment horizon is long-term, pension funds are a natural investor to fund
 long-term loans such as mortgages.
 Construction
 companies
 20
 16
* Figures as of 2018 except Annuity investment as of Dec. 2017 Sources: SBIF, CMF and SAFP
Sound Financial System with Good Growth Potential Major differences of Chilean banking system with other banking systems NIM Sensitivity to inflation ( ) Local provisioning models $ Capital requirements Around 50% of our loans are indexed to Chilean banks are not full IFRS, since we Banks are currently under a very strict inflation. Loans are fixed plus inflation do not use IFRS 9. Basel I, where risk-weighted asset (fixed % + UF) density is close to 80%. Our local regulators sets our When inflation increases UF increases provisioning models calculated on A new banking law was passed in 2019, interest paid on inflation-linked loans expected loss. Banks can either use the and banks will transition to Basel III. The increases NII increases set models or internal models, details on risk weightings and possible whichever is the most conservative. capital instruments are still to be A 100 bp increase in inflation determined. approximately 15 bp increase in NIM Since 2014, our local regulator has started moving towards standardized The system as a whole will have a On the other hand, our NIMs are models. shortfall when implementing Basel III. negatively sensitive to increases in the We believe Santander Chile will not short-term interest rate, since our Recent updates to provisioning models: need a capital increase and will be fully liabilities are shorter term than our 2014: Companies analyzed on an compliant from the beginning. assets, and therefore reprice faster individual basis The banks will have approximately four A 100 bp increase in average short-term 2016: Mortgages years to become fully compliant. interest rates approximately 12 bp decrease in NIM 2019: Companies analyzed on a group basis 21 20
Sound Financial System with Good Growth Potential
 What is the UF?
 › The UF (Unidad de Fomento) is an inflation-indexed unit used in Chile.

 › It was created in 1967 and used for certain international secured loans in order to calculate real interests.
 Over time, it was extended to other bank loans, contracts and other investments.
 › Most real estate and mortgages are valued in UF in Chile. Wages are adjusted in accordance with
 the CPI (in accordance with the Labor Code).

 CPI: Consumer Price Index, which shows the variation
 of prices of basic consumer goods.
 This index is published on a monthly basis.

› The value of the UF varies daily.

› The monthly variation (beginning on the 10th of each month and ending on the 9th of the following month)
 of the UF is in line with the total CPI variation of the previous month.

 1+∆%
 ∆% : Percentage change of last month’s CPI
 ( 100
 )−1 ∙ (1/ ) d= number of days of the current period for which the
 UF is being calculated.

 1UF = Ch$ 27,565,79 = US$ 40.9 (As of December 31, 2018).

 22
 21
Sound Financial System with Good Growth Potential The Chilean financial system is well ring-fenced No interim dividends allowed (Art 57). No dividend allowed if it infringes minimum capital requirements (Art. 56) Liable: Directors of a Bank who propose the payment of dividends in violation of the provisions of Title IV of the C General Banking Law shall be liable to the refund of the dividend distributed under such circumstances (Art. 58). Lending limits (Art 84): • Same borrower: 10% of regulatory capital unsecured and up to 30% of regulatory capital if additional 20% is secured. 30% limit to single economic Group. • Related party lending: Limited to 5% of regulatory capital (unsecured) or 25% (w/ collateral). Total related party lending cannot exceed regulatory capital. • No loans to Board members Audit Committee: All 3 members must be independent 23 23 Source: New Banking Law
Sound Financial System with Good Growth Potential
 Our main regulators

 Central Bank of Chile CMF SBIF
Autonomous institution. Decentralized public service, related to the Supervises banks and financial institutions
Mission: To safeguard the stability of the President through the Ministry of Finance. seeking to protect depositors and the public
currency and the normal operation of the Supervises entities within the securities and interest.
internal and external payment systems, exchange markets. Mission: Ensure the stability of the financial
hereby contributing to the well-functioning of Mission: to promote social wellbeing, system.
the economy, financial stability, and the well- contributing to the development of the Superintendent is named by the President of
being of society. financial marekts and to preserve the trust in the Republic of Chile.
Central Bank targets a 3% inflation, with a the system.
threshold of +/- 1%. The Comission is made up of five members,
Governed by five members, each designated desginated in the following manner:
by the President of the Republic who must be (i) President of the Comission designated by
ratified by the Senate for a term of 10 years. the President of the Republic for a term
President of the Bank is elected among the of four years.
current five members every five years by the (ii) Four members designated by the
President of the Republic. President who must ratifed by the Senate
 for a term of six years, which can be
 reelected in pairs every three years.

 During 2019 a new banking law was passed, and on June 1, 2019, the SBIF
 merged into the CMF, leaving one sole regulator, the CMF, for all listed
 companies. 24
 13
Sound Financial System with Good Growth Potential
 Our general banking law

 General Banking Law New General Banking Law
 1925-2019 2019-

 With the General Banking Law passed in In January 2019, the new banking law was
 1925, the Central Bank and the banking passed. Here, the regulator takes a more
 regulator at the time- the SBIF- was born. predominant role and sets capital
 Over the years the banking law has been requirements and risk weightings
 modified to include new standards. Within themselves. The structure of the regulator
 this law, banks were under Basel I, where also changes: instead of one Superintendent
 capital required and risk weighting of assets overseeing banks, there is a comission that
 was stipulated within the law. This made it oversees not only banks, in addition to all
 difficult to modify any of the requirements as other listed companies. In this manner, the
 each modification needed to be passed by structure is much more flexible in order to
 Congress. move with international standards.

 25
 13
Sound Financial System with Good Growth Potential
 New banking regulation will implement BIS III in Chile
 Risk-weighted asset density1
 81 Credit risk

 Currently:
 › Chile has a very high risk-weighted 75 69
 59 57 56
 asset density, where mortgages are all 49 45 45
 38 32 32
 risk weighted 60% and consumer and
 commercial loans 100%.

The new banking law was passed at the beginning of 2019, paving the way for the transition to BIS III. The main
changes are:

 Merger of SBIF with CMF Minimum capital Mechanisms to manage Other guarantees
 Seeks to have a solid and requirements crisis
 efficient governance Increase capital Includes mechanisms of Increase in state
 which will be more requirements, giving early intervention in order guarantees for deposits,
 flexible to make changes more faculties to to prevent a bank’s among others
 in accordance to regulator in the decision- insolvency beforehand,
 international standards protect bank depositors and
 making process
 Merger as of June 1, 2019 maintain the financial
 stability of the system 26
1. BIS. RWA density = Risk weighted assets / Total assets. The Banker database July
 24
2017. Chile includes credit and market risk
Sound Financial System with Good Growth Potential
 New banking regulation will implement BIS III in Chile

 › New banking law has higher capital requirements,
 but we would expect normalization of RWA density. Introducing new capital requirements
 › Hybrid instruments (AT1 and preferred stock) will be
 recognized as capital Pillar II
 0% - 4%
 › Normal transition to BIS III should be positive for our
 T1 or T2
 capital ratios
 C. Cyclical Buffer
 › Includes the implementation of liquidity ratios (LCR 0% - 2.5% RWA
 and NSFR)
 Systemic Buffer
 › Following steps: 1% - 3.5% RWA
 10.5%
 Next 12-18 Next 12 Next 4-5 Conservation Buffer
 months months years 2.5% RWA
 8%
 T2
 3.5% RWA T2 – 2.0% RWA
 Subordinated**
 + Provisions AT1 – 1.5% RWA
 SBIF will CMF will have Implementation
 merge the to specify the time for banks to CET1 CET1
 CMF, creating requirements be fully 4.5% RWA 4.5% RWA
 one general for the compliant to
 regulator for implementation Basel III
 all companies of Basel III requirements ** Subordinated bonds allowed up to 50% of the CET1
 (including
 banks)
 27
 25
AGENDA

 CHILE: A STABLE AND DIVERSIFIED COUNTRY

 SOUND FINANCIAL SYSTEM WITH GROWTH POTENTIAL

 SANTANDER CHILE: A LEADING BANK

 ADVANCES ON OUR STRATEGIC OBJECTIVES

 28
 26
A leading bank
 Santander Chile Figures
 is the nation’s leading bank
 in US$

 Business and Results 06M19 (US$) YoY
 Gross Loans 45.8 bn 6.4%
 Deposits 32.5 bn 5.9%
 Equity 4.9 bn 5.7%
 Net income1 859 mn 1.6%
 Network and Customers 06M19 Market Share
 Clients 3.4 mn 21.4%2
 Digital Clients 1.1 mn 31.7%3
 Offices 380 18.4%
 Market Share2 06M19 Rank
 Loans4 18.4% 1
 Deposits4 18.1% 1
 Checking accounts2 21.4% 1
 Bank credit cards5 27.7% 1

1. Net income attributable to shareholder, last twelve months 2.Market share of clients with checking accounts, as of May 2019. Source: CMF 3. Average yearly market share
over clients that enter a website with a passkey. Excludes Banco Estado. Source: CMF. YTD avg as of May 2019. 4. Excludes loans and deposits of Chilean banks held abroad. 5.
Market share in terms of monetary amount of credit card purchases, as of May 2019.

 29
 27
A leading bank
 Santander Group’s first significant foreign endeavor was in Chile

 1978 1982 1989-1990 1993 1996 2002 2010 2018
 ……………………………………………………………………………………………………………..………………………………………….….

Banco Santander Chilean After the Santander Santander Santander Chile is hit by Santander is the
enters the economy fails. economic crisis, acquires Fincard, merges with merges with one of the largest retail
Chilean market, All Banks Banco Santander principal credit Banco Osorno Banco Santiago, world’s largest bank in the
opening a intervened. sold part of its card processor and la Unión, reaching a earthquakes. country,
subsidiary Banco Santander C loan portfolio to in the country, becoming the market share of Santander is maintaining its
mainly aimed at buys over Banco the Central and enters the largest bank in 25%. fully operable leadership.
foreign trade. Español Chile, in Bank. Banco mass market. the country. the following
 liquidation. Santander buys Loan market business day.
 back all of the share reaches
 loan portfolio 12%.
 and changes its
 name officially
 to Banco
 Santander Chile

 30
 28
A leading bank

 Ownership structure
Composition of shareholders
 Minority shareholders
 Santiago stock
 13.97% Standard Life Aberdeen PLC 7.8% UK
 Chilean Itau Corpbanca(on behalf of third parties) 2.3% Chile
 pension funds T Rowe Price Group Inc 2.0% US
 4.80% Banco de Chile (on behalf of third parties) 1.5% Chile
 Banco Santander (on behalf of third parties) 1.4% Chile
 ADR on NYSE
 14.05%
 12.0% JPMorgan Chase & Co
 A F P Provida S A
 1.2%
 1.2%
 US
 Chile
 Santander Vanguard Group Inc 1.2% US
 Group Total return local A F P Habitat S A 1.1% Chile
 67.18%
 stock 2018 Schroders PLC 1.1% UK
 A F P Cuprum S A 1.0% Chile
 A F P Capital S A 0.9% Chile
 Harding Loevner LP 0.7% US
 AQR Capital Management LLC 0.6% US
 Santander Group owns 67.2%. We are listed on the Santiago Stock Banchile stock broker 0.6% Chile
 Wells Fargo & Co 0.6% US
 Exchange and the NYSE Renaissance Technologies LLC 0.5% US
 ADIA 0.5% Utd Emirates
 Government of Singapore 0.4% Singapore
Average daily volume traded Price to Book value vs global banks Santander stock broker 0.4% Chile
(US$ millions) (P/B times, as of Dec. 2018) William Blair & Co LLC 0.4% US
 NORGES BANK 0.4% Norway
 B.C.I. Stock broker 0.4% Chile
 17.8 Santander Chile 3.0 USS Investment Management Ltd 0.3% UK
 FMR LLC 0.3% US
 Latin America 2.2 A F P Modelo S A 0.3% Chile
 10.2 BlackRock Inc 0.3% US
 Africa & Middle East 2.0 Dimensional Fund Advisors LP 0.2% US
 Larrain Vial S.A. stock broker 0.2% Chile
 Asia Pacific- Emerging 1.6 INCA Investments LLC 0.2% US
 7.6 Morgan Stanley 0.2% US
 Global 1.3 Valores Security S.A. stock broker 0.2% Chile
 Ariel Investments LLC 0.2% US
 2018 Asia Pacific- Developed 1.2

 Santiago stock exchange NYSE Europe- Emerging 1.1
 Europe- Developed 0.8
 31
 29
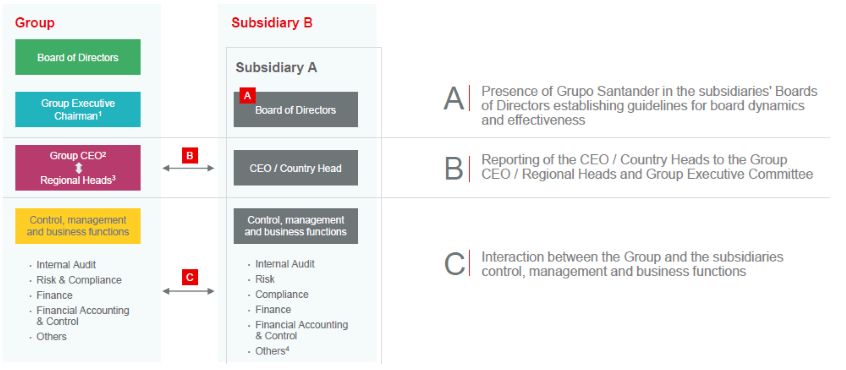
A leading bank
 Relationship with Santander Group

 C

 Santander Chile complies with international
 standards of corporate governance as
 established by the Group

 However we are independent in terms of
 Capital, Liquidity, Financing and Dividends.
 Revenues

 32
 30
A leading bank
Santander follows a global funding strategy based on independence

Santander Model Other models

 “Crisis
 “Firewalls” Contagion”

 International network of INDEPENDENT International network of DEPENDENT
 subsidiaries in terms of funding, capital, branches in terms of funding, capital,
 liquidity and dividends liquidity and dividends

 33
 31
A leading bank Independent board Corporate Governance Standards Board of Directors: 5 out of 11 Board members unrelated to Grupo Santander. Board approves Corporate Responsibility & Sustainability Policy C and Strategy. Separation of functions: commercial areas separated from risk; main credit decisions taken by committees. Compliance: Regulated by CMF of Chile, ECB and SEC. Comply with SEC and NYSE Guidelines & SOX. Independent Board members with no relationship to DJSI Chile, MILA the Bank or the Santander Group. 34 32
A leading bank
 Main board committees
 Risk Committee Audit Committee ALCO
The Risk Committee of the Board is The Audit Committee is comprised The ALCO includes the Vice-
responsible for reviewing and of three independent members of President of the Board and three
monitoring all risks that may affect the Board of Directors. This additional members of the Board,
us, including reputation risk, Committee’s primary responsibility the Chief Executive Officer, the
allowing for an integral risk
 C

 is to support the Board of Directors Chief Financial Officer, the
management. This committee in the continuous improvement of Corporate Financial Controller, the
serves as the governing body our system of internal controls, Manager of the Financial
through which the Board supervises which includes reviewing the work Management Division, the Manager
risk in general. It also evaluates the of both the external auditors and of Market Risk, the Manager of the
reasonability of the systems for the autonomous Internal Audit Treasury Division, and other senior
measurement and control of risks. Department. The committee is also members of management. The
This Committee includes 6 Board responsible for analyzing ALCO meets monthly. All limits
members. This committee also observations made by regulatory reviewed by the ALCO are
includes the CEO, the Director of entities of the Chilean financial measured and prepared by the
Risk and other senior level system about us and recommending Market Risk Department. The non-
executives from the commercial side measures to be taken by our Board members of the ALCO meet
of our business. management in response. The weekly to review liquidity, funding,
 external auditors are recommended capital and market risk related
 by this committee to our Board of matters.
 Directors and appointed by our
 shareholders at the annual
 shareholders’ meeting.
 35
 33
A leading bank
 Our management team
 CHAIRMAN
 & COUNTRY HEAD
 Claudio Melandri

 DIRECTOR OF
 CEO
 INTERNAL AUDITING
 Miguel Mata
 Ricardo Martínez

 DIRECTOR OF
 HUMAN
 DIRECTOR OF
 DIRECTOR OF RISKS RESOURCES
 RETAIL BANKING M. Eugenia de la
 Franco Rizza
 Matías Sánchez Fuente

 DIRECTOR OF DIRECTOR OF
 DIRECTOR OF CLIENTS &
 MIDDLE-MARKET
 TECH & OPERATIONS QUALITY
 José Manuel Manzano Carlos Volante
 Ricardo Bartel

 DIRECTOR OF CIB DIRECTOR OF CFO

 Fred Meller ADMINISTRATION Emiliano Muratore
 Sergio Ávila
 PRODUCTS
 CONTROLLER
 Cristián Peirano GENERAL COUNSEL
 Guillermo Sabater 36
 Cristián Florence 35
A leading bank
 Our main business segments
 % of total loans % of total net income

 69% 25% 5% 0.5%
 40% 26% 18% 16%

 Retail banking Middle-market Corporate Investment Corporate activities
 Banking

 Individuals and small to Companies and large Foreign and domestic Includes our Financial
middle-sized entities (SMEs) corporations with annual multinational companies with Management Division, which
with annual sales less than sales exceeding Ch$2,000 sales over Ch$10,000 million develops global management
 Ch$2,000 million (U.S.$3 million (U.S.$3 million). Also (U.S.$16.2 million). Also functions, including managing
 million). institutions such as includes Treasury Division. inflation rate risk, foreign
 universities, government currency gaps, interest rate
 entities, local and regional risk and liquidity risk.
 governments and companies
 engaged in the real estate
 industry, with annual sales
 exceeding Ch$800 million.

 37
 36
At June 2019.
A leading bank A diversified and universal bank % of total loans % of total net income 69% 25% 5% 0.5% 40% 26% 18% 16% Retail banking Middle-market Corporate Investment Corporate activities Banking ■ Loans: 55% Individuals / 45% companies Mining 1% Fishing 1% ■ High diversification by sector. ALL LOANS IN CHILE. Utilities 1% Individual: focus on growing in the mid-high income segments. Forestry 1% Transportation 2% Selective growth in lower-end segments Construction 3% Manufacturing 4% SMEs: focus on larger SMEs, especially with a balanced flow of Agro 4% income (lending and non-lending products) Mortgages 34% Services 8% Middle-market: focus on non-lending business activities. Loans as part of an integral client relationship Consumer Other SCIB: strong focus on non-lending activities 16% 13% Commerce 11% 38 37 At June 2019.
A leading bank
 Retail banking
 Products: Consumer loans, credit cards, auto loans,
 commercial loans, foreign exchange, mortgage
 loans, debit cards, checking accounts savings
 Total number of clients products, mutual funds, stock brokerage, insurance
 3.3 million brokerage.

 Consumer SMEs
 Our major products are: With annual sales less than Ch$2,000
 › Credit cards (35% market share) million (U.S.$3.0 million).
 › Consumer loans
 Individuals > 98% denominated in Pesos Includes government-guaranteed loans,
 > 50% mature within one year, the rest leasing and factoring.
 Includes consumer and
 within 5 years
 mortgages. › We receive fees from mutual funds, stock
 brokerage, and insurance brokerage. Over 200,000 clients of which around
By income segment: 100,000 are digital clients and 20% are
 Low considered to be loyal1
 Mortgages
 Middle income
 income 2% Total loans as of June 2019
 Mortgage loans are in their majority linked to the Ch$ 3,917,838 million
 26%
 inflation-linked currency, UF. They are also in
 their majority non-endorsable.
 There is an increasing focus on non-
 High › Fixed rate + inflation
 lending services
 income › Average duration: 20 years
 72% › LTV: ~75%
 › Mortgage loans are charged-off at 48
 months

 39
 38
 1. Loyal SMEs are companies that comply with having a range of products with a certain level of profitability and usage.
A leading bank

 Middle market Middle market & CIB
 +26,000 Consumer loans, leasing, factoring, foreign
 Ch$ 209,527 million Products:
 Total income LTM1 trade, credit cards, mortgage loans, checking
Total clients
 accounts, transactional services, treasury
 25% % of total loans services, financial consulting, savings
 27%
 % of total net products, mutual funds, insurance brokerage
 income
 Client income by product mix (%)
 1%
 14% 11%
 Corporate Investment 12% 4%
 3% 5%
 Banking (CIB) 7% 2%
 9% 59%
 19%
 400
 88%
 Total clients
 45%
 50 350 Lending income 6%
 Chilean Foreign 58%
 Non-lending income
 Ch$ 141,771 million
 21%
 Total income LTM1

 6% % of total loans Margin Commissions Financial Transactions,
 17% net
 % of total net Real estate Corporations
 income Institutions Markets
 Global debt financing Global Transactional banking
 Corporate finance 40
 43
 1. Total income = margin+ commissions+ financial transactions, net. Last twelve months as of June 2019
A leading bank
 Corporate activities
 › Over 77% of our assets are customer loans and 55% of our funding come from customer deposits. The rest of
 funding is managed by the Finance Division.

 › The finance division manages the balance sheet structure through asset liability management.

 › We fund our consumer loans and short-term commercial loans mainly through customer deposits. As our
 mortgages have a longer duration (7 years including the prepayment assumption) we fund these loans with
 debt issuance. We are active issuing bonds in the local market and also in the international markets.

 The financial division at the bank manages the following risks:

 Liquidity risk Interest rate risk
 As we are part of the Santander Group we comply with BIS III When the interest rates rise, the liabilities reprice quicker than
 and report our liquidity ratios to the European regulator; LCR the assets due to a shorter duration. This means that the
 (ECB~130%), NSFR (BIS III)~110%. exposure is regularly managed in accordance with the limits and
 risk appetites established .

 Foreign currency risk Inflation risk
 The Bank runs no foreign currency gap. All foreign funding is The Finance division manages the UF Gap principally through
 usually hedged using forwards and cross-currency swaps. hedge accounting and debt issuances in UF in the local market,
 Including derivatives, the Bank seeks to run no foreign currency using estimates of inflation at different time frames.
 risk in its non-trading balance sheet.

 41
 44
A leading bank
 How do we manage the UF?
 › The UF (Unidad de Fomento) is an inflation-indexed unit used in Chile. The value of the UF varies daily, in
 line with the total CPI variation of the previous month.
 › It was created in 1967 and used for certain international secured loans in order to calculate the real
 interests. Over time, it was extended to other bank loans, contracts and other investments.
 › Most real estate and mortgages are valued in UF in Chile. Wages are adjusted in accordance with
 the CPI (in accordance with the Labor Code).

 Consumer Demand
 Most mortgages and some long Lending Deposits
 Our demand deposits and a
 term commercial loans are
 large portion of our time
 expressed in UF, in total Commercial Time deposits are in Ch$, not linked
 amounting to around 50% of Lending Deposits to inflation.
 our loan portfolio.
 Mortgage
 Bonds
 Lending
 ASSETS LIABILITIES

 UF GAP
 Assets linked to inflation >
 liabilities linked to inflation
 UF As inflation increases, the
 linked UF UF gap increases.
 linked
 ASSETS LIABILITIES
 42
 45
A leading bank
 How do we manage the duration gap?
 › Consumer and commercial lending tends to be short to medium term.
 › Mortgage lending is longer term, with terms of 10, 20, 25 and 30 years being the most popular.
 › Time deposits in general are also short-term, with terms of 30, 60 and 90 days being the most
 popular.
 › In order to close the duration gap, consumer and commercial lending is financed through demand
 and time deposits, while mortgage lending is financed through longer-term bonds. This reduces
 interest rate risk.

 Average maturity of Consumer Demand
 commercial and consumer Lending Deposits Average maturity of demand
 lending is 22 months and time deposits is 18
 Commercial Time months1
 Lending Deposits
 Average maturity of
 mortgage lending is 7 years Mortgage Bonds are used to match the
 Bonds
 (including prepayments) Lending longer-term mortgage lending
 ASSETS LIABILITIES

 43
 46
1. Assumes an actual duration for demand deposits of three years.
A leading bank
 Solid balance structure and liquidity levels

Structural balance sheet Liquidity coverage ratio3
US$bn Jun. 2019
 134%
 119% 120% 123%
 102%
 88% 114%
 Average

 60%
 Regulatory
 minimum

 NSFR4

 111.2%
 109.0% 109.5%

 Jun-18 Dec-18 Jun-19

 In Chile, demand deposits do not pay any interest. Time deposits are usually short-term, varying
 between 30 days up to 1 year.
 Loans to deposits are high in Chile because long-term loans are funded through long-term bonds
 and not through deposits.

 44
1. Assumes an actual duration for demand deposits of three years. 2. Includes pre-payment estimate. 3. LCR calculated following the new local Chilean models
4. Internal methodology and not the local Chilean regulator’s guidelines still under discussion
A leading bank
 Healthy deposit growth
 Total Deposits
 Ch$bn Ch$ bn 06M19 YoY
 Demand 8,910 9.6%
 CAGR Time 13,123 3.5%
 +6.1% Total Deposits 22,032 5.9%

 21,809 22,032 Mutual funds1 6,266 12.8%
 19,539 20,691 19,682
 16,894 Loans to deposits 137.5%
 Loans to deposits
 97.0%
 adjusted2
 LCR3 123%
 NSFR4 110%
 Dec-14 Dec-15 Dec-16 Dec-17 Dec-18 Jun-19

 45
 47
1. Banco Santander Chile is the exclusive broker of mutual funds managed by Santander Asset Management, a subsidiary of SAM Investment Holdings Limited. 2. (Net Loans – portion of mortgages funded with long-
term bonds) / (Time deposits + demand deposits). 3. LCR: Liquidity Coverage Ratio under ECB rules. 4. NSFR: Net Stable Funding Ratio according to internal methodology. These are not the Chilean models
A leading bank
 Competitive cost of fund despite recent increases in short-term rates
 Demand deposits by segment CLP Time Deposit Cost Evolution1

 Ch$ bn 06M19 YoY
 Individuals 2,791 8.4% 3.2%
 SMEs 1,531 9.0% 3.1%
 3.1%
 Retail 4,322 8.6% 3.0%
 Middle Market 2,662 9.7% 2.9%

 Corporate (SCIB) 1,347 9.4% 2.8%
 Total2 8,910 9.6%
 2.5% 2.5%

 Santander Chile BCI Central Bank Rate

 Over 70% of our total deposits are retail, making them a more stable source of funding.

 46
1, Interest expense from time deposits over time deposits on a monthly basis. Source of data used to construct the ratio: CMF
 48
2. Includes deposits from our financial division
A leading bank We are an active issuer in international markets Bonds ■ Total outstanding: US$12.0bn ■ In 2019 we plan to issue US$2-3bn and for 2020 we estimate issuances for US$3-3.5bn ■ High diversification by country MTN program: Private placements or public deals All foreign debt is swapped backed to local currency AT1 approved under the new Banking Law. Probably can issue in 2020 Maturity profile 47
A leading bank
 Loan growth driven by Retail banking

 Total Loans
 Ch$ bn 6M19 YoY QoQ
 Ch$bn CAGR
 Individuals1 17,587 10.1% 2.5%
 7.0%
 +2.7% Consumer 4,989 7.5% 1.4%
 30,282 31,095 Mortgages 10,658 11.9% 3.1%
 27,726
 25,301 27,206
 22,893 SMEs 3,918 3.2% 2.2%
 Retail 21,505 8.8% 2.5%
 Middle Market 7,876 6.6% (0.1%)
 Corporate (SCIB) 1,563 (19.8%) (1.7%)
 Total2 31,095 6.4% 1.6%
 2014 2015 2016 2017 2018 Jun-19

 2019: Loan growth forecast 8-10% driven by retail loans

 48

1. Includes other commercial loans to individuals. 2. Includes other non-segmented loans and interbank loans
A leading bank
 Stable asset quality throughout the years

 Through the years, the regulator has been updating their standardized provisioning models, becoming more
 conservative. Since 2014, the Bank has changed its strategy to move towards less risky clients, focusing on NIM net
 of risk. Today, NPLs are at their lowest.

 Total loans: Non-performing loans (NPL) and coverage (%)
 148%
 2014: Changes to 130%
 provisioning
 118% models: Consumer
 Economic Crisis and Commercial 2016: Standard
 US and Europe provisioning model
 for mortgages (B1).
 Higher provisioning
 for LTV > 90%
 71% 87%
 Sept 2015 Earthquake in 2016-2017 GDP
 Coquimbo Chile- 8.3Mw growth slowdown in
 Chile
 2.7% 3.1%
 2.4%
 Feb 2010 Earthquake in
 2.2%
 2.0%
 Maule Chile- 8.8Mw
 and destructive Tsunami April 2014 Earthquake in
 Iquique Chile- 8.2Mw
 abr-09

 abr-10

 abr-11

 abr-12

 abr-13

 abr-14

 abr-15

 abr-16

 abr-17

 abr-18

 abr-19
 jul-09

 jul-10

 jul-11

 jul-12

 jul-13

 jul-14

 jul-15

 jul-16

 jul-17

 jul-18

 jul-19
 ene-09

 ene-10

 ene-11

 ene-12

 ene-13

 ene-14

 ene-15

 ene-16

 ene-17

 ene-18

 ene-19
 oct-14
 oct-09

 oct-10

 oct-11

 oct-12

 oct-13

 oct-15

 oct-16

 oct-17

 oct-18
 NPL (1) Coverage (2)
 49
 22
1. Loans with 90 days or more overdue. 2. Stock of provisions divided by NPLs. Source: SBIF
A leading bank
 Sustainable capital ratios

 Core capital BIS Ratio

 14.0%
 13.2% 13.4% 13.9% 13.4% 13.1%
 10.9% 10.3% 10.5% 11.0% 10.6% 10.4%

 Dec-14 Dec-15 Dec-16 Dec-17 Dec-18 Jun-19 Dec-14 Dec-15 Dec-16 Dec-17 Dec-18 Jun-19

 We target a core capital ratio of 10.5% at the end of each year.
 In Chile, we are currently under Basel I. In 2019, the New Banking Law was passed, which will
 transition banks into Basel III. The details of the implementation are still being discussed, but we
 expect that the transition will have a positive impact on our capital ratios.
 50
 49
A leading bank
 Among banks with best international rating
 Risk rating, Moody’s scale

 UOB
 OCBC
 DBS
 ANZ
 Westpac
 SAN Chile
 Banco de…
 Estado
 RBC
 BCI
 Moody’s (stable) A1
 HSBC
 SAN JCR (stable) A+
 Wells Fargo
 BofA Fitch (stable) A
 JP Morgan
ItauCorpban… Standard & Poor’s (stable) A
 Goldman…
 Citibank
 Deutsche…
Credit Suisse
 Bradesco
 0 2 4 6 8 10 12 14 16

 Ba3 Ba2 Ba1 Baa3 Baa2 Baa1 A3 A2 A1 Aa3 Aa2 Aa1

 51
 Source: Moody’s via Bloomberg
 34
AGENDA

 CHILE: A STABLE AND DIVERSIFIED COUNTRY

 SOUND FINANCIAL SYSTEM WITH GROWTH POTENTIAL

 SANTANDER CHILE: A LEADING BANK

 ADVANCES ON OUR STRATEGIC OBJECTIVES

 52
 50
Advances on our strategic objectives
 Strategic priorities

 Declaration
Our Our vision
 We want to be the best bank for our customers, leading in
purpose Be the best Bank
 digital excellence and experience, gaining their loyalty
Help people acting responsibly
 and gaining the Clients
and
businesses to loyalty of our
prosper clients, We want to be the best large company to work in Chile,
 shareholders, attracting and developing talent, always committed to our
 people and SPF culture
 Employees
 communities
 We want to be the most profitable and sustainable bank,
 with solid capital levels, attractive dividends and strong risk
Our way management
of doing Shareholders
things
Simple, We want to be recognized as a responsible bank that
Personal, contributes to the community
Fair
 Community

 We want everything we do to have a seal of excellence in execution
 Excellence
 53
 in execution 51
Advances on our strategic objectives
 Increasing our digital clients Clients
 Clientes

 Total Digital Clients
 thousands
 CAGR 1,109
 6.0%
 +1.1 million
 Digital clients
 Jan-15

 Jan-16

 Jan-17

 Jan-18

 Jan-19
 Sep-15

 Sep-16

 Sep-17

 Sep-18
 May-16
 May-15

 May-17

 May-18

 May-19
 6.3%
 Annual growth
 Market share of internet clients1 2017-2018
 of digital clients
 32%
 23%
 16%
 8% 7% 7%
 4%
 1/3
 Of the amount of
 consumer loans are
 sold through the App
 54
 60
1. Market participation of clients who access their account through the webpage with their passcode, does not include public banks
Advances on our strategic objectives
 Penetrating the unbanked market with Clients
 digital/ transactional products
 Clients this initiative 4.5 million people with income < Ch$400
 seeks to target: Financial thousand (U.S.$ 7 thousand a year)
 inclusion 600 thousand immigrants
 20 thousand a month >18 Years MY FIRST BANK

 1.2 million Young generation Digital Better 7 million who use
 1.5 million who use Rideshare Generation Experience simple debit card or
 have no bank account

 Our position and market share1
 TOP
 ONE # operations $ operations
 Debit card #2 #1
 25% 26%
 4.5 million people with income <
 Ch$400 thousand Traditional credit market
 (U.S.$ 7 thousand a year) 3.2 million people # accounts $ accounts
 Checking
 accounts #1 #2
 Income distribution (Source: INE)
 21% 21%

 55
1. Source: CMF, as of May 2019
Advances on our strategic objectives
 Superdigital: our new digital platform Clients

 Transaction
 history
 Send/ divide
 • A Fintech by Santander $

 • Our first 100% digital platform for
 Santander Chile Pool
 money
 • First country in Latin America to Request $
 implement one of Grupo Santander’s
 speedboats
 My
 account
 • Purchasing and payment platform based no° Virtual card
 on new prepaid card regulations

 • Social Banking- Ecosystem for individuals
 to make payments to contacts via chats Pay bills Change
 plan
 • Financial inclusion without credit with UX
 Fintech
 Top-up
 ATM Cash
 phone
 withdrawals
 56
Advances on our strategic objectives
 Santander Life: reactivating growth among mid-income earners Clients
 with a product mix that rewards positive credit behavior

 NEW
 NEW 2019
 2019

 › Digital onboarding

 › Meritolife: Positive credit behavior
 accumulates merits and enables
 access to better interest rates and
 other benefits

 › Cuenta Life: Pre-paid debit card
 with no minimum salary
 requirement

 › Life Latam Pass: Accumulate
 Merits and Airmiles

 › Savings merits: Programmed
 saving that accumulates merits
 57
Advances on our strategic objectives
 Re-activating growth among mid-income earners with a Clients
 product mix that rewards positive credit behavior
 As of June 2019

 Launched June 2019
 Life has been steadily growing over time. Total Life Clients: 54,785 2,077 clients in 1
 Monthly average of 3,000. month
 6,698

 Launched November 2017 3,422
 51,360 clients in total

 2,955
 Launched June 2019
 1,350 clients in 1
 month

 Dec-17 Mar-18 Jun-18 Sep-18 Dec-18 Mar-19 Jun-19

 New LIFE clients per month
 58
Advances on our strategic objectives
 Acquiring Entering the acquiring business Clients

 Position and market share1
 Total
 monetary
 #3 Number of
 Credit card Stock operations
 #1 amount of #1
 10% 22% operations
 Debit card 28%
 #2 #2 #1
 22% 25% 26%
 Payment methods through the years2
 Millions of operations
 Non-digital transactions Digital transactions
 Only 30-
 40% of
 shops
 currently
 have POS3

 Checks Cash Non-banking Bank credit Debit cards Internet Internet
 withdrawals credit cards cards transfer payments
 from ATMs
 2014 2015 2016 2017 2018 (*) 59
1. Source: CMF, as of May 2019 2.Source: Central Bank of Chile, based on information from the CMF. Source Santander Chile estimates
Advances on our strategic objectives
 Increasing our digital clients Clients
 Clientes
 Front office

 +27% +75% +21% 85%
 MAU1 APP Digital Life Of our
 Consumer consumer credit Current Account
 Operations holders are digital
 YoY ‘17-’18 QoQ ‘17-’18 Dec’18-Mar’19 2018
 Back office

 -56% -67% -90% -91%
 In Response Time In average time In obsolescence In daily incidents
 for requests for card activation

 YoY ‘17-’18 YoY ‘17-’18 YoY ‘15-’19 YoY ‘14-’Feb19

 60
1. MAU = Monthly active users
 61
Advances on our strategic objectives
 Cybersecurity a top priority Clients

 We have been working on various initiatives to make the Bank more secure:

 Renewal ATM
 systems New apps and their
 Cyber education functionalities
 All ATMs now have
 the latest operative The Bank app sends
 As of April 2019, all new clients must watch a series
 clients notifications
 system of tutorials that advice on how to avoid cyber for every
 frauds movement in the
 account
 App that uses NFC
 technology on the
 Android
 smartphone to
 All cards now have enable clients to
 Internally, the Bank
 chips pay only using their
 also constantly sends phone. Safer as it
 Elimination of all cards its employees tips, uses tokenization
 that use magnetic warnings, and tests and has an added
 bands which are barrier (phone must
 be unlocked).
 easier to clone
 In 2018 we invested approximately US$ 15 million in cybersecurity. For 2019
 61
 63
 we plan to spend US$ 25 million
Advances on our strategic objectives
 Clients: Experience and loyalty Clients

 Evolution of client satisfaction (% Satisfaction)1 Global client satisfaction
 individuals2
 73% 72% 73% 70% 56

 62% Gap: +2
 59% 73% 52
 64% 64% 68%
 Peer 46%
 Group Peer
 Group 3
 43% 2nd semester 2018
Gap: -29 40%

 Financial SERNAC Ranking
 17% #of complaints for every 10,000 debtors

 Apr'12 Apr'13 Apr'14 Apr'15 Apr'16 Apr '17 Apr'18 9.7
 9.3
 Moving into a higher-income segment also meant higher -4% 8.2
 competition, and client satisfaction was a factor that was lagging. -12%
 We decided to make this a key factor in our transformation and
 today is an important KPI for the Bank. Today we have client
 satisfaction above our peer group, increasing client loyalty and 1S2016 1S2017 1S2018
 reducing the number of complaints.
 62
 58
1. Source. Adimark Gfk. % of clients that score the Bank 6 and 7 on a scale of 1 to 7, where 1 is the lowest and 7 the highest. 2. Net satisfaction: percentage of
clients who value the Bank with grade 6 and 7 minus clients who value the Bank with grade 1 through 4. 3. Average of competitor’s evaluations
Advances on our strategic objectives
 Clients: Experience
 As of June 2019
 and loyalty Clients

 Net Promoter Score

 Santander Peer group
 Top 2 Where we have seen tangible improvements in client
 40% satisfaction:
 39%
 35% 33%
 Executives: Easily contacted was the
 +4 pp main aspect improved.

 Teamwork: Clients have perceived
 Jul-Dec 2018 Jan-Jun 2019 +2 pp our teams to be better integrated.

 Net Global Satisfaction The bank understands my history as a
 Santander Peer group
 +3 pp client

 Top 3
 56%
 54%
 52% 51% Our clients with a Life Credit
 Card have a NPS of 67 and Net
 Satisfaction of 90
 Jul-Dec 2018 Jan-Jun 2019
 63 63
Source: Study by Activa for Santander with a scope of 60,000 surveys to our own clients and over 1,200 surveys to each competitor’s clients in the six month period. Measures the Net Global
Satisfaction and Net Promoter Score in three main aspects: service quality, product quality, and brand image. % of clients that value with grade 6 and 7 subtracted by clients that value with
grade 1 through 4. Audited by an external provider.
Advances on our strategic objectives
 Steady growth of loyal clients Clients

 Total Loyal Clients1
 thousands
 677 CAGR
 6.6%
 515
 428 CAGR
 331 6.2%

 CAGR
 153
 98 10.9%
 37 51
 CAGR
 Jul-15

 Jul-16

 Jul-17

 Jul-18
 Jan-15
 Apr-15

 Jan-16
 Apr-16

 Jan-17
 Apr-17

 Jan-18
 Apr-18

 Jan-19
 Apr-19
 Oct-15

 Oct-16

 Oct-17

 Oct-18
 7.5%

 Total loyal clients Loyal -High Income
 Loyal - Mid-income Loyal-Companies Loyal vs Active Clients
 46%

 34%
 Increasingly our active clients
 are becoming loyal, using us
 for more of their banking
 needs.

 64
1. Loyal high income and middle income customers with 4 products plus a minimum profitability level and a minimum usage indicator, as differentiated by segment. SME + Middle-market cross-
 59
selling differentiated by client size using a point system that depends on number of products, usage of products and income net of risk
You can also read


