Banco Santander Chile - Macro & Strategy Update - December 2019
←
→
Page content transcription
If your browser does not render page correctly, please read the page content below
Banco
Santander
Chile
Macro & Strategy Update

December 2019

                          1   1
Important information
Banco Santander Chile caution that this presentation contains forward looking statements within the meaning of
the US Private Securities Litigation Reform Act of 1995. These forward looking statements are found in various
places throughout this presentation and include, without limitation, statements concerning our future business
development and economic performance. While these forward looking statements represent our judgment and
future expectations concerning the development of our business, a number of risks, uncertainties and other
important factors could cause actual developments and results to differ materially from our expectations. These
factors include, but are not limited to: (1) general market, macro-economic, governmental and regulatory trends; (2)
movements in local and international securities markets, currency exchange rates, and interest rates; (3)
competitive pressures; (4) technological developments; and (5) changes in the financial position or credit
worthiness of our customers, obligors and counterparties. The risk factors and other key factors that we have
indicated in our past and future filings and reports, including those with the Securities and Exchange Commission of
the United States of America, could adversely affect our business and financial performance.

Note: the information contained in this presentation is not audited and is presented in Chilean Bank GAAP which is
similar to IFRS, but there are some differences. Please refer to our 2018 20-F filed with the SEC for an explanation of
the differences between Chilean Bank GAAP and IFRS. Historical figures are not adjusted by inflation. Please note
that this information is provided for comparative purposes only and that this restatement may undergo further
changes during the year and, therefore, historical figures, including financial ratios, presented in this report may not
be entirely comparable to future figures presented by the Bank.

                                                                                                               2   2
Agenda

  Macro-economic environment

  Strategy update

  Results

                               3   3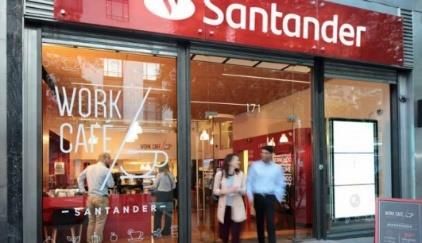
Chile: An Overview
                                                        An overview of Chile
     Chile: Key economic indicators1,2                                                      Chile’s economy by sector1
                                                                                            GDP by economic sector, %
      Population:                                             19.1mn                                         4% 2%                              Mining
                                                                                                      4.5%                                      Manufacturing
      GDP3:                                                  US$296bn                                                 11%                       Public services
      GDP per capita (PPP):                                 US$15,780                                                       11%                 Construction
                                                                                                                                                Commerce
      Exports / GDP:                                            25%                                                            3%               Trans & Comm
      Investment / GDP :                                        23%                                   37%                      7%               Service
      Net public debt / GDP:                                     8%                                                                             Public admin.
                                                                                                                           10%
                                                                                                                     9%                         Fishing & agriculture
                                                  JCR: AA- / Mdy: A1/ SP: A+/
                                                                                                                                                Others
      Sovereign ratings:                                     Fch: A

     Low public debt3,4                                                                    High sovereign rating5
          Gross public debt, % GDP
                                                                                               USA
                                                                                          Australia
                                 104                                                            UK
                                                      70                                      Chile
                                                                           53                China
             27                                                                             Japan
                                                                                           Mexico
                                                                                              Peru
           Chile             Adv. Econ.             Latam                  EM                Brazil
                                                                                                             Ba2 Ba3 Baa3 Baa2 Baa1 A3   A2     A1 Aa3 Aa2 Aa1 Aaa

                                                                                                                                                          4    4
1. Source: Central Bank of Chile, BCCh, and IMF. 2. Source: International Monetary Fund, 10/2017. 3. Source: Central Bank of Chile, Dec. 2018
 4. Source: World Bank, Current international dollar 5. Source: Moody’s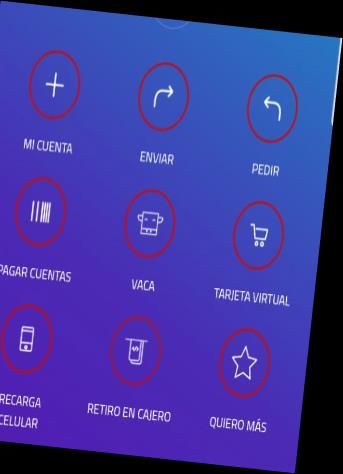
Macroeconomic environment
                                         A month of social unrest

 October 16th        October 19th           October 25th           Novimber 12th              November 20th

Massive evasion   State of emergency   The largest demonstration   President’s call      Constitutional accusation

       October 18th             October 22nd             October 28th             November 15th            November 21th

       Subway attacks          Social agenda             New cabinet             Political agreement       Social agreement

                                                                                                                 5   5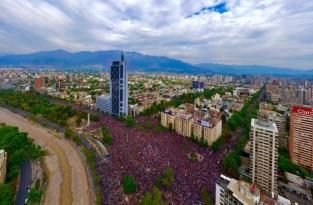
Macroeconomic environment
                          Some keys to the conflict

   Growth slowdown after commodity boom

   Persistent (although declining) inequality

   Lack of safety nets for new middle class

   Corruption scandals at different levels (Political parties,
   church, army, companies)

                                                                 6   6
Macroeconomic environment
                              Road map to a constitutional change

                                              Political agreement

                            NO                   Law to launch
                                                 constitutional
                                                   change

                                                                                                October 2020
                            Reject
Current constitution                                                    Approves   Constitutional convention/ Mixed
                                                Entry plebiscite
     remains                                                                                  convention
                                 April 2020

                                                                                            New constitutional text
    Jean-Baptiste Colbert

                                                                        July/October 2021
                                                                                                 Exit plebiscite
                                                                   NO

                                                                                                YES

                                                                                                New constitution

                                                                                                                   7   7
Macroeconomic environment
             Possible elements of the constitutional debate

     Political system

     Social rights

     Subsidiary role of the state

     Autonomous bodies of the state

                                                              8   8
Macroeconomic environment
                           Short-term impact of the social unrest

                 Electric generation                                       Asset prices
      (GWh, adjusted by holidays and weekends)
210                                                 5,300                                                      820
                                                                                      18-oct
                                      18-oct        5,200
                                                                                                               800
200
                                                    5,100
                                                                                                               780
                                                    5,000
190
                                                    4,900                                                      760

                                                    4,800                                                      740
180
                                                    4,700
                                                                                                               720
170                                                 4,600
                                                                                                               700
                                                    4,500
                                                                 IPSA       CLP
160                                                 4,400                                                      680
   01-07 22-07 12-08 02-09 23-09 14-10 04-11             01-08     01-09          01-10        01-11

 Source: Central Bank of Chile, CNE and Santander
                                                                                                       9   9
Macroeconomic environment
                Social Agenda will push up public deficit

                                   Public Deficit
                                    (% of GDP)
      3.5
                                                                 3.2
      3.0

      2.5                    2.3
                2.2
                                                    2.0
      2.0

      1.5

      1.0

      0.5

      0.0
               Oct           Nov                    Oct          Nov
                      2019                                2020

                                                                       10 10
Macroeconomic environment
GDP growth Outlook 2019-2020
GDP Investment
YoY real growth, % YoY real growth of fixed capital formation, %
4.0 4.7 4
1.0
1.6 1.5 1.7 1.5
-1.3
-2.7
2016 2017 2018 2019 (e) 2020(e) 2016 2017 2018 2019 (e) 2020 (e)
Inflation Central Bank ST Reference Rate
Annual change in UF inflation, % %
3.50
2.9 2.50 2.75
2.8 2.7 2.6 1.75 1.50
1.7
2016 2017 2018 2019 (e) 2020 (e) 2016 2017 2018 2019 (e) 2020 (e)
11 11
Source: Banco Central de Chile and estimates Santander ChileAgenda
Macro-economic environment
Strategy update
Results
12 12A leading bank
Santander Chile Figures
is the nation’s leading bank
in US$
Business and Results 09M19 (US$) YoY
Gross Loans 43.8 bn 6.4%
Deposits 31.4 bn 10.1%
Equity 4.7 bn 8.8%
Net income1 817 mn 4.9%
Network and Customers 09M19 Market Share
Clients 3.4 mn 21.5%2
Digital Clients 1.2mn 32.3%3
Offices 381 17.5%
Market Share2 09M19 Rank
Loans4 18.3% 1
Deposits4 18.2% 2
Checking accounts2 21.5% 1
Bank credit cards5 26.5% 1
1. Net income attributable to shareholder, last twelve months 2.Market share of clients with checking accounts. Source: CMF. As of August 2019 3. Average yearly market
share over clients that enter a website with a passkey. Excludes Banco Estado. Source: CMF. 4. Excludes loans and deposits of Chilean banks held abroad. 5. Market share in
terms of monetary amount of credit card purchases.
13 13Advances on our strategic objectives
Strategic priorities
Declaration
Our Our vision We want to be the best bank for our customers, leading in
purpose Be the best Bank digital excellence and experience, gaining their loyalty
Help people acting responsibly
and gaining the Clients
and
businesses to loyalty of our We want to be the best large company to work in Chile,
prosper clients, attracting and developing talent, always committed to our
shareholders, SPF culture
people and Employees
communities
We want to be recognized as a responsible bank that
Our way contributes to the community
of doing
things Community
Simple,
Personal, We want to be the most profitable and sustainable bank,
Fair with solid capital levels, attractive dividends and strong risk
management
Shareholders
Excellence in execution
14 14Strategy update
Clients: moving forward in our innovations
Challenge Approach Progress
Reactivate loan growth within Over 94,000 clients, including some
mass segment 30,000 Cuenta Life clients
Offer transactional products More than 10,000 clients, hard launch in
with access to digital economy 2020
Improve branch network to re-
attract clients in a digital/co- Reached 50 this year
working format
Increase SME access to banks Operations to start 1H 2020
Acquiring
and to digital economy
Enter the car loan market,
creating synergies with other Approved in Nov. 2019 by CMF.
bank products
Continue expanding cross-
selling with our clients with New subsidiary approved in Oct. 2019
better products
We have announced an investment plan of US$380 million for the period of 2019-
2021 in technology, branch upgrading and new products and services.
15 15Strategy update
Through our Life offer we aim to educate and incentivize our clients,
offering greater financial inclusion in the future
Quarterly new Life clients
43,681
12,971
9,585
8,751
8,483
7,653
6,846
481
+98,000
Total Life clients
Average score of 9 out
of 10 when asked if
they recommend Life,
our happiest clients
16 16Financial
inclusion
Digital Better
+17,000 +10,000 Generation Experience
Downloads Clients
Aimed at younger generation,
immigrants and people who have little
or no access to Banks
Provides access to the digital economy
such as Uber and Spotify
Clients have a separate assistance
channel
Nov
’18
Prelaunch
Testeam
May
’19
Employees-
fully
Jun
‘19
Employees’
families
Jul
‘19
Public soft
launch
Coming
soon
Media ramp-
up
›› Strategic
alliances,
integrating
new services
functional
including 17 17
physical cardResults
WorkCafé: Improving service and productivity
Points of sale Work Café
50
+1.1%
Traditional
381
331
377
9M18 9M19
Volume per branch1 Employees
6.8% -3.5%
143,762 11,439
134,573
11,037
9M18 9M19 9M18 9M19
18 18
1. Volume per branch calculated as total loans divided by number of branches.Strategy update
We are gaining market share in current accounts
Total current accounts 1 Net increase in current accounts 7M191
Thousands of number of current accounts Thousands of number of current accounts
Total current accounts Market share New curent accounts Market share
1,300
21.6% 25.00%
24.1%
1,100
20.6% 60 25.00%
17.2%
20.00%
1,076 1,027 14.2% 14.1% 50
55.2 15.8% 20.00%
900
15.00%
15.2%
9.8%
40
10.1% 8.8%
15.00%
9.6% 6.8% 39.3
700
709 701 10.00%
30
34.8 5.8% 36.1 10.00%
500
20 5.00%
489 476 5.00%
23.1
300
20.1
340 0.00%
10
13.2
0.00%
100
00 -5.00%
Santander Banco de Chile Banco Estado BCI Scotiabank Falabella Itau Corpbanca
(100)
Santander Banco de Chile Banco Estado BCI Scotiabank Falabella Itau Corpbanca -5.00%
Total retail current accounts
+9.6%
1,046,746
955,012
sept.-18 sept.-19
19 19
1. Source: CMF, Current accounts include in local and foreign currency. Net increase is the variation of total accounts between December 2018 and July
2019, latest information availableStrategy update
Accelerating account openings through Superdigital, Life and
traditional bank accounts
Total gross new accounts (checking+ Life+ Superdigital)
+155.2%
86,439
47,113
42,312 40,700
33,865
33,230 32,781
+83.5%
1Q18 2Q18 3Q18 4Q18 1Q19 2Q19 3Q19
20 20Strategy update
Acquiring Entering the acquiring business in 2020
Position and market share1
Total
#3 Number of monetary
Credit card Stock operations
#1 #1
amounts
10% 24% 30%
Debit card
#1 #2 #1
36% 25% 26%
Composition of retail payments in Chile2 Payments by Internet, Cards and ATMs2
(% of monetary total of payments) (billons of Chilean pesos) CAGR
75,000
2013 2018 (*) 65,000
63,679 18.3%
2% 8% 55,000
2%
2% 45,000
46,082 17.1%
4% 14%
27,505
35,000
5% 27,270
4% 25,000
20,923
8.3%
2%
15,000
18,276
5,000
6% -5,000
70% 2013 2014 2015 2016 2017 2018 (*)
81% ATM withdrawals Internet transfers Bank and Non-bank Cards
Only 30-40% of shops
use POS3
21 21
1. CMF Chile , latest information available 2.Source: Central Bank of Chile 3. Santander Chile estimatesStrategy update
Continuing to improve our client satisfaction and NPS
As of June 2019
Net Promoter Score1
• Transparency
Santander Peer group
Top 2 #1 in •
•
Innovation
Promotions
41%
39%
35%
40%
35% • Relationship Manager
Attributes
33%
• Contact Center
2H18 1H19 2H19 • Web
Net Global Satisfaction1
#2 in • App
Santander Peer group
Top 2
56% 55% 54%
54% Our clients with a Life Credit
52% 51% Card have a NPS of 67 and Net
Satisfaction of 90
2H18 1H19 2H19
22 22
Source: Study by Activa for Santander with a scope of 60,000 surveys to our own clients and over 1,200 surveys to each competitor’s clients in the six month period. Measures the Net Global Satisfaction and Net
Promoter Score in three main aspects: service quality, product quality, and brand image. % of clients that value with grade 6 and 7 subtracted by clients that value with grade 1 through 4. Audited by an external
provider.Entering the auto lending business
Total loans NPLs and coverage
Ch$bn. Var. % YoY %
135.7%139.5%135.4%
12.0%
124.1% 150.00%
CAGR=17.8% 10.0%
100.4% 108.5% 130.00%
+22.2% 83.8% 110.00%
13.3% 7.9% 5.0% 32.5% 28.3%
8.0%
90.00%
700
0.0%
6.0%
NPLs Coverage 70.00%
600
388 343 419 -100.0% 50.00%
500
218 228 303 -200.0%
4.0%
5.6%
400
300 202 -300.0%
2.0% 4.2%
30.00%
200
100
-400.0%
-500.0%
3.2% 2.8% 2.7% 2.6% 2.6%
10.00%
0.0% -10.00%
- -600.0%
2014 2015 2016 2017 2018 jun.-18 jun.-19
Loans Var. %
Net income ROE & ROA
Ch$bn
% 22.9% 23.4% 22.0% 21.0%
20.1%
CAGR=18.1% 15.9% 17.4%
+21.6%
12.6 11.0
9.7 8.4 6.8
5.6 5.6
4.4% 3.8%
2.8% 3.3% 2.6% 3.0% 3.0%
2014 2015 2016 2017 2018 jun.-18 jun.-19 2014 2015 2016 2017 2018 jun.-18 jun.-19
ROE ROA
23 23The first 100%
digital
insurance
broker in Chile
• Open insurance market
• Digital distribution model
• Alliance with Zurich
• Open and flexible platform
• Recommended offer in just four steps
• 100% customized offer by customer (amount, coverage, other assistance)
The idea is SIMPLE PERSONALIZED TRANSPARENT
that You can hire insurance We offer you the best Hiring an insurance will
insurance quickly and 24/7, option of protection, be fast and without
suits your avoiding paperwork and according to the needs detours, that's why we
life and not long hours of meetings. you have. eliminate the fine print
the other We know what you want: and we explain
way around Simple, clear and quick everything you need to
explanations. know so that you hire
24 24
informed.Strategy update
Responsible banking
54%
Female
46%
Male
40 hour work week Ch$760,875 monthly
By collectinve bargaining 75%
Unionized employees (US$12,500 yearly)
11,037 agreement Minimum wage in
Total employees Santander
(vs Ch$301,000 monthly)1
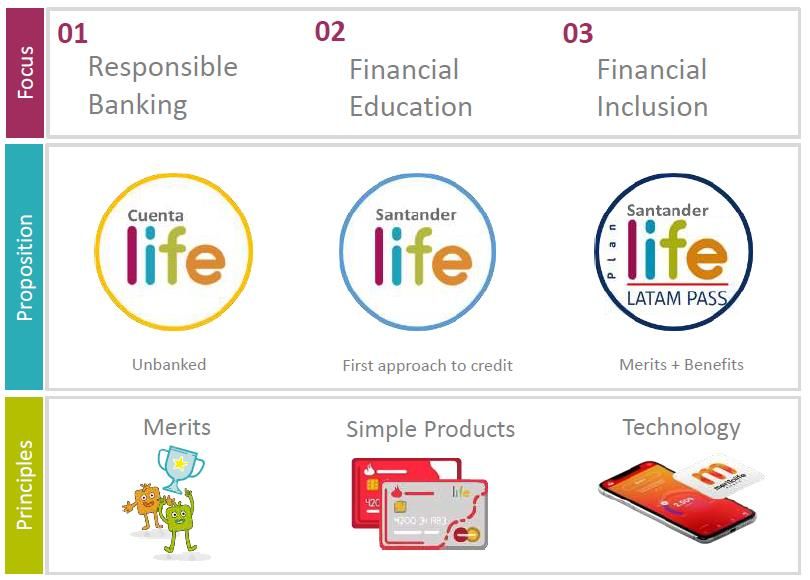
GPtW result Gender equality
Average area and corporate result
Santander signed an agreement with the
Ministry of Women and Gender Equality,
which promotes equality and personal and
86 work life balance. The agreement is an
invaluable tool to deepen gender equality
83 policies.
79
76
2015 2016 2017 2018
25 25
1. Excludes collections and VOX employees who are subject to a different collective bargaining agreement.Strategy update
Responsible banking
Our purpose
Contribute to the progress of We are one of the 19 companies in Chile
of businesses and people included in the FTS4Good Emerging Markets
and Latin America. We are highly ranked
compared to other banks in Environmental
Our mission
and Social
To be the best bank, acting
responsibly and gaining the
We are included in DJSI Chile and DJSI MILA
confidence and fidelity of our
employees, clients, shareholders (Chile, Colombia, Mexico and Peru).
and the society
Our how Our seal
Simple, Excellence
Personal, Fair in
execution
26 26Strategy update
Preparing for the transition to BIS III
Core capital BIS ratio
10.2% 10.6% 10.2% 13.4%
13.0% 12.8%
9M18 12M18 9M19 9M18 12M18 9M19
27 27Strategy update
Preparing for the transition to BIS III
RWA density* New capital requirements
81 Credit risk
75 69
59 57 56 49 45 45
38 32 32
10,5%
• A normal transition to BIS III should be positive for 8%
our capital ratios in 2021
• Hybrid instruments will be recognized as capital
(AT1 and preference shares)
• Systemic buffer & operational risk regulations
published for consultation
* BIS. RWA density= Risk weighted assets /total assets. The Banker database July 2017. ** Subordinated bonds allowed up to 50% of CET1
Chile includes credit and market risk
28 28Agenda
Macro-economic environment
Strategy update
Results
29 29Results
Positive evolution of funding mix
Total Deposits
Ch$bn 9M19 YoY
+10.1% Ch$ bn
+3.8% Demand deposits 9,463 18.5%
20,762 21,809 21,462 22,032 22,868
Time deposits 13,405 4.9%
Total Deposits 22,868 10.1%
Sep-18 Dec-18 Mar-19 Jun-19 Sep-19
CLP Time Deposit Cost Evolution5 Demand deposits by segment
3.13% 3.07%
2.86% 2.83% Ch$ bn 9M19 YoY
2.75% 2.76% Individuals 3,118 8.5%
2.50%
1.75% SMEs 1,540 15.3%
Retail 4,658 10.7%
Middle Market 2,738 14.4%
31-12-2017 30-09-2018 30-06-2019 31-10-2019
Corporate (SCIB) 1,733 60.8%
Total2 9,463 18.5%
Santander Chile BCI Central Bank Rate
30 30
1. Banco Santander Chile is the exclusive broker of mutual funds managed by Santander Asset Management, a subsidiary of SAM Investment Holdings Limited. 2. (Net Loans – portion of mortgages funded with long-term bonds)
/ (Time deposits + demand deposits). 3. LCR: Liquidity Coverage Ratio under new SBIF rules. 4. NSFR: Net Stable Funding Ratio according to internal methodology. This is not the Chilean model 5. Source: CMF. Quarterly
Calculation is based on time deposit in CLP average and interest paid on time deposits in pesos. August rate considers the last 3 monthsResults
Loan growth driven by Retail banking
Total Loans
Ch$ bn 9M19 YoY
Ch$bn
+6.4% Individuals1 17,925 9.6%
+2.6%
Consumer 5,062 8.1%
29,973 30,282 30,600 31,095 31,905
Mortgages 10,900 11.0%
SMEs 4,040 5.3%
Retail 21,965 8.8%
Middle Market 8,004 5.1%
Corporate (SCIB) 1,776 (12.4%)
Total2 31,905 6.4%
Sep-18 Dec-18 Mar-19 Jun-19 Sep-19
2019: Loan growth forecast ~8% driven by retail loans
31 31
1. Includes other commercial loans to individuals. 2. Includes other non-segmented loans and interbank loansResults
Slope of LT interest rates negative during the quarter
10Y Nominal Central Bank Notes Rate vs Monetary Policy Rate1
%
Negative slope in LT
Now slope of LT
rates fell faster than
rate is increasing,
4.25 ST rates. This
4.03 as the Monetary
incentivized
Policy Rate has
refinancing of
decreased
mortgages
3.16
2.51
2.50
2.00
1.75
Jan-19 Feb-19 Mar-19 Apr-19 May-19 Jun-19 Jul-19 Aug-19 Sep-19 Oct-19
CHBCP10Y MPR
32 32
1. Source: BloombergResults
Higher inflation in 2Q19 drives recovery in NIMs
NIM1 & Inflation Net Interest Income
5.0%
4.5% 4.5% 4.4%
5.50%
Ch$ bn 9M19 YoY
4.5% 4.4% 4.4%
4.0% 4.50% Net interest income 1,041 (1.5%)
4.0%
3.9%
3.50%
Average interest-earning assets 34,684 7.2%
3.5%
3.00% Average loans 30,672 7.6%
2.75% 6.5% -30bp
3.0%
2.50% 2.50% 2.50% 2.50%
Interest earning asset yield3
2.5%
Cost of interest bearing liabilities4 3.5% +0bp
2.00% 1.50%
2.0% NIM YTD 4.0% -40bp
1.2% 0.50%
1.5%
0.6% 0.7% 0.7% 0.8% 0.5%
1.0% 0.0% -0.50%
1Q18 2Q18 3Q18 4Q18 1Q19 2Q19 3Q19 4Q19
NIM (1) MPR (2) UF
Stable NIM outlook for the rest of the year
33 33
1. Annualized Net interest income divided by average interest earning assets. 2. MPR: Monetary Policy Rate. 3.Annualized gross interest income divided by average interest
earning assets. 4. Annualized interest expense divided by sum of average interest bearing liabilities and demand deposits.Results
Positive evolution of asset quality
Total loans Commercial loans
% of loans % of loans
137% 130% 133% 128%
122% 117%
6.4% 6.0% 5.8% 7.2% 6.7% 6.7%
2.1% 2.2% 2.0%
2.4% 2.6% 2.4%
Sep-17 Sep-18 Sep-19 Sep-17 Sep-18 Sep-19
NPL(1) Impaired loans (3) Coverage ratio (2) NPL Impaired loans Coverage ratio
Consumer loans Mortgage loans
% of loans % of loans
315% 320% 10.0%
290% 43.9%
40.1% 37.6%
7.3%
6.0% 5.0% 4.8%
5.2% 4.8%
2.0% 2.0% 1.6% 1.7% 1.7% 1.5%
0.0%
Sep-17 Sep-18 Sep-19 Sep-17 Sep-18 Sep-19
NPL Impaired loans Coverage ratio NPL Impaired loans Coverage ratio
34 34
1. 90 days or more NPLs. 2.Impaired NPLs + restructured loans 3. Loan loss reserves over NPLs.Results
One time provision expense of Ch$31 billion in the quarter
NPLs & Cost of risk (%)1 Provision for loan losses
%
2.1 2.0
Ch$ bn 9M19 YoY
Provision for loan losses (268,443) 6.6%
1.0 1.0
Cost of risk (YTD)1 1.0% +0bp
NPL Cost of risk
sept-18 sept-19
2
One-time provision expense for new standardized model for commercial loans analyzed on a group
basis was recognized in July 2019: Ch$31bn
35 35
1. Provision expense annualized divided by average interest earning assetsResults
Good growth in non-NII across business segments
Non-interest income (fee + financial trxs) Non-interest income
Ch$bn
-5.8% Ch$ bn 9M19 YoY
+120.1%
223.0
210.0 Retail 191.4 6.2%
Middle Market 41.1 5.9%
153.0
Corporate 94.0 48.5%
69.0 Subtotal 326.6 15.7%
Others 36.4 249.2%
Fees Financial trx Total non-interest income 363.0 24.0%
sept-18 sept-19
36 36Results
Investing to improve productivity and efficiency
Efficiency ratio(%), headcount &
branches
Ch$ bn 9M19 YoY
11,439 11,037
Personnel expenses 304.3 2.2%
Administrative expenses 178.0 (2.7%)
Depreciation 78.4 35.9%
Operating expenses1 560.8 4.1%
40.0 40.6 377 381
Efficiency ratio(2) Headcount Branches
sept-18 sept-19
37 37
1. Operating expenses excluding Other operating expenses 2. Efficiency ratio: Oper. Expense excluding other operating expenses / Net interest income + fee
income + financial transactions, and Other operating income, netGracias Nuestra misión es contribuir al progreso de las personas y de las empresas. Nuestra cultura se basa en la creencia de que todo lo que hacemos debe ser Simple Personal Fair
You can also read