Bang the Can Slowly: An Investigation into the 2017 Houston Astros
←
→
Page content transcription
If your browser does not render page correctly, please read the page content below
Bang the Can Slowly: An Investigation into
                                                   the 2017 Houston Astros
                                                                   Ryan Elmore
                                                Department of Business Information and Analytics
                                                 Daniels College of Business, University of Denver
arXiv:2009.04576v1 [stat.AP] 9 Sep 2020

                                                                       and
                                                               Gregory J. Matthews
                                                   Department of Mathematics and Statistics
                                                            Loyola University Chicago
                                                               September 11, 2020

                                                                        1
Abstract
This manuscript is a statistical investigation into the 2017 Major League Baseball
scandal involving the Houston Astros, the World Series championship winner that
same year. The Astros were alleged to have stolen their opponents’ pitching signs in
order to provide their batters with a potentially unfair advantage. This work finds
compelling evidence that the Astros on-field performance was significantly affected
by their sign-stealing ploy and quantifies the effects. The three main findings in
the manuscript are: 1) the Astros’ odds of swinging at a pitch were reduced by
approximately 27% (OR: 0.725, 95% CI: (0.618, 0.850)) when the sign was stolen,
2) when an Astros player swung, the odds of making contact with the ball increased
roughly 80% (OR: 1.805, 95% CI: (1.342, 2.675)) on non-fastball pitches, and 3) when
the Astros made contact with a ball on a pitch in which the sign was known, the ball’s
exit velocity (launch speed) increased on average by 2.386 (95% CI: (0.334, 4.451))
miles per hour.
Keywords: Baseball, sports statistics, generalized linear mixed model
21 Introduction
Prior to each pitch in a baseball game, the pitcher and the catcher will communicate
information on the type of pitch (e.g., fastball, curveball, etc.) to be thrown. The brief
exchange ensures that the catcher knows exactly what to expect from the pitcher in order
to react appropriately. This is important because different types of pitches may look very
similar leaving the pitchers hand, however, they may exhibit wildly different behavior as
they travel toward home plate.
The standard method of communication relies on the catcher flashing hand signals
between his legs as he is squatting behind home plate. In this manner, the pitcher can see
what is being relayed, but the sign is usually hidden from the batter’s view. The pitcher
will confirm or change a sign of a particular pitch by nodding his head “yes” or “no”,
respectively, to the catcher. Once they are in agreement, the pitcher winds up and throws
the pitch.
It is important that the catcher obscure the signs from the batter so that the batter
does not know the type of pitch that is coming next. A pitcher relies on this uncertainty in
order to confuse the batter and ultimately achieve a more favorable outcome for his team.
On the other hand, if the batter knows the type of pitch that is coming, he may reduce
the pitcher’s considerable advantage. One way for the batter to learn the pitching sign
is for the batter’s team to steal the signs from the catcher, decode the signals, and then
somehow share the decoded signal with the batter. During the 2017 Major League Baseball
(MLB) season, the Houston Astros are alleged to have implemented a elaborate sign-stealing
scheme. In 2019, Mike Fiers, a pitcher for the Houston Astros during their 2017 World
Series championship run, claimed that his former team was stealing signs by using a camera
in center field, Walstein (2019). The information in these stolen signs was relayed to players
3by banging a baseball bat against a trash can (Rosenthal & Drellich 2019), referred to here
as a “bang”. In this particular scheme, a bang indicated to the batter that the upcoming
pitch would be an off-speed pitch such as a curveball or a slider. The absence of a bang is
inconclusive; it could indicate a fastball or that they simply could not decode the sign.
Ultimately, MLB punished the Houston Astros by suspending their manager, A.J. Hinch,
and general manager, Jeff Lunhow, for one year. Additionally, the Astros were fined $5
million and their first and second round draft picks were taken away for the 2020 and 2021
amateur drafts. This was a substantial penalty, and meant to dissuade future teams from
impacting their games in a similar manner.1
However, not everyone agrees on the effects of stealing pitching signs during an MLB
game. In one particularly bizarre exchange during a press conference on February 13, 2020,
the owner of the Astros, Jim Crane, was quoted as saying “Our opinion is this didn’t
impact the game. We had a good team. We won the World Series and we’ll leave it at
that.” In that same press conference, less than a minute later, he is also quoted as saying,
“I didn’t say it didn’t impact the game.” See Axisa (2019) for more information on this
press conference.
Others, have found many striking examples of different aspects of the game that appear
to show that that Houston benefited from sign stealing. For instance, Sawchik (2019)
notes a large decrease in strikeout rates for the Astros from 2016 to 2017. Stark & Sarris
(2020) reaches similar conclusions to Sawchik (2019), while also noting large differences
in strike out rates between home and away games, notable drops in swing rates for some
players from 2016 to 2017, and large increases in slugging from 2016 to 2017. In addition,
they found several players had dramatic decreases in their strikeout rates, notably George
1
The Boston Red Sox were also swept up in the scandal by way of Alex Cora, formerly the bench coach
of the Houston Astros, who coached the Red Sox in 2018 to a World Series Championship. He is alleged to
have developed a sign stealing system in Boston, and was subsequently fired by the Red Sox.
4Springer, Carlos Correa, Evan Gattis, and Jake Marisnick. Arthur (2019) found intraseason
improvements before and after he first observed the implementation of the Astros’ scheme
(May 19th) in both swinging strike rates and swinging at likely balls. Arthur (2019) also
notes an improvement in exit velocity. Alternatively, Lindbergh (2019) found little evidence
that the Astros gained much by stealing signs when looking at overall performance.
While there has been quite a bit of analysis on the on-field effects of the Astros’
sign stealing, it is still largely an open question as to whether or not there were on-
field improvements because of the sign stealing. In addition, if stealing signs did lead to
improvement, what types of improvements were observed and can the magnitude of these
improvements be quantified. In this paper, we attempt to erase any ambiguity related to
the efficacy of the Astros’ sign-stealing scheme during the 2017 season. In other words, we
address whether or not their scheme affected on-field performance during the 2017 season
and quantify their impacts where appropriate.
The paper is outlined as follows. We describe the three data sets that we used for this
analysis in Section 2. Next, we present our strategy and methodology in Section 3. Our
results are presented in Section 4 and finally we close with our concluding remarks and a
discussion in Section 5.
2 Data
In the analysis that follows, we rely on, and leverage the strengths from, three distinct
data sources: Statcast, Pitch Info, and Bangs. Each source is described in the following
paragraphs.
Statcast is Major League Baseball’s ball and player tracking system that has been in
every MLB park since the 2015 season. A new version of Statcast, Version 2.0, is set to
5be released in 2020. The Statcast V1.0 system has two data collection components: (1)
Trackman Doppler Radar that tracks baseball events and Chryon Hego Cameras that track
player movements. In the first three seasons alone, 2.1 MM pitches and 400K balls in
play were tracked. Examples of variables that are available in Statcast include a hit’s
launch speed (exit velocity), pitch classification, pitch spin rate, among a host of additional
measurements. See Major League Baseball (2020) for additional information related to
MLB’s Statcast application programming interface (API).
Although pitch classification is available in Statcast, we relied on Pitch Info Pavlidis &
Brooks (2020) data for classifications rather than Statcast. Pitch Info is regarded as the
most accurate classification system in terms of pitch group classification in the industry.
In addition, we utilize Pitch Info’s derived variable, referred to as called strike probability
(CSP) as a covariate in our analysis. CSP is an estimate of the probability that a pitch will
be called a strike. Full details related to the CSP model can be found here Judge & Brooks
(2015).
Finally, we merge the previous two data sets with the so-called Bangs data. These data
contain information on whether or not a measurable, auditory signal was present prior to
pitches on a selection of Astros’ at-bats during a subset of their Astros’ 2017 season’s home
games. The signal, if present, was the result of banging a hard object on a metal trash
can. The data were compiled by Tony Adams, a self-described Astros fan, and are publicly
available on his website (Adams 2019). The data are essentially a combination of data
obtained from Major League Baseball’s Statcast API along with video of Houston Astros’
games from Youtube. Adams matched timestamps from the MLB Statcast data to the
game video, and produced a spectrogram to represent the audio before and after all pitches
in his study. The spectrogram of the auditory footprint of each of these pitches was used to
identify when bangs were present prior to a pitch.
6The original Bangs data set has n = 8274 observations, however, we had to remove
a number of observations. For instance, we removed observations with missing pitch ids,
bunts/bunt attempts, ambiguous pitch groups, among other oddities. The resulting data
set has a total of n = 8201 observations and are available on our github site Matthews &
Elmore (2020).
After combining the three data sets described above, we summarized the bangs looking
for trends over time, as well as trends among the individual players. Figure 1 (Baumer &
Matthews 2017) shows the number of bangs per month relative to the total number of at
bats in our data set. It is easy to see that the proportion of bangs per month increased
steadily through the first five months of the 2017 season and then dropped off in September.
This suggests that the Astros became more confident as the season progressed and/or it
took them a while to refine their sign-stealing system.
In addition to the bangs per month, we looked at the number of pitches that included a
bang for various players. Specifically, we selected nine players with the most pitches thrown
to in our combined data set and looked at how many plate appearances included a bang
and how many did not. Clearly, it would appear that certain players preferred to not hear
the bang alert (e.g., Jos Altuve and Josh Reddick) at the same rate as the rest of the team.
Next, we looked at the prevalence of bangs for different types of pitch groups, as defined
in Pitch Info, see Table 1. It is immediately clear that there is a relationship between
pitch group and the incidence of a bang. In fact, a χ2 -test of independence yields a p-value
of < 2.2 × 10⁻¹⁶ , strongly rejecting the null hypothesis of independence between the two
variables. In particular, offspeed pitches such as change-ups (CH), curveballs (CU), and
sliders (SL) show a bang prior to the pitch at rates of 23.7%, 27.6%, and 26.8%, respectively.
On the other hand, fastballs (FA) only had a bang prior to the pitch on 2.3% of the pitches.
So while the Astros’ method was not perfect, it is obvious that information such as an
7Figure 1: This figure shows the proportion of bangs per month in our combined data set. It
is clear that the Astros became more confident in their sign stealing system as the season
progressed.
89 Figure 2: This figure shows number of pitches and bangs for the nine players on the Astros who had the most at bats in our final data set.
upcoming offspeed pitch was being transmitted to the batter via the trash can banging
system.

Table 1: The number of pitches of Pitch Info pitch group and the incidence of bangs. The
percentages correspond to the bang prevalence conditioned on pitch type category.

                                                  Pitch Type
                          Change-up       Curveball       Fastball         Slider
                    No    756 (76.3%)   707 (72.4%)    4128 (97.7%)     1470 (73.2%)
          Bangs
                    Yes   235 (23.7%)   270 (27.6%)         97 (2.3%)    538 (26.8%)

   Finally, Table 2 shows the relationship between swinging at a pitch and whether or
not there was a bang preceding the pitch. Given the presence of a bang, an Astros’ player
swung 40.5% of the time as opposed to 46.2% when there was no bang. This translates to
an odds ratio of 0.793 (95% CI: 0.69678, 0.9023; p-value 3.706 × 10⁻⁴ ) , which indicates an
approximate 21% reduction in the odds of swinging given a bang relative to when there
was no banging before the pitch. While there is certainly a significant relationship between
swinging and the presence of a bang, there are many additional variables that can confound
this relationship. We will explore this in more detail in the following section.

Table 2: The number of pitches with bangs by the number of swings. Percentages correspond
to the percentage of swings given bangs/no bangs on the pitch.

                                                    Swing
                                             No               Yes
                                  No    3798 (53.7%)    3263 (46.2%)
                      Bangs
                                  Yes    678 (59.5%)     462 (40.5%)

                                             10
3 Methodology
In this section, we describe our approach to analyzing several possible effects of stealing
signs on measurable, in-game quantities. We employ a layered, or conditioned, approach to
our analysis in that we start with an investigation into the effect on swinging at a given
pitch, refine our data and methods to examine whether a swing results in making contact
with the ball, and finally we investigate the quality of contact through exit velocity at our
most granular level.
In their most general form, we are simply fitting generalized linear mixed models (GLMM)
in each case (McCulloch & Neuhaus 2014). The particular GLMM is determined by its
response variable and covariates, however, they can be defined in general using Equation
(1) by
η = Xβ + Zb. (1)
Here η is referred to as the linear predictor and is related to the response of interest through
a link function g(·), X is a matrix of covariates, β is a vector of parameters (fixed-effects),
Z is the random effect design matrix, and b is the vector of random effect parameters. The
specific GLMMs that we utilize are defined by the response variables of interest, the link
g(·), covariates, and random effect terms. The specific terms are given explicitly in the
following subsections.
3.1 Swing Model
We developed our first GLMM in order to estimate the effect of stealing a pitching sign
on swinging at the subsequent pitch. Specifically, let Yij be an indicator for the j th player
11swinging at the ith pitch, i = 1, · · · , nj and j = 1, · · · , Nplayers . The link function in this
π
situation is the well known logit(πij ) = log 1−πijij , where πij = P (Yij = 1) conditioned on an
indicator variable for the presence or absence of a bang, while controlling for pitch type
(i.e., fastball or not), CSP, pitch count (as a factor). By pitch count, we mean the number
of balls and strikes that a batter has while facing the current pitch. Additionally a random
slope term for each batter is included in the model.
3.2 Contact Model
Given that a swing occurred, we now focus our attention on whether or not contact was
made with the ball. In other words, did the batter actually hit the ball (not necessarily
hit in play) that was pitched when he swung? In this case, we define another binary
response variable to be Yij = 1 if the j th player made contact with the ball on the ith
pitch, i = 1, · · · , nj and j = 1, · · · , Nplayers . Similar to the situation given in the previous
subsection, the link function in this model is the logit(πij ) where πij is the probability of
making contact given fixed-effect covariates defined by CSP, an indicator variable for a
fastball, an indicator variable for the presence of a bang, and an interaction term between
fastball and bang. We include random intercepts for both pitcher and batter as well as a
random slope for bangs for battter.
3.3 Exit Velocity Model
Finally, the hierarchical nature of our modeling process leads us to examining a hit’s exit
velocity (EV) based on the presence of bangs prior to the pitch. Given that the batter
swung at the pitch and made contact with the ball, was exit velocity impacted by stealing
the pitching sign? In other words, are hits better given knowledge of an upcoming pitch? A
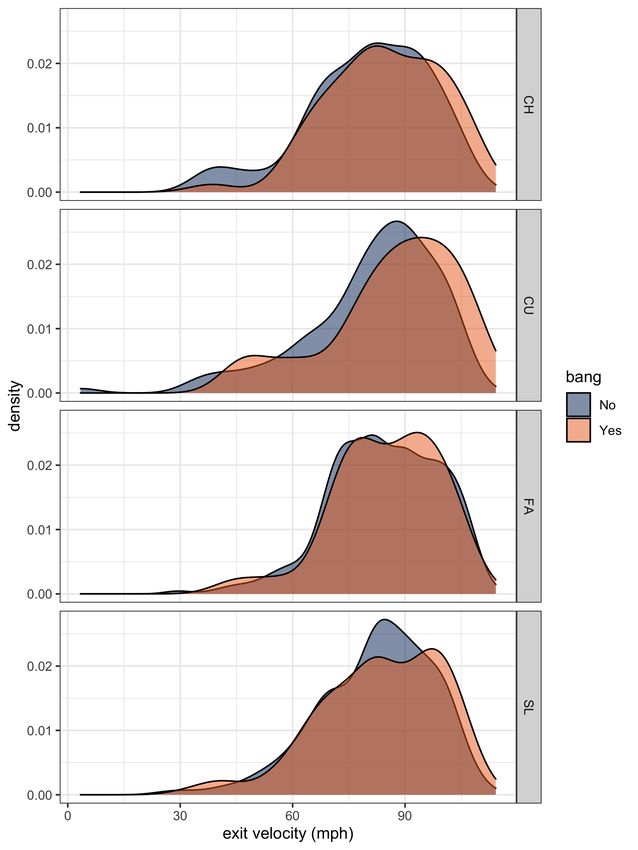
12preliminary look at EV by pitch type (see Figure 3) suggests that the average EV might be
higher when a bang is present on off-speed pitches.
The specific GLMM model in the case is a simpler form than the two described above.
We treat Yij , the exit velocity of the ball leaving the bat, as a continuous variable. Therefore,
the link function is simply the identity and, hence, we use a standard linear mixed-effects
model. Covariates in this model include CSP, an indicator variable for fastball, an indicator
variable for the presence of a bang, and random intercepts for both pitcher and batter.
4 Results
4.1 Swing Model
The results of fitting the model described in Section 3.1 are give in Table 3. Of primary
interest, the coefficient estimate for the bangs indicator variable is -0.3219 (95% CI: (-0.482,
-0.163), p-value: 7.59 × 10⁻⁵ ) indicating that when there were bangs prior to a pitch, the
batter was significantly less likely to swing at that pitch relative to pitches with no bangs
present. When all other covariates are help constant, the odds ratio for the probability of
swinging comparing bangs to no bangs is 0.725 (95% CI: (0.618, 0.850)). This translates to
an approximate 27.5% reduction in the odds of swinging in the presence of a bang. This is
conclusive and statistically significant evidence that on-field behavior was directly affected
by stealing the pitcher’s sign. That is, the act of banging on a drum prior to a pitch (to
indicate the ensuing pitch type) provided significant information to the batter causing him
to swing less often.
It is worth discussing why a player might swing more often given that he knows a fastball
is being pitched. Simply put, fastballs are easier to hit. Verducci (2020) states that the
1314 Figure 3: This figure shows exit velocity by four different pitch types. The pitch types are change up (CH), curveball (CU), fastball (FA), and slider (SL). The non-fastball pitchtypes are all off-speed pitches.
MLB batting average is approximately 20% - 40% higher on fastballs and that the off-speed
pitches lead to less contact. In other words, it is extremely useful for the batter to know
that a harder-to-hit off-speed pitch is coming.

4.2    Contact Model
Next, we looked at estimating the probability of making contact with a pitch given that a
player swung the bat. If a player has prior information about an upcoming pitch (e.g., the
pitch is not a fastball), then we posit that the player is less likely to miss the ball entirely
given the knowledge of pitch-type.
   Prior to fitting this model, pitches where the player did not swing were removed from the
data set, along with several unrelated and rare results, e.g. batter or catcher interference.
This leaves 3725 observations. Given that a swing occurs, we defined “contact” on a pitch
as any result other than a swing and miss occurs. Therefore, a ball put in play, regardless
of whether or not they made an out, a foul ball, or a home run are all treated equally as
“contacts”.
   A summary of the results of fitting the model described in Section 3.2 are given in Table
4. Notice that both the indicator variable for banging on the can and its interaction effect
with the fastball indicator are both significant. For this reason, we interpret fastballs and
off-speed pitches separately. First, the estimated effect size for bangs is 0.591 (95% CI:
0.294, 0.984) on off-speed pitches. This corresponds to an odds ratio of 1.805 (Bootstrapped
95% CI: 1.342, 2.675, see Efron & Tibshirani (1986)). In other words, given that a player
swings at the pitch, the odds of making contact in the presence of a bang (the pitching
sign is known) are about 80% higher than the odds of making contact when a bang is not
present. Once again, we have found evidence that banging on a trash can prior to a pitch,
or stealing the pitcher’s sign, demonstrably affects on-field performance.

                                              15
Next, we will consider fastballs. The coefficient for bangs when the pitch is a fastball is
-0.603. This corresponds to an odds ratio of 0.547 (Bootstrapped 95% CI: 0.227, 1.774).
While this odds ratio is not significantly different than one, an odds ratio less than one here
would mean that a player is less likely to make contact in the presence of a bang. A bang
prior to a pitch that turns out to be a fastball is actually a mistake on the part of the sign
thief (i.e., the batter is expecting an off-speed pitch). It would not be surprising to see that
batters have a harder time making contact on a pitch when they were expecting a pitch
that was different than what was actually thrown.
Table 5 shows player-specific odds ratios for off-speed pitches, along with corresponding
95% confidence intervals. The estimates are derived from the player-specific slopes associated
with the indicator of bangs for all of the Astros’ players having seen a pitch in our data set.
Furthermore, the bootstrap sampling distributions of the estimates for the nine players who
faced the most pitches are displayed in Figure 5. It is clear from Table 5 that any increase
in the probability of contact on off-speed pitches given a bang prior to the pitch was highly
variable across players. In fact, of the twenty players included in our data set, ten of them
do not exhibit a statistically significant increase in the odds of making contact on off-speed
pitches given a swing (i.e., their confidence interval contains 1).
The ten remaining players George Springer, Yulieski Gurriel, Jacob Marisnick, Evan
Gattis, Josh Reddick, Max Stassi, Carlos Correa, Carlos Beltran, Norichiak Aoki, and
Anthony Kemp, on the other hand, all exhibited significant increases in their respective odds
of contact given the presence of bangs prior to the pitch. Nine of these ten remaining players
had increases in their odds of contact on off-speed pitches ranging from 68% (Anthony
Kemp) to 159% (Yulieski Gurriel). However, one player, George Springer, seems to have
benefited much more than the other players with an estimated 281% increase in the odds of
contact on an off-speed pitch when a pitch was preceded by a bang.
16To put this in perspective, in our data set we have 390 records of George Springer
swinging and 135 of those swings were at off-speed pitches. Ninety-five of these swings at
off-speed pitches were not preceded by bangs and 31 of these swings resulted in no contact
for a swing-and-miss rate of 32.63% (95% CI: 23.57%, 43.12%). Out of the remaining 40
swings at off-speed pitches that were preceded by bangs only 2 resulted in no contact. This
corresponds to a miss rate of only 5% (0.87%, 18.21%).
Using data obtained from Fangraphs (2020), Figures 4a and 4b show George Springer’s
contact percentage and swinging strike percentage, respectively, over the course of his career.
Interestingly, Springer’s contact percentage on swings over the course of his career, his two
highest years of contact percentage were in 2017 and 2018 (78.7% and 78.5%, respectively),
which are the two years that the Astros were accused of stealing signs. We see a similar
pattern on swinging strike percentage in that Springer’s career lows occur in 2017 and
2018 (9.5% and 9.6%), followed by an increase in 2019. Neither of these plots on their own
are evidence of cheating as there could be numerous alternative explanations for this drop
in swinging strike rate/increase in contact rate. However, these plots are consistent with
evidence presented above that Springer was making contact at much higher rates when
swinging at off-speed pitches preceded by a bang.
4.3 Exit Velocity Model
To fit the exit velocity model, we restricted the observations used in this model to only
include instances where contact (as defined above) was made and a launch speed, or exit
velocity, was recorded. This leaves 2272 observations for our final analysis.
Coefficient estimates for the exit velocity model are given in Table 6. The coefficient
estimate for indicator of banging on a can in this model is 2.386 (95% CI: 0.334, 4.451).
Therefore, we estimate that when a batter makes contact with ball on a pitch preceded by
17(a) Contact Probability (b) Swinging Strike Percentage
Figure 4: The percentage of swings in which George Springer made contact over each year
in his career is given in panel (a). Swinging strike percentage over the same time period is
shown in panel (b).
1819 Figure 5: This figure shows the player-specific bootstrap sampling distributions of the intercept and slope (associated with the indicator variable for banging) parameters for the nine players on the Astros who had the most at bats in our final data set.
bangs their exit velocity is 2.386 miles per hour greater on average than on pitches that
were not preceded by a bang, when every other variable is held constant. To put this in
perspective, a ball hit at 100 miles per hour at a launch angle of 30 degrees will travel
roughly 385.3 feet before it hits the ground (Nathan 2020). A ball hit with the same launch
angle, but with an exit velocity of 102.38 (i.e., 2.386 miles per hour more) will travel 397.9
feet before hitting the ground, or 12.6 additional feet. This is the difference between a long
fly ball to straight away center field (likely an out) and a home run at Fenway Park, where
a home run is 389’ 9” inches to center field.

5     Conclusion and Discussion
In this manuscript, we examined the effects of sign stealing by the Houston Astros during
the 2017 Major League Baseball season. We first verified that the presence of banging on a
trashcan prior to a pitch was indeed related to the type of pitch being thrown. That is, do
the bangs indicate that an off-speed pitch is likely to be thrown. The results are presented
in Table 1. Next, we showed that the presence of the banging was significantly related
to the probability of an Astros batter swinging, however, we did not control for potential
confounding factors.
    In order to control for additional covariates, we used a series of generalized linear mixed
effects models to control for known factors that potentially affect each of the outcomes
considered here. Specifically, we modeled the probability that a player swings at a pitch,
followed by modeling the probability of contact given a swing, and finally a model looking
at exit velocity given contact. The three main findings of our paper are that the presence
of bangs made it less likely that a player would swing at a pitch, more likely that a player
would make contact with a off-speed pitch given that he swung, and increased the average

                                                20
exit velocity given that a player swung and made contact. Our findings are summarized
below.
1. The odds of swinging at a pitch were about 27.5% lower when a bang was present
prior to the pitch, OR 0.725 (95% CI: (0.618, 0.850).
2. Given a swing, the odds of making contact with a breaking ball were about 80% higher
when a bang was present prior to the pitch, OR 1.805 (95% CI: 1.342, 2.675). Note
that the effect of bangs on fastball was not significant.
3. Given a swing and contact, exit velocity was increased by an average of 2.386 (95%
CI: 0.334, 4.451) miles per hour when a bang was present.
In addition, we found that there was quite a bit of variability in how much the banging
aided players in making contact with the ball given a swing. A particularly notable example
is that George Springer was found to make contact on swings of off-speed pitches at much
higher rates when a bang was present relative to the same pitch with no bang, estimated
OR 3.810 (95% CI: 2.042, 12.864).
In closing, we emphasize that these data and the results of our modeling efforts show that
the effect of the Astros stealing the pitching sign significantly impacted their team’s on-field
performance. And while the effects were shown to differ from player to player, the overall
impact on the game itself is undeniable – the Astros were beneficiaries of their sign-stealing
scheme and went on to win the 2017 World Series. Given the evidence presented here, we
would argue that a cheater may indeed prosper, and occasionally even win a World Series.
21Acknowledgements
The authors gratefully acknowledge Harry Pavlidis and all the members of the Baseball
Prospectus Stats Slack channel, Tony Adams for collecting and disseminating the bangs
data set, Tim P. Levine for the title suggestion, and Scott Sibbel for early comments and
suggestions.
SUPPLEMENTARY MATERIAL
All of the code and data related to this manuscript is publicly available on github at
https://github.com/gjm112/Astros sign stealing
References
Adams, T. (2019).
URL: http://signstealingscandal.com/
Arthur, R. (2019), ‘Moonshot: The Astros offense took a huge leap after they started
stealing signs’.
URL: https://www.baseballprospectus.com/news/article/55450/the-astros-offense-took-a-
huge-leap-after-they-started-stealing-signs/
Axisa, M. (2019), ‘Astros owner Jim Crane says sign-stealing scandal ’didn’t impact the
game’ as team issues public apology’.
URL: https://www.cbssports.com/mlb/news/astros-owner-jim-crane-says-sign -stealing-
scandal-didnt-impact-the-game-as-team-issues-public-apology/
22Baumer, B. & Matthews, G. J. (2017), teamcolors: Color Palettes for Pro Sports Teams. R
package version 0.0.1.
URL: https://CRAN.R-project.org/package=teamcolors
Efron, B. & Tibshirani, R. (1986), ‘Bootstrap methods for standard errors, confidence
intervals, and other measures of statistical accuracy’, Statistical Science 1(1), 54–75.
Fangraphs (2020), ‘Plate discipline’.
URL: https://www.fangraphs.com/players/george-springer/12856/stats#plate-discipline
Judge, J., P. H. & Brooks, D. (2015), ‘Moving beyond WOWY: A mixed approach to
measuring catcher framing’.
URL: https://www.baseballprospectus.com/news/article/25514/moving-beyond-wowy-a-
mixed-approach-to-measuring-catcher-framing/
Lindbergh, B. (2019), ‘Theres no virtue in signaling. but is there any benefit?’.
URL: https://www.theringer.com/mlb/2019/11/22/20977542/astros-sign-stealing-benefit-
wins-advantage
Major League Baseball (2020), ‘About statcast’.
URL: http://m.mlb.com/glossary/statcast
Matthews, G. J. & Elmore, R. (2020).
URL: https://github.com/gjm112/Astros sign stealing
McCulloch, C. E. & Neuhaus, J. M. (2014), ‘Generalized linear mixed models’, Wiley
StatsRef: Statistics Reference Online .
Nathan, A. (2020), ‘The phsyics of baseball’.
URL: http://baseball.physics.illinois.edu/trajectory-calculator-new.html
23Pavlidis, H. & Brooks, D. (2020).
URL: www.pitchinfo.com
Rosenthal, K. & Drellich, E. (2019), ‘The Astros stole signs electronically in 2017 part of a
much broader issue for Major League Baseball’.
URL: https://theathletic.com/1363451/2019/11/12/the-astros-stole-
signs-electronically-in-2017-part-of-a-much-broader-issue-for-major-league-
baseball/?source=spotrac&pc=spotrac40off
Sawchik, T. (2019), ‘If the Astros stole signs, how much did it help them?’.
URL: https://fivethirtyeight.com/features/if-the-astros-stole-signs-how-much-did-it-help-
them/
Stark, J. & Sarris, E. (2020), ‘Does electronic sign stealing work? the Astros numbers are
eye-popping’.
URL: https://theathletic.com/1573075/2020/01/31/does-electronic-sign-stealing-work-
the-astros-numbers-are-eye-popping/
Verducci, T. (2020), ‘The fastball is disappearing. What does it mean for MLB’s future?’.
URL: https://www.si.com/mlb/2020/08/10/justin-verlander-fastball-usage
Walstein, D. (2019), ‘Former Astros pitcher says team electronically stole signs in 2017’.
URL: https://www.nytimes.com/2019/11/12/sports/baseball/astros-cheating.html
24Table 3: Fixed effect estimates for the swing model with the effect of bangs in bold. Note
that the reference pitch count (PC) category is zero balls and zero strikes, denoted PC:0-0.
With the exception of CSP (called-strike probability), all of the terms are indicator variables.
Term Estimate Std. Error Z Statistic p-value
Intercept -2.47 0.10 -25.53 0.00
CSP 2.50 0.07 35.14 0.00
I{Fastball} 0.06 0.06 1.06 0.29
I{P C:0−1 } 1.17 0.09 12.69 0.00
I{P C:0−2 } 1.90 0.13 15.20 0.00
I{P C:1−0 } 0.54 0.09 5.74 0.00
I{P C:1−1 } 1.47 0.10 15.21 0.00
I{P C:1−2 } 2.17 0.10 20.76 0.00
I{P C:2−0 } 0.53 0.14 3.81 0.00
I{P C:2−1 } 1.51 0.12 12.86 0.00
I{P C:2−2 } 2.49 0.11 22.61 0.00
I{P C:3−0 } -1.13 0.28 -4.01 0.00
I{P C:3−1 } 1.34 0.17 8.02 0.00
I{P C:3−2 } 2.46 0.14 18.03 0.00
I{Bang} -0.32 0.08 -3.96 0.00
σb 0.2079
25Table 4: The fixed effect estimates for the contact model with the effect of banging on a
metal can in bold.
Term Estimate Std. Error Z Statistic p-value
Intercept -0.20 0.14 -1.46 0.15
CSP 1.90 0.12 16.37 0.00
I{Fastball} 0.97 0.10 9.61 0.00
I{Bang} 0.59 0.22 2.68 0.01
I{Fastball} *I{Bang} -1.19 0.45 -2.64 0.01
26Table 5: Player-specific odds ratios for the effect of banging on a steel can prior to a pitch
(i.e., stealing the pitch sign) on making contact along with 95% bootstrap intervals for
off-speed pitches.
Name Odds Ratio Confidence Interval
George Springer 3.810 (2.042, 12.864)
Yulieski Gurriel 2.586 (1.485, 7.279)
Jonathan Davis 2.416 (0.869, 12.011)
Jacob Marisnick 2.377 (1.250, 5.765)
Evan Gattis 2.050 (1.017, 4.541)
Josh Reddick 2.010 (1.368, 4.722)
Max Stassi 1.898 (1.326, 3.376)
Carlos Correa 1.864 (1.079, 4.182)
Carlos Beltran 1.848 (1.074, 4.146)
Juan Centeno 1.794 (0.777, 4.035)
Alex Bregman 1.774 (0.891, 3.771)
Derek Fisher 1.751 (0.742, 4.259)
Norichika Aoki 1.750 (1.122, 3.52)
Cameron Maybin 1.737 (0.763, 3.907)
Anthony Kemp 1.680 (1.008, 2.747)
Jose Altuve 1.609 (0.769, 4.547)
Andrew Reed 1.547 (0.275, 2.998)
Brian McCann 1.480 (0.646, 3.772)
Tyler White 1.093 (0.231, 2.335)
Marwin Gonzalez 0.671 (0.262, 1.199)
27Table 6: The fixed-effects estimates for our model on exit velocity. The effects involving
bangs in shown in bold font.
Term Estimate Std. Error Z Statistic p-value
Intercept 76.00 0.94 80.75 0.00
CSP 8.36 0.91 9.18 0.00
I{Fastball} 2.20 0.70 3.15 0.00165
I{Bang} 2.39 1.05 2.27 0.0230
28You can also read