Bayfront Infrastructure Capital II Pte. Ltd - Investor Report

Page created by Bonnie Walsh
 
CONTINUE READING
Bayfront Infrastructure Capital II Pte. Ltd - Investor Report
Bayfront Infrastructure
 Capital II Pte. Ltd.

Collateral Manager: BIM Asset Management Pte. Ltd.

Transaction Administrator: Sanne (Singapore) Pte. Ltd.

Investor Report                                          September 2021
Bayfront Infrastructure Capital II Pte. Ltd - Investor Report
Disclaimer
 All information contained in this document (including statements of opinion and expectation, if any) (the “Information”) is provided as general information to holders (the “Noteholders”) of the
 US$176,900,000 Class A1 Notes due 2044 (“Class A1 Notes”), US$120,000,000 Class A1-SU Notes due 2044 (“Class A1-SU Notes”), US$33,300,000 Class B Notes due 2044 (“Class B
 Notes”), US$22,100,000 Class C Notes due 2044 (“Class C Notes”) and US$8,800,000 Class D Notes due 2044 (“Class D Notes”), issued by Bayfront Infrastructure Capital II Pte. Ltd. (the
 “Issuer”).
 This document is intended for the Noteholders only.
 None of Bayfront Infrastructure Management Pte. Ltd. (in its capacity as the Sponsor), the Issuer, any entity owned by or affiliated to the Sponsor or the Issuer, or any of their respective
 directors, officers, employees, representatives, advisors and agents (all of the foregoing collectively, the “Issuer Group”), BIM Asset Management Pte. Ltd. (in its capacity as the Collateral
 Manager), and Sanne (Singapore) Pte. Ltd. in its capacity as Transaction Administrator, nor any person who controls any of them nor any director, officer, employee, representative, advisor
 nor agent or affiliate of any such person (collectively with the Collateral Manager and the Transaction Administrator, the “Services Providers”) makes any representation or warranty with
 respect to the accuracy or completeness of any information or idea contained in this document or is under any obligation to update this document, correct any inaccuracies, provide the
 Noteholders with access to any additional material or notify the Noteholders of any change in the Information and each of them reserves the right to amend or replace the same at any time
 upon their sole discretion.
 Information contained in this document regarding the Portfolio has been prepared on the basis of information and reports received from the Facility Agents. None of the Information in this
 document regarding the Portfolio has been prepared, reviewed or approved by any of the Facility Agents, or any of their affiliates. None of the Issuer, the Issuer Group, the Services
 Providers, or any other person has received any representation, warranty or other assurance with respect to the quality of such Information, or has otherwise independently verified such
 Information or determined the accuracy or completeness of such Information. Accordingly, the Noteholders should not place undue reliance on such Information.
 Nothing contained in the Information is, or shall be relied upon as a promise or representation as to the past or future performance of the Issuer, the Issuer Group, or the Portfolio. The
 Information may include certain statements, estimates and projections with respect to the anticipated future and financial and operating performance of the Issuer, the Issuer Group, or the
 Portfolio that should not be regarded as an indication of the future performance or results of the Issuer, the Issuer Group or the Portfolio. Certain information and data used in preparing this
 document may have been obtained from various external sources, and have not been or cannot be, verified. Such information and data, any illustrative models or additional evaluation
 material and any tests applied and included in this document may reflect significant assumptions and judgments which may or may not prove to be correct and there can be no assurance
 that any estimates or assessments will be realised.
 This document is not intended to be exhaustive and does not purport to contain all the information that the Noteholders may require. Information shall be not be regarded by the
 Noteholders as a substitute for the exercise of their own judgment and each Noteholder should conduct its own investigation and analyses of Information contained in this document and
 rely on its own examination of the aspects of the transaction. The Noteholders should not construe any of the contents herein as advice relating to business, financial, legal, taxation or
 investment matters and are advised to consult their own business, financial, legal, taxation and other advisors and observe all applicable laws and regulations of any relevant jurisdiction.
 This document is for the purposes of information only and is not and does not constitute or form part of, and is not made in connection with, any offer, invitation or recommendation to sell or
 issue, or any invitation or solicitation of any offer to subscribe for or purchase any securities of any entity by any person including, without limitation, in any jurisdiction in which it is unlawful
 to make such offer, solicitation or sale, and neither this document nor anything contained in it shall form the basis of, or be relied upon in connection with, any contract or investment
 decision.
 In particular, this document does not constitute an offer of securities for sale in the United States or any other jurisdiction where it is unlawful to do so. The Notes described herein have not
 been, and will not be, registered under the Securities Act or the securities laws of any state of the United States or other jurisdiction. The Notes may not be offered or sold or otherwise
 transferred within the United States or to, or for the account or benefit of a U.S. person.
 None of the Issuer, the Issuer Group or the Services Providers shall have any liability for any loss or damage (direct or indirect) suffered by any Noteholder or any other prospective
 purchasers or persons on any account of their use of, any errors therein or reliance on any representations (express or implied) contained in, or any omissions from this document or any
 information transmitted orally, in writing, electronically or in any other form or the distribution and / or possession of any Information in this document to the Noteholder or prospective
 purchasers or persons in the course of its investigation and evaluation of the Issuer, the Portfolio or the Notes.
 This document and the information contained herein is solely for the use of the person it is addressed to and its professional advisors. Release, transmission, distribution or reproduction,
 directly or indirectly, to any other person is prohibited.

                                                                                                                                                                                                            2
Bayfront Infrastructure Capital II Pte. Ltd - Investor Report
C
O
N   1 | Transaction Statistics 2 | Portfolio Information
T
E
N
T
S
                                                           3
1
Transaction Statistics

                         4
Summary Statistics
                                  Balance                   All in          Spread               Expected                       Moody's Rating
Class
                                   (US$)                   Rate (%)          (bps)             Interest (US$)             Original         Current
Class A1                       176,900,000.00              1.41277           125                1,437,034.32              Aaa (sf)          Aaa (sf)
Class A1-SU                    120,000,000.00              1.36277           120                 940,311.30               Aaa (sf)          Aaa (sf)
Class B                        33,300,000.00               2.01277           185                 385,395.14               Aa1 (sf)          Aa1 (sf)
Class C                        22,100,000.00               2.51277           235                 319,310.25                A3 (sf)          A3 (sf)
Class D                         8,800,000.00               3.56277           340                 180,276.16               Baa3 (sf)        Baa3 (sf)
Preference Shares              40,124,154.00                                 N/A
Total                          401,224,154.00                                                   3,262,327.17

  LIBOR (6 months)               0.16277%
  Next Payment Date           11-January-2022

                    Adjusted Collateral Principal Amount                                                  Test Results Summary
                                                                US$           Test Type                            Pass                     Fail
Aggregate Principal Balance of Collateral Obligations                         Overcollaterisation Tests              3                       0
(other than Caa Excess Obligations, Defaulted              389,022,245.38
Obligations or Long Dated Collateral Obligations)                             Interest Coverage Tests               N/A                     N/A

Aggregate Balance of Defaulted Obligations                       -            Total                                  3                       0

Aggregate Balance of Long Dated Obligations                      -

Aggregate Balance of Caa Excess                                  -

Balance in Principal Account and Principal Fixed
                                                           12,201,908.62
Deposit Account

Total:                                                     401,224,154.00
                                                                                                                                                       5
Coverage Tests
Summary Coverage Tests as of 30 Sep 2021
                                                                           Adjusted Collateral
                                                                                                 Principal Amount Outstanding for
                                                                 Current       Principal
 Test                                           Max/                                                Relevant Classes of Notes /     Previous Pass /
                  Test Description                     Trigger   Result     Amount / Interest
Number                                          Min                                              Scheduled Interest Payments on      Result   Fail
                                                                  (A/B)        Coverage
                                                                                                   Relevant Classes of Notes (B)
                                                                              Amount (A)

  1      Class A/B Overcollateralisation Test   Min    116.5%    121.5%      401,224,154.00               330,200,000.00              N/A     Pass

  2      Class C Overcollateralisation Test     Min    109.4%    113.9%      401,224,154.00               352,300,000.00              N/A     Pass

  3      Class D Overcollateralisation Test     Min    107.1%    111.1%      401,224,154.00               361,100,000.00              N/A     Pass

  4      Class A/B Interest Coverage Test       Min    110.0%     N/A             N/A                          N/A                    N/A     N/A

  5      Class C Interest Coverage Test         Min    107.5%     N/A             N/A                          N/A                    N/A     N/A

  6      Class D Interest Coverage Test         Min    105.0%     N/A             N/A                          N/A                    N/A     N/A

                                                                                                                                                     6
Coverage Tests
Overcollateralisation Test History as of 30 Sep 2021
  Class A/B Overcollateralisation Test   Class C Overcollateralisation Test   Class D Overcollateralisation Test

           121.5
                      116.5                       113.9
                                                            109.4                      111.1
                                                                                                 107.1

              30-Sep-21                              30-Sep-21                            30-Sep-21
        Actual (%)    Trigger (%)              Actual (%)   Trigger (%)             Actual (%)   Trigger (%)

                                                                                                                   7
Coverage Tests
Interest Coverage Test History as of 30 Sep 2021
   Class A/B Interest Coverage Test   Class C Interest Coverage Test   Class D Interest Coverage Test

               N/A                                N/A                             N/A

                                                     N/A

                                                                                                        8
Manager’s Update (1 / 2)
As of 30-Sep-2021
 A. Material Credit Updates
 Overall Portfolio Update
 The Weighted Average Rating Factor (“WARF”) of the Portfolio as of 30 September 2021 is 751 based on aggregate
 outstanding commitment amounts, compared to 748 as of inception. The slight increase in WARF is due to the scheduled
 amortisation of the Portfolio and principal drawdowns on some of the loans that have not been fully drawn.
 As of 30 September 2021, the Issuer is in compliance with the Overcollateralisation Tests. The Interest Coverage Tests will only
 be effective from the second Payment Date in July 2022 onwards.

 Portfolio Developments
 To date, all projects within the Portfolio remain operational and performing. Oil prices have continued to improve and are on an
 upward trend. The supportive oil price environment is considered to be credit positive for the Integrated LNG projects as well as
 the countries that are reliant on oil revenues in the Portfolio.
 Approximately 6% of the outstanding par amount of the portfolio relates to projects under construction. As of 30 September
 2021, US$5.5 million from the Undrawn Commitments Account has been utilised to fund drawdowns on these loans.
 There is currently US$178 million in aggregate outstanding commitment amount of sustainable assets, representing a
 sustainable overcollateralisation ratio of 148% for the US$120 million of Class A1-SU Notes.

 B. Country Rating Developments
 The sovereign ratings of Papua New Guinea, India and Saudi Arabia have remained under “negative” outlook by Moody’s as of
 30 September 2021. Moody’s has changed the outlook of India’s sovereign rating from “negative” to “stable” on 5 October 2021.

                                                                                                                                     9
Manager’s Update (2 / 2)
As of 30-Sep-2021
                                       Current         ∆ QoQ          ∆ YTD              LTM
                                                                                                   C. Macro Indicators
Benchmark Rates (%)
                                                                                                   US$ LIBOR rates continued to tighten in 3Q 2021 and are
US$ 3m LIBOR                            0.1301         -10.7%         -45.4%                       close to the lows of the year. The 3m vs. 6m basis closed the
US$ 6m LIBOR                            0.1585          -0.6%         -38.5%                       quarter at 2.8bps, up from 1.4bps on 30 June 2021.
Sovereign CDS (bps)1                                                                               Sovereign CDS for the largest countries of risk in the portfolio
Australia                                16.6           6.3%              22.9%
                                                                                                   have generally widened during the quarter, most significantly
                                                                                                   in Brazil, while India was the sole exception that moved
Brazil                                  203.6          24.4%              43.1%                    tighter.
India                                    81.8         (10.9%)             6.8%
                                                                                                   Brent price continued on an upward trajectory due to COVID-
Indonesia                                82.3          11.3%              19.8%                    19 vaccine rollouts and the reopening of global economies.
Kuwait                                   58.1           9.2%              22.6%                    On the supply side, OPEC has remained disciplined in
                                                                                                   releasing oil back into the market, and public US shale
Qatar                                    45.6          11.0%          (23.6%)
                                                                                                   producers are still operating under a financial policy mantra
Saudi Arabia                             54.6           0.0%          (15.3%)                      that targets free cash flow for debt reduction, returning value
South Korea                              19.8           6.7%          (8.8%)                       to shareholders and limiting rampant production growth. In
                                                                                                   addition, Hurricane Ida has affected US Gulf supply of crude
Abu Dhabi                                44.6          12.6%              15.6%
                                                                                                   oil, which has placed further upward pressure on oil prices.
Dubai                                    94.6           6.2%          (14.7%)
Commodities
Brent Crude ($/bbl)                     78.52           4.5%              51.6%

1   5-year USD CDS. Selection of largest countries of risk in portfolio            Current
                                                                                   Median
Source: Bloomberg, Citi Velocity
                                                                             Min             Max

                                                                                                                                                                      10
Account Balances
 As of 30 Sep 2021
Account Name                          Principal       Interest       Others           Total

Principal Account                    111,848.68          -              -          111,848.68

Principal Fixed Deposit Account     6,990,028.59         -              -         6,990,028.59

Undrawn Commitments Account               -              -         5,522,138.31   5,522,138.31
Undrawn Commitments Fixed Deposit
                                    40,287,963.59        -              -         40,287,963.59
Account
Interest Account                          -              -              -               -

Interest Fixed Deposit Account            -         2,432,672.18        -         2,432,672.18

Payment Account                           -              -              -               -

Preference Shares Payment Account         -              -              -               -

Reserve Account                           -              -          38,919.14      38,919.14

Collection Account                  4,028,440.35    333,987.28      35,859.81     4,398,287.44

Cash in Transit                     1,071,591.00    226,271.85      8,388.35      1,306,251.20

Total                               52,489,872.21   2,992,931.31   5,605,305.61   61,088,109.13

                                                                                                  11
Risk Retention
As of 30 Sep 2021
 Confirmation by the Transaction Administrator:
 ▪ Bayfront Infrastructure Management Pte. Ltd. continues to hold the Preference Shares; and
 ▪ Bayfront Infrastructure Management Pte. Ltd. has not sold, hedged or mitigated its credit risk under or associated with the
   Preference Shares or the underlying portfolio of Collateral Obligations, except to the extent permitted in accordance with the
   Risk Retention Requirements.

                                                                                                                                    12
Payment Frequency Switch
As of 30 Sep 2021
 Confirmation by the Collateral Manager:
 ▪ No Payment Frequency Switch Event has occurred in the current Due Period from 18 June 2021 to 30 December 2021.

                                                                                                                     13
2
Portfolio Information

                        14
Portfolio Details
As of 30 Sep 2021 (1 / 3)
                                                                                                                                                   Outstanding
                                                                                                                            PF         Outstanding             Expected
                             Tranche                                       Location of Location of                                                 Commitment
No. Borrowers                             Participation      Sector                                      Status       Infrastructure   Par Amount              Maturity
                               Type                                          Project      Risk                                                       Amount
                                                                                                                        Obligation       (US$m)                 (Year)
                                                                                                                                                     (US$m)

  Adani Hybrid Energy
  Jaisalmer                                                Renewable
1                           Commercial         No                             India         India      Construction        Yes            7.0         20.0       2025
  One/Two/Three/Four                                        Energy
  Limited
     Australia Pacific LNG
2                           Commercial         No         Integrated LNG    Australia     Australia    Operational         Yes            12.3        12.3       2028
     Processing Pty Limited
                             MIGA PRI
                                                                                                                                          15.1        15.1
     Cambodian               Covered                        Electricity
3                                              No                          Cambodia      Cambodia      Operational        Yes                                    2029
     Transmission Limited    MIGA PRI                     Transmission
                                                                                                                                          0.8          0.8
                             Uncovered
                                                             Metals &
4 Dominique Steel B.V.      Commercial         No                             India         India      Operational         No             4.6          4.6       2025
                                                              Mining
     EDC Burgos Wind                                       Renewable
5                           Commercial        Yes                          Philippines   Philippines   Operational         Yes            1.9          1.9       2029
     Power Corporation                                      Energy
     EDC Burgos Wind                                       Renewable
6                           EKF Covered       Yes                          Philippines   Denmark       Operational         Yes            15.6        15.6       2029
     Power Corporation                                      Energy
     Green Infra Solar                                     Renewable
7                           Commercial         No                             India         India      Operational         Yes            8.7          8.7       2026
     Projects Limited                                       Energy
8 Ichthys LNG Pty Ltd       Commercial         No         Integrated LNG    Australia     Australia    Operational         Yes            20.0        20.0       2028
     Jubail Water and                                      Conventional
9                           Commercial         No                       Saudi Arabia Saudi Arabia Operational              Yes            27.9        27.9       2029
     Power Company                                        Power & Water
     Ras Girtas Power                                      Conventional
10                          Commercial         No                            Qatar         Qatar       Operational         Yes            10.9        10.9       2033
     Company                                              Power & Water

                                                                                                                                                                          15
Portfolio Details
As of 30 Sep 2021 (2 / 3)
                                                                                                                                                  Outstanding
                                                                                                                             PF       Outstanding             Expected
                                Tranche                                     Location of Location of                                               Commitment
No. Borrowers                               Participation      Sector                                     Status       Infrastructure Par Amount              Maturity
                                  Type                                        Project      Risk                                                     Amount
                                                                                                                         Obligation     (US$m)                 (Year)
                                                                                                                                                    (US$m)
     Ruwais Power Company                                    Conventional United Arab     United Arab
11                             Commercial        No                                                     Operational        Yes         15.3         15.3       2031
     PJSC                                                   Power & Water Emirates         Emirates
     SB Energy Six Private                                   Renewable
12                             Commercial        No                            India         India      Construction       Yes          7.2         15.0       2025
     Limited                                                  Energy
                                                             Other Oil &
13 Sepia MV30 B.V.             Commercial        No                           Brazil        Brazil      Construction       Yes          0.0         25.0       2033
                                                                Gas
   Shamal Az-Zour Al-Oula
   for the Building,
   Execution, Operation,
                                                             Conventional
14 Management and              Commercial        No                           Kuwait        Kuwait      Operational        Yes         18.9         18.9       2036
                                                            Power & Water
   Maintenance of the First
   Phase of Az-Zour Power
   Plant K.S.C.
     Summit Gazipur II Power                                 Conventional
15                             Commercial        No                       Bangladesh Bangladesh         Operational        Yes         27.7         27.7       2029
     Ltd                                                    Power & Water
                                                             Other Oil &
16 Tartaruga MV29 B.V.         Commercial        No                           Brazil        Brazil      Operational        Yes         12.8         12.8       2032
                                                                Gas
                                                             Conventional
17 Umm Al Houl Power           Commercial        No                           Qatar         Qatar       Operational        Yes         29.7         29.7       2041
                                                            Power & Water
   Vena Energy Shivalik
                                                             Renewable
18 Wind Power Private          Commercial        No                            India         India      Construction       Yes          4.9          4.9       2030
                                                              Energy
   Limited
     Whitesands Pipelines                                                   United Arab   United Arab
19                             Commercial        No           Midstream                                 Operational        Yes         15.0         15.0       2042
     Limited                                                                 Emirates      Emirates

                                                                                                                                                                         16
Portfolio Details
As of 30 Sep 2021 (3 / 3)
                                                                                                                                          Outstanding
                                                                                                                              Outstanding             Expected
                   Tranche                                      Location                                    PF Infrastructure             Commitment
No.   Borrowers                Participation      Sector                   Location of Risk     Status                        Par Amount              Maturity
                     Type                                       of Project                                     Obligation                   Amount
                                                                                                                                (US$m)                 (Year)
                                                                                                                                            (US$m)
                    MIGA
                                                                Southeast
20    Project A    NHSFO           Yes         Transportation                Suprasovereign   Operational         No           19.0         19.0       2029
                                                                  Asia
                   Covered
21    Project B   Commercial       Yes         Integrated LNG Oceania           Oceania       Operational        Yes           19.0         19.0       2024
                                                 Renewable
22    Project C   Commercial       Yes                        South Asia       South Asia     Operational        Yes            9.3          9.3       2024
                                                   Energy
                    K-sure
                                                                               North Asia                                       8.5          8.5
                   Covered                      Conventional
23    Project D                    Yes                       South Asia                       Operational        Yes                                   2025
                    K-Sure                     Power & Water
                                                                               South Asia                                       0.4          0.4
                  Uncovered
                   Hermes
                                                                                Europe                                          2.5          2.5
                   Covered                      Conventional
24    Project D                    Yes                       South Asia                       Operational        Yes                                   2025
                   Hermes                      Power & Water
                                                                               South Asia                                       0.1          0.1
                  Uncovered
                    KEXIM                       Renewable       Southeast
25    Project E                    Yes                                         North Asia     Operational        Yes           13.3         13.3       2031
                   Covered                       Energy           Asia
26    Project F   Commercial       Yes          Midstream       South Asia     South Asia     Operational        Yes            4.5          4.5       2024
                                                Renewable       Southeast
27    Project G     B Loan         Yes                                       Southeast Asia   Operational        Yes           10.0         10.0       2035
                                                 Energy           Asia
                                                                                                                 Total         343.2        389.0

                                                                                                                                                                 17
Credit Events
As of 30 Sep 2021
                                                                                                      Current Notional Amount
Issuer   Tranche   CCY   Date Assigned as Defaulted Obligation    Market Value (US$)   Market Price
                                                                                                               (US$)

                                                        **NOTHING TO REPORT**

                                                                                                                                18
Principal Payments
Between 18 Jun 2021 and 30 Sep 2021
                                                                                                             Amortisation
Repayment Date                             Borrower                                     Facility       CCY
                                                                                                             Amount (US$)
  21-Jun-21                          Umm Al Houl Power                                Commercial       USD     317,059.25
  24-Jun-21                                 Project D                               K-sure Covered     USD    1,000,000.77
  24-Jun-21                                 Project D                               Hermes Covered     USD     297,617.13
  30-Jun-21                   Cambodian Transmission Limited                       MIGA PRI Covered    USD     535,933.33
  30-Jun-21                                 Project C                                 Commercial       USD     691,580.67
  15-Jul-21                          Dominique Steel B.V.                             Commercial       USD      65,293.27
  15-Jul-21                   Green Infra Solar Projects Limited                      Commercial       USD     384,810.40
  30-Jul-21                          Dominique Steel B.V.                             Commercial       USD      84,217.95
  30-Jul-21                                 Project F                                 Commercial       USD     484,560.99
  13-Aug-21                          Dominique Steel B.V.                             Commercial       USD      91,598.42
                 Shamal Az-Zour Al-Oula for the Building, Execution, Operation,
                  Management and Maintenance of the First Phase of Az-Zour                                    206,292.60
  26-Aug-21                           Power Plant K.S.C.                              Commercial       USD
  31-Aug-21                     Ruwais Power Company PJSC                             Commercial       USD     545,570.25
  07-Sep-21                                 Project A                             MIGA NHSFO Covered   USD    1,266,666.67
  15-Sep-21                       Ras Girtas Power Company                            Commercial       USD      94,704.62
  15-Sep-21                      Summit Gazipur II Power Ltd                          Commercial       USD     535,282.53
  15-Sep-21                          Tartaruga MV29 B.V.                              Commercial       USD     224,621.92
  28-Sep-21                                 Project E                                KEXIM Covered     USD     653,120.12
  30-Sep-21              Australia Pacific LNG Processing Pty Limited                 Commercial       USD     956,389.03
  30-Sep-21           Vena Energy Shivalik Wind Power Private Limited                 Commercial       USD       7,332.23
  30-Sep-21                          Dominique Steel B.V.                             Commercial       USD      27,281.10
  30-Sep-21                   Jubail Water and Power Company                          Commercial       USD    1,064,258.53
  30-Sep-21                                 Project C                                 Commercial       USD    1,841,486.99
  30-Sep-21                   Cambodian Transmission Limited                       MIGA PRI Covered    USD     550,163.11
    Total                                                                                              USD   11,925,841.88

                                                                                                                             19
Principal Drawdowns
Between 18 Jun 2021 and 30 Sep 2021
  Drawdown Date                           Borrower                            Facility    CCY Drawdown Amount (US$)
     25-Jun-21                            Project G                            B Loan     USD      10,000,000.00
     28-Jun-21    Adani Hybrid Energy Jaisalmer One/Two/Three/Four Limited   Commercial   USD        334,827.70
     09-Jul-21    Adani Hybrid Energy Jaisalmer One/Two/Three/Four Limited   Commercial   USD        962,967.03
     30-Jul-21                  SB Energy Six Private Limited                Commercial   USD       1,487,612.61
     10-Aug-21    Adani Hybrid Energy Jaisalmer One/Two/Three/Four Limited   Commercial   USD        856,329.22
     31-Aug-21    Adani Hybrid Energy Jaisalmer One/Two/Three/Four Limited   Commercial   USD        931,868.87
     21-Sep-21    Adani Hybrid Energy Jaisalmer One/Two/Three/Four Limited   Commercial   USD       1,188,148.01
     27-Sep-21        Vena Energy Shivalik Wind Power Private Limited        Commercial   USD        789,467.11
     28-Sep-21    Adani Hybrid Energy Jaisalmer One/Two/Three/Four Limited   Commercial   USD        592,595.10
       Total                                                                              USD      17,143,815.65

                                                                                                                      20
Sustainable Assets
As of 30 Sep 2021
                                                                                                           Outstanding  Outstanding Expected
                                                                                                                                                Sustainability
No. Borrowers                                              Sector                    Location of Project   Par Amount   Commitment   Maturity
                                                                                                                                                 Eligibility %
                                                                                                             (US$m)    Amount (US$m) (Year)
     Adani Hybrid Energy Jaisalmer
 1                                                   Renewable Energy                       India             7.0          20.0        2025         100%
     One/Two/Three/Four Limited
 2   Cambodian Transmission Limited                Electricity Transmission              Cambodia             15.9         15.9        2029         100%
 3   EDC Burgos Wind Power Corporation               Renewable Energy                    Philippines           1.9          1.9        2029         100%
 4   EDC Burgos Wind Power Corporation               Renewable Energy                    Philippines          15.6         15.6        2029         100%
 5   Green Infra Solar Projects Limited              Renewable Energy                       India              8.7          8.7        2026         100%
 6   Jubail Water and Power Company              Conventional Power & Water             Saudi Arabia          27.9         27.9        2029          53%
 7   Ras Girtas Power Company                    Conventional Power & Water                Qatar              10.9         10.9        2033          16%
                                                                                        United Arab
 8 Ruwais Power Company PJSC                     Conventional Power & Water                                   15.3         15.3        2031         44%
                                                                                          Emirates
 9 SB Energy Six Private Limited                     Renewable Energy                       India             7.2          15.0        2025         100%
   Shamal Az-Zour Al-Oula for the Building,
   Execution, Operation, Management and
10                                               Conventional Power & Water                Kuwait             18.9         18.9        2036         50%
   Maintenance of the First Phase of Az-
   Zour Power Plant K.S.C.
11 Umm Al Houl Power                             Conventional Power & Water                Qatar              29.7         29.7        2041         38%
   Vena Energy Shivalik Wind Power
12                                                   Renewable Energy                       India             4.9           4.9        2030         100%
   Private Limited
13 Project A                                            Transportation                 Southeast Asia         19.0          19.0       2029         100%
14 Project C                                          Renewable Energy                    South Asia           9.3           9.3       2024         100%
15 Project E                                          Renewable Energy                 Southeast Asia         13.3          13.3       2031         100%
16 Project G                                          Renewable Energy                 Southeast Asia         10.0          10.0       2035         100%
                                              Total outstanding amount per sustainability eligibility        156.9         177.7

          Sustainable Overcollateralisation                         Outstanding Par Amount ($m)                      Outstanding Commitment Amount ($m)
                 Sustainable Assets                                            156.9                                                177.7
           Outstanding Class A1-SU Notes                                       120.0                                                120.0
               Sustainable O/C Ratio                                          130.7%                                               148.1%

                                                                                                                                                                 21
Credit Estimates
Distribution as of 30 Sep 2021
▪   The following provides a breakdown of the Portfolio in terms of Moody’s credit estimates.
▪   The Portfolio’s weighted average rating factor is 751 based on outstanding commitment amounts and 661 based on
    outstanding par amounts as of 30 Sep 2021.

       Breakdown by Outstanding Commitment
                                                                                      Breakdown by Percentage (%)
                 Amount (US$m)

                                                                                                B1-B3
                                                                                                0.2%
                                           162.1
                                                                                                              Aa1-Aa3
                                                                                                               16.8%

                                                                            Ba1-Ba3
                                                                             41.7%
                  83.3
                               77.3
     65.5                                                                                                               A1-A3
                                                                                                                        21.4%

                                                         0.8

    Aa1-Aa3       A1-A3      Baa1-Baa3    Ba1-Ba3       B1-B3                                     Baa1-Baa3
                                                                                                    19.9%

                                                                                                                                22
Country of Project
Distribution as of 30 Sep 2021                                                                    Breakdown by Value (%)
▪       The projects are located across 13 countries in Asia Pacific, Middle                              Cambodia,    Indonesia,
                                                                                          Philippines,
        East and South America.                                                              4.5%           4.1%          3.4%

                                                                                           Kuwait, 4.9%                              India, 17.2%
                                         % of Total
                           Aggregate                                                     Papua New
                                         Aggregate                                      Guinea, 4.9%
                          Outstanding
Country where the                       Outstanding    Number of                                                                          Qatar, 10.4%
                          Commitment                                % of Loans
project is located                      Commitment       Loans
                            Amount                                               Saudi Arabia, 7.2%
                                         Amount in
                            (US$m)
                                          Portfolio
                                                                                     Vietnam, 7.5%
India                         67.0         17.2%           7           25.9%                                                              Bangladesh, 10.1%

                                                                                                                           Brazil, 9.7%
Qatar                         40.6         10.4%           2           7.4%        United Arab Emirates,      Australia,
                                                                                           7.8%                8.3%
Bangladesh                    39.4         10.1%           3           11.1%
Brazil                        37.8         9.7%            2           7.4%
                                                                                       Breakdown by Number of Loans (%)
Australia                     32.3         8.3%            2           7.4%
United Arab Emirates          30.3         7.8%            2           7.4%
                                                                                                         Cambodia,    Indonesia,
                                                                                         Philippines,
                                                                                                           3.7%          3.7%
Vietnam                       29.0         7.5%            2           7.4%                 7.4%
                                                                                        Kuwait, 3.7%
Saudi Arabia                  27.9         7.2%            1           3.7%                                                          India, 25.9%
                                                                                    Papua New
Papua New Guinea              19.0         4.9%            1           3.7%        Guinea, 3.7%

Kuwait                        18.9         4.9%            1           3.7%      Saudi Arabia, 3.7%
                                                                                            Vietnam,                                Qatar, 7.4%
Philippines                   17.5         4.5%            2           7.4%                   7.4%
Cambodia                      15.9         4.1%            1           3.7%          United Arab Emirates,                   Bangladesh,
                                                                                             7.4%                              11.1%
Indonesia                     13.3         3.4%            1           3.7%                          Australia,
                                                                                                       7.4%     Brazil, 7.4%
Total                        389.0        100.0%          27          100.0%
                                                                                                                                                              23
Country of Risk
Distribution as of 30 Sep 2021
▪       The projects are diversified across 16 countries and suprasovereign
        organisations based on the ultimate source of payment risk.

                                     Aggregate
Region/Country based on
                                    Outstanding
                                                       % of Total Aggregate                  Breakdown by Value (%)
ultimate source of payment risk                      Outstanding Commitment
                                    Commitment
located                                                Amount in Portfolio
                                   Amount (US$m)                                         Vietnam,        Germany, Philippines,
                                                                                           2.6%            0.7%      0.5%
India                                   67.0                 17.2%                           Denmark,
                                                                                               4.0%
Qatar                                   40.6                 10.4%              Cambodia,
                                                                                  4.1%                                           India, 17.2%
Brazil                                  37.8                  9.7%                      Kuwait, 4.9%

Australia                               32.3                  8.3%            Suprasovereign, 4.9%
United Arab Emirates                    30.3                  7.8%                    Papua New                                         Qatar, 10.4%
                                                                                     Guinea, 4.9%
Bangladesh                              28.3                  7.3%
                                                                                      South Korea,
Saudi Arabia                            27.9                  7.2%                       5.6%                                        Brazil, 9.7%

South Korea                             21.9                  5.6%                       Saudi Arabia,
                                                                                            7.2%                           Australia,
Papua New Guinea                        19.0                  4.9%                           Bangladesh,     United Arab     8.3%
                                                                                                7.3%          Emirates,
Suprasovereign                          19.0                  4.9%                                              7.8%
Kuwait                                  18.9                  4.9%
Cambodia                                15.9                  4.1%
Denmark                                 15.6                  4.0%
Vietnam                                 10.0                  2.6%
Germany                                 2.5                   0.7%
Philippines                             1.9                   0.5%
Total                                  389.0                 100.0%                                                                                    24
Industry Sectors
Distribution as of 30 Sep 2021                                                                    Breakdown by Value (%)
▪   The projects are diversified across 8 industry sub-sectors across the
                                                                                                       Electricity   Metals &
    infrastructure ambit.                                                      Transportation,       Transmission,   Mining,
                                                                                   4.9%                  4.1%         1.2%
                                            % of Total                               Midstream,
                              Aggregate                                                 5.0%
                                            Aggregate                                                                               Conventional
                             Outstanding                 Number                        Other Oil &
                                           Outstanding                                                                                Power &
Industry Sector              Commitment                     of    % of Loans           Gas, 9.7%                                    Water, 36.5%
                                           Commitment
                               Amount                     Loans
                                            Amount in
                               (US$m)
                                             Portfolio                                 Integrated
                                                                                      LNG, 13.2%
Conventional Power & Water      142.1        36.5%         8        29.6%
                                                                                                                                Renewable
Renewable Energy                98.8         25.4%         9        33.3%                                                        Energy,
                                                                                                                                  25.4%
Integrated LNG                  51.4         13.2%         3        11.1%

Other Oil & Gas                 37.8          9.7%         2        7.4%            Breakdown by Number of Loans (%)
Midstream                       19.5          5.0%         2        7.4%
                                                                               Electricity Transmission, 3.7%            Metals &
Transportation                  19.0          4.9%         1        3.7%                                                 Mining,
                                                                                  Transportation, 3.7%                    3.7%
Electricity Transmission        15.9          4.1%         1        3.7%
                                                                                 Midstream, 7.4%                                    Conventional
                                                                                                                                      Power &
Metals & Mining                  4.6          1.2%         1        3.7%       Other Oil & Gas,                                     Water, 29.6%
                                                                                    7.4%
Total                           389.0        100.0%        27      100.0%
                                                                                       Integrated
                                                                                      LNG, 11.1%

                                                                                                                                 Renewable
                                                                                                                                  Energy,
                                                                                                                                   33.3%

                                                                                                                                                   25
Credit Enhancements
Distribution as of 30 Sep 2021
▪   The following provides a breakdown of proportion of projects that are supported by export credit agencies (“ECAs”) and
    multilateral financial institutions (“MFIs”) through various forms of credit enhancements such as guarantees and insurances.

                                                   Direct Assignment                                   Sub-participation
                                                                        % of Total                                          % of Total
                                                      Aggregate         Aggregate                        Aggregate          Aggregate
                                                     Outstanding       Outstanding                      Outstanding        Outstanding
Tranche Type                     Number of Loans                                     Number of Loans
                                                     Commitment        Commitment                       Commitment         Commitment
                                                    Amount (US$m)       Amount in                      Amount (US$m)        Amount in
                                                                         Portfolio                                           Portfolio

Loans that are covered by MFIs          1                15.9             4.1%              2                29.0             7.5%

Loans that are covered by ECAs          0                 0.0             0.0%              4                40.6            10.4%

Other Loans                            16                260.0           66.8%              4                43.5            11.2%

Total                                  17                275.9           70.9%             10               113.1            29.1%
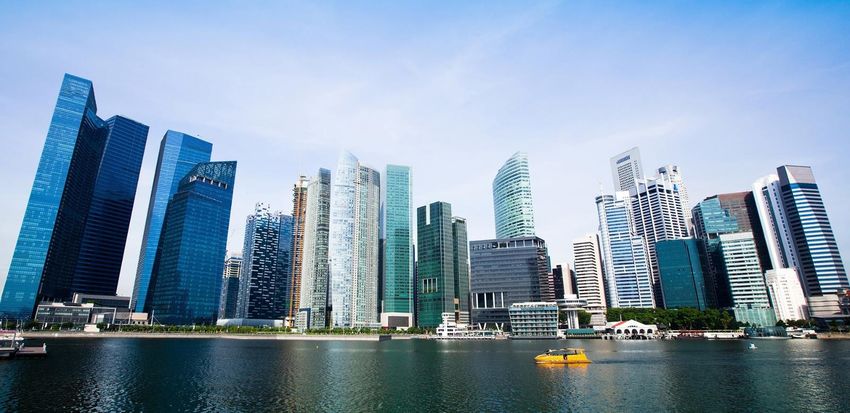
                                                                                                                                         26
Others
Distribution as of 30 Sep 2021
▪   Four out of the 25 projects in the Portfolio are currently under construction
▪   Three out of the 27 loans in the Portfolio are exposed to commodity pricing risk, while the remaining loans involve projects
    that are underpinned by robust availability-based or fixed price off-take or charter contracts.

                             Project Status                                         Exposure to Commodity Price Volatility

By Outstanding Commitment Amount                                        By Outstanding Commitment Amount

                                        Construction,                                                           Yes
                                           16.7%                                                               13.2%

              Operational,
                                                                                                No
                83.3%
                                                                                               86.8%

                                                                                                                                   27
Contact Us
1 Raffles Quay, #23-01, North Tower,
Singapore 048583
+65 6229 2900
enquiry@bayfront.sg                    https://www.bayfront.sg/
                                                                  28
You can also read