BETTERING HUMAN LIVES - 2020 ESG REPORT - Liberty Oilfield Services
←
→
Page content transcription
If your browser does not render page correctly, please read the page content below
BETTERING
HUMAN LIVES
2020 ESG REPORT
ENERGY
MATTERS!
Liberty’s mission is to BETTER HUMAN LIVES.

Liberty is a TECHNOLOGY PIONEER of the shale revolution and
has driven enormous improvements in both human well-being and
environmental quality.

Liberty management and board are ALIGNED with our
owners and our communities.

Liberty partners with our customers to deliver LOW-IMPACT,
LOW-COST, RELIABLE ENERGY (and we’re proud of it!).

Liberty sees THREE GLOBAL ENERGY CHALLENGES:
   • Energy poverty
   • Reliable, affordable, clean energy
   • Climate change

4
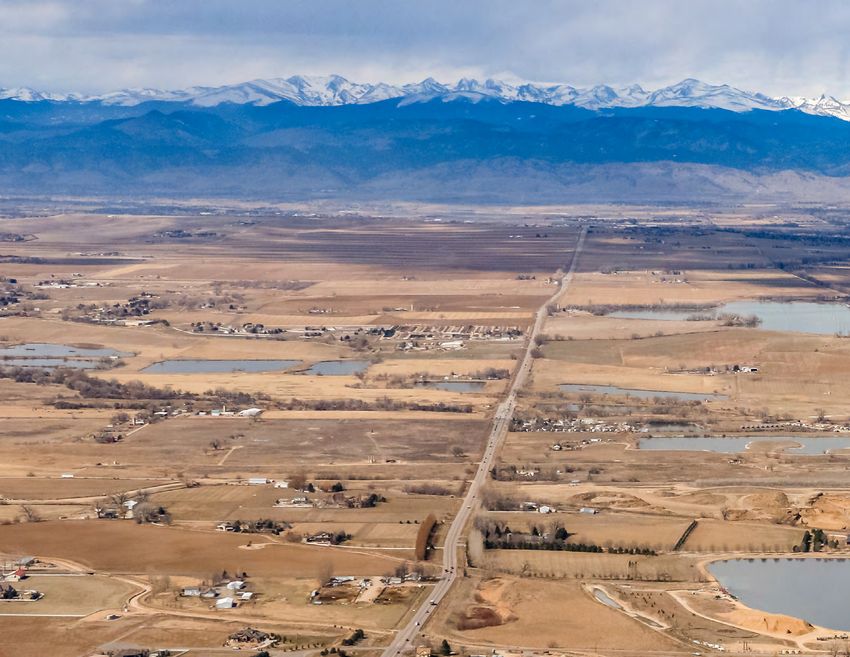
TABLE OF CONTENTS

6.    INTRODUCTION                                    PART 2: LIBERTY TODAY: BETTERING HUMAN LIVES AND
7.    A MESSAGE FROM CHRIS WRIGHT, CHAIRMAN AND CEO   REDUCING ENVIRONMENTAL IMPACTS
10.   COMMITMENT TO ESG
12.   LEGACY OF SUSTAINABILITY                        46.  THE SHALE REVOLUTION
                                                      48.  IMPROVING ENVIRONMENTAL PERFORMANCE
PART 1: LIBERTY’S BUSINESS IN GLOBAL CONTEXT:         50.		      DIGITAL TECHNOLOGY
LOW-COST ENERGY AS AN AGENT OF HUMAN WELL-BEING       52.		      FRAC ENGINES
                                                      54.		 NOISE/DUST/SAND
16.   ENERGY                                          56.		      FRAC FLUID CHEMISTRY
19.   ENERGY POVERTY                                  58.		 WATER
30.   CLIMATE CHANGE                                  60.		      ECOLOGICAL IMPACT
38.   CLIMATE CHANGE ECONOMICS                        62.		      COLORADO FRONT RANGE: CASE STUDY
42.   EMISSIONS AND AIR QUALITY: THE BIG PICTURE      64.  SAFETY
                                                      66.  COVID-19 RESPONSE
                                                      67.  A CULTURE OF EXCELLENCE
                                                      72.  REVITALIZING SMALL TOWN AMERICA
                                                      74.  COMMUNITY ENGAGEMENT
                                                      76.  CORPORATE GOVERNANCE
                                                      80.  BUSINESS AND REGULATORY AFFAIRS
                                                      81.  KEY METRICS AND DISCLOSURES - SASB

                                                                                                         5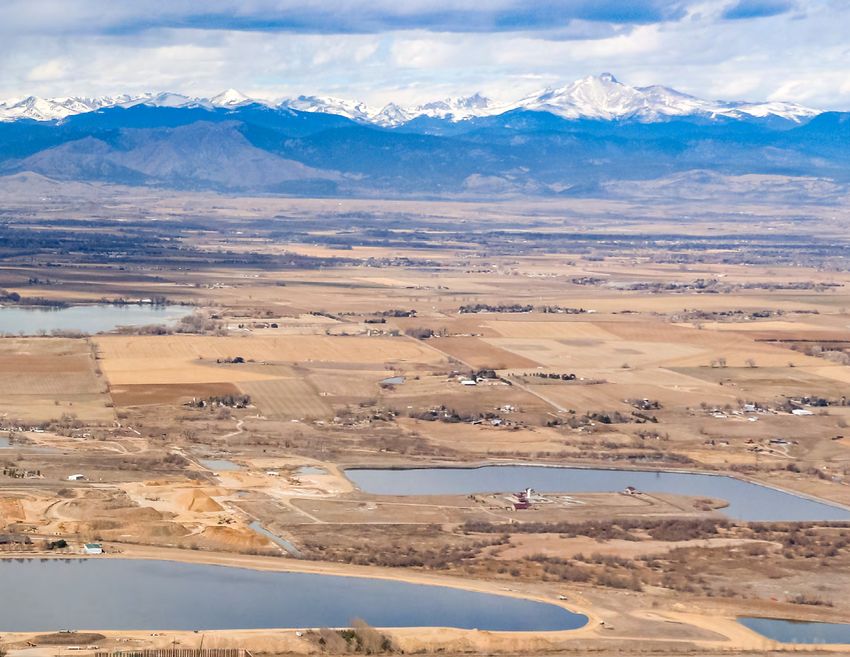
INTRODUCTION

IT IS SIMPLY NOT POSSIBLE TO DISCUSS THE ENVIRONMENTAL                            Unfortunately, many people still lack access to life-enhancing modern
AND SOCIAL IMPACTS OF OUR INDUSTRY WITHOUT CONSIDERING                            energy, which presents the most pressing global energy challenge.
                                                                                  Our energy-rich lifestyles have both environmental downsides such
THE ENVIRONMENTAL AND HUMAN IMPACTS OF THE ABSENCE OF                             as pollutants and climate change, and upsides like forest preservation,
OUR INDUSTRY.                                                                     reduced need for cropland, and cleaner air.

                                                                                  Part 2 covers the actions Liberty is taking to maximize the benefits of
As with all complex issues, Liberty strives to learn first, define a thoughtful   our services and to lead the industry into a new era of technology and
plan, and then act. Our inaugural Environmental, Social, and Governance           stewardship. At Liberty, we view ESG principles as foundational to our
(ESG) report is designed to share our journey with you. We go far                 business strategy, expanding beyond our four walls to ensure that the
beyond the narrow focus on our company to look at the bigger picture of           work we do benefits our families, our communities, and the world. We
the world in which we live and the industry in which we operate. Would            passionately work to better the process of bringing hydrocarbons to the
the world be better off without fossil fuels? Emphatically “no” is our            surface in a clean, safe, and efficient fashion. It is important to not lose
answer. Because the issues around energy, poverty, and the environment            sight of the rich history of progress enabled by the oil and gas industry,
are so important – and so often misunderstood – we will explore and               and this broader context motivates our team every day.
explain them in depth.
                                                                                  Liberty’s ESG report offers information on critical issues that are
Part 1 covers in greater depth the larger issues that form the Energy/            important to our business today. Information is provided by Liberty’s
Environment/Poverty nexus. This begins with why worldwide clean                   subject matter experts, approved by our leadership team, and reviewed
energy access matters. Since the oil and gas industry began in the                by the Liberty board of directors. Data in the report covers our 2020
second half of the 19th century, global life expectancy has doubled,              calendar year unless otherwise indicated. The report is prepared in
extreme poverty has plummeted, and human liberty has grown                        accordance with Sustainability Accounting Standards Board (SASB)
tremendously. The timing here is no coincidence. This progress in the             standards and uses several other ESG standards to inform our discussion.
human condition was enabled by the surge in plentiful, affordable energy          In developing our report, we have identified opportunities for expanded
from oil, gas, and coal.                                                          reporting in subsequent years as we continue to drive improvement.
 6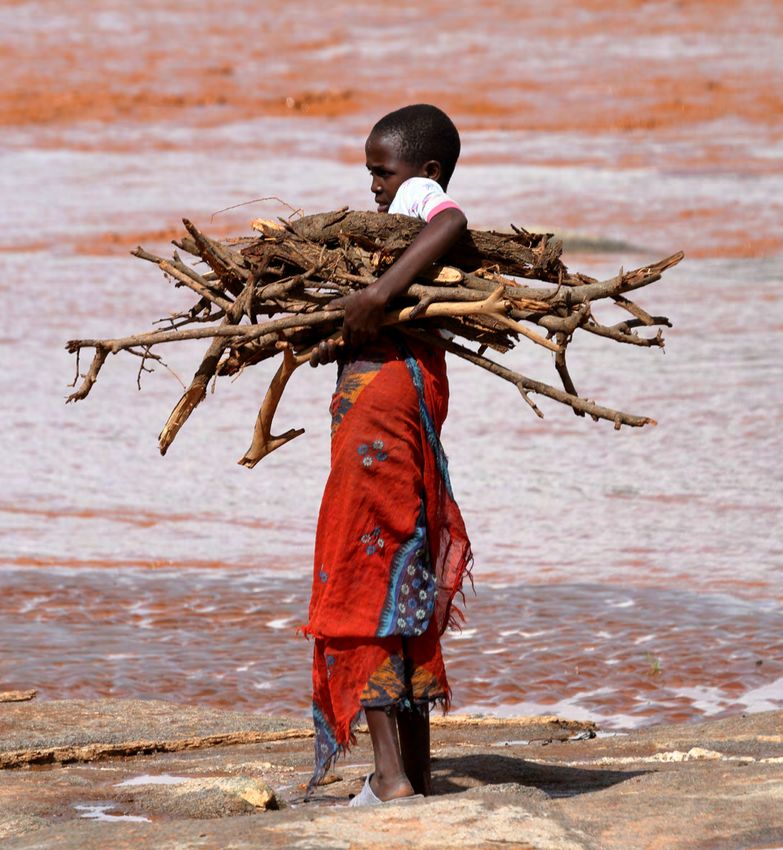
A MESSAGE FROM CHRIS WRIGHT,
CHAIRMAN AND CEO
LIBERTY’S MISSION IS TO BETTER HUMAN LIVES. Part 2 of this report covers Liberty’s efforts to better human lives,
strengthen our communities, and reduce negative environmental
The Liberty family, from our field crews to our board of directors, impacts from North American oil and natural gas production. Our
forms a passionate, committed, and engaged team. We strive to efforts on the social front began with the inception of our company.
enhance our company, families, communities, and the world. Liberty We chose our name, Liberty, because we believe in human liberty:
is committed to meeting the challenges of our time. By investing in everyone should have the freedom and opportunity to pursue their
our people and technology we are helping our customers efficiently dreams. This ethos pervades our diverse workforce and hiring policies
produce cleaner oil and gas resources. It is simply not possible to that focus on where people are headed with their lives far more than
discuss the environmental and social impacts of our industry without where they came from. Liberty provides a home to many of the
considering the environmental and human impacts of the absence of brave service men and women who have served our country. We also
our industry. employ dozens of formerly incarcerated people who had a tough start
in life, but are now building meaningful careers.
Today there is discontent among the public in wealthy nations with
oil and gas, and even a growing belief that our industry soon will COVID-19 dealt a body blow to Liberty. Our top priority was the
be, and should be, gone. This report explains why the near-term health and safety of our team and their families. We were highly
disappearance of our industry is both highly unlikely and undesirable. effective in suppressing COVID-19 transmission at Liberty even as
Liberty takes great pride in our work, and we strive to explain why in we worked 24/7 to supply reliable energy and raw materials critical
this report. to fighting the global pandemic. We were forced to make our first-
ever layoffs in company history. We also had to make significant
The big-picture issues are tackled in depth in Part 1 of this report, compensation cuts and, in Liberty fashion, the compensation cuts
which gives data-packed summary overviews on energy, energy
poverty, climate change, and climate economics. At least a basic HOW MUCH RICHER WOULD THE
100
understanding of these issues is critical to engaging with today’s three WORLD HAVE BEEN HAD WE SOLVED
Cost of problem, % global GDP
global energy challenges: 1) energy poverty, 2) affordable, reliable, C DIFFERENT ISSUES, 1900-2050. COST
clean energy, and 3) climate change. Tra onfli
80
Nut de
cts OF CLIMATE CHANGE WITH OPTIMAL
ritio
n POLICY ADDED FOR REFERENCE.
This report explains why the longer, healthier, opportunity-rich lives
60 Heal
in the modern world are simply not possible without oil and gas. th
Borrowing Thomas Hobbes’ words, life for most everyone in history
was “nasty, brutish, and short” when liberty was scarce and energy 40
was supplied only by human toil and draught animals. Liberty’s Gender
inequali
ty
mission is to bring modern energy to the fully one-third of humanity Educatio
20 n
that lacks that access today and, therefore, must live far more
dangerous and constrained lives than we enjoy. Air pollution
Climate
0 change
~1%
40
20
40
60
0
0
0
20
8
0
0
20
19
20
19
19
19
19
20
Figure 1.1 Source: Bjorn Lomborg 7
https://www.sciencedirect.com/science/article/pii/S0040162520304157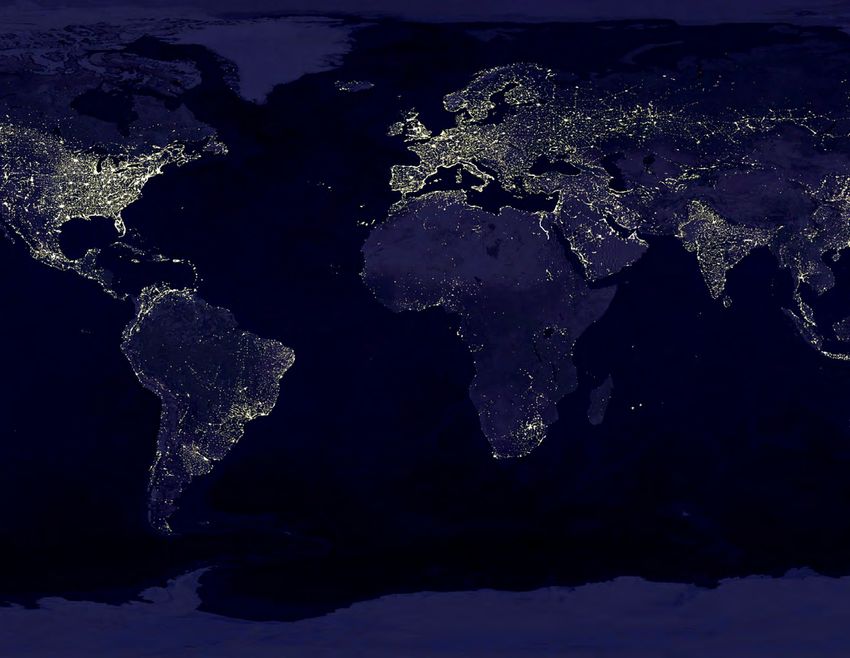
were made first and deepest at the executive level. Now as the WHO estimates there are several million additional deaths from outdoor
country has entered a recovery phase, most compensation cuts for air pollution, predominantly from the same source: particulate matter,
the Liberty team are restored and we are hiring again. April 2020 was or PM2.5, which is one of the world’s deadliest pollutants. Transitioning
the toughest professional time of my career. I am proud and humbled from traditional biomass fuels to modern fuels and using appropriate
to be part of a team that faced adversity with courage, perseverance, industrial pollution controls are the keys to reducing outdoor PM2.5
and steadfast commitment to Liberty’s mission. concentrations. PM2.5, malnutrition, preventable disease, and lack of
access to drinking water and basic education collectively account for
Liberty provides over 100 K-12 scholarships to low-income kids over 10 million premature deaths per year. Bringing affordable, reliable
through ACE (Alliance for Choice in Education), and we recently energy to the world’s poor is essential to eradicating these scourges.
launched a Liberty Scholars program at Montana Tech to enable lower Even in wealthy nations, rising energy prices pose significant economic
income students to get a college engineering education. We have and health threats to lower income people.
numerous other efforts targeting schools and kid programs, poverty
abatement programs, low-income housing (Habitat for Humanity), We see three global energy challenges today: energy poverty;
criminal justice reform and job opportunities for those who had a maintaining reliable, affordable, and clean energy; and climate
disadvantaged start in life. Our efforts are all targeted at bettering change. There is no reason that we can’t master all these challenges.
human lives and growing individual liberty and opportunity. But doing so will require honest assessment, rational evaluation of
tradeoffs, continued technology advancement, and the will to get it
Liberty is committed to honest, sound, aligned governance that assures right. Unfortunately, the first and most urgent issue, energy poverty,
management and our board of directors are responsible stewards of afflicts poor countries and lower income residents of the wealthier
our owners’ capital. All the Liberty founders are still here fulfilling our countries, hence it garners tragically little attention. This is wrong.
dream to build a truly special company. We have always recognized that
incentives drive human behavior and that principle guides our corporate The second global energy challenge is maintaining reliable, affordable
governance. We align our financial incentives with our shareholders, and clean energy. This issue is starting to garner more attention as
and our social and operational practices with the communities in which power grids become more expensive and less reliable, amply illustrated
we operate. Businesses are major players in setting the tone, culture, by the recent serious blackouts in California, Texas, and the U.K.
and character of our society. We behave in ways that our children and
neighbors can be proud of for years to come. The third global energy challenge, climate change, has become
so politicized and emotionally charged that rational, fact-based
This report is long, but necessarily so. It is critical to put Liberty’s decision-making is becoming scarce. Urgent desires to visibly take
efforts and our whole industry in proper context. We start in Part 1 politically appealing action have often driven up energy prices,
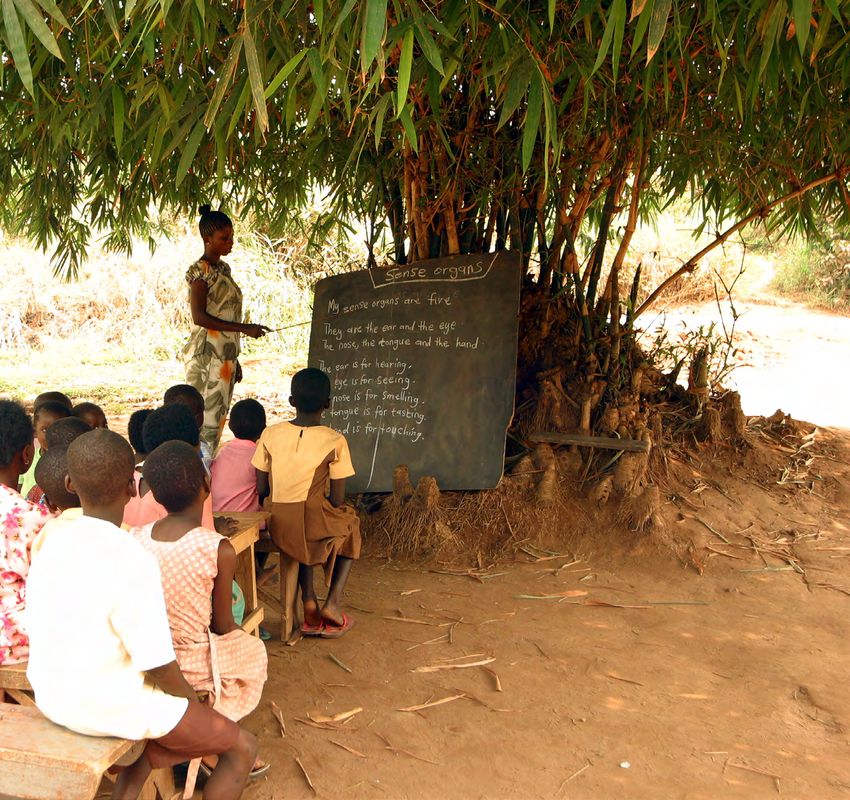
by showing how low-cost, reliable energy is an agent of human well- made power grids less reliable, and grown energy poverty without
being. The essential role of energy access lifts people out of poverty making meaningful progress on climate change. Climate change is
and reduces the health and environmental stresses that accompany a long-term challenge requiring broad-based actions with significant
the use of traditional biomass fuels like wood, dung, and agricultural technology and system advancements required. Liberty is excited to
waste. Regrettably, traditional fuels still dominate for roughly one- play a growing role here.
third of the world’s people. The World Health Organization (WHO)
estimates that over 2 million premature deaths each year arise from Decisions at Liberty are driven by data, facts, customer preferences,
indoor use of traditional biomass fuels, which generate copious and our commitment to do the right thing. Our efforts on these three
particulate matter during combustion. This staggering loss of human big issues that make up the energy/environment/poverty nexus will
potential can and must be eradicated. be no different. Our efforts are both internal to Liberty’s operations
and in partnership with our customers.
8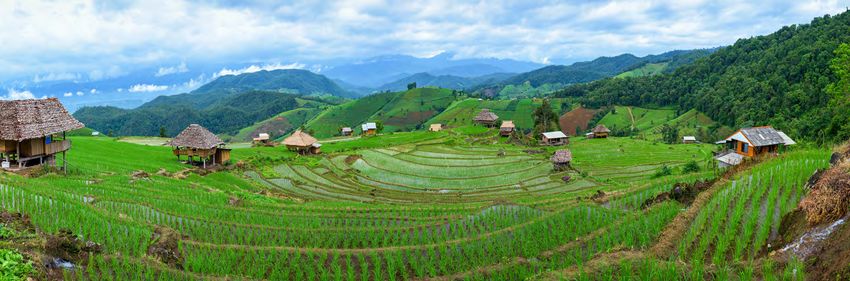
To put the global energy challenges in context, Figure 1.1 shows an
economic analysis of the staggering lost economic output resulting
from the major afflictions of the world since 1900. Although we have
seen over a century of progress, air pollution, disease, malnutrition,
etc., still dwarf climate change in urgency. Solving these challenges
is intimately tied to raising the poorest third of the world population
out of energy poverty. For context, Figure 1.1 overlays, on a like-for-
like basis, projections of climate change economic impacts from Nobel
Prize winning climate economist, William Nordhaus.

Liberty works in the shale revolution, made possible by innovations
in hydraulic fracturing and horizontal drilling. The shale revolution
is a major driver of progress for all three global energy challenges.
Surging U.S. oil and gas production has reset global oil and gas
prices lower, lifting the economic fortunes of everyone, most of all
the world’s poor. 2020 marked the second straight year that the U.S.
produced more total energy than consumed. The last time the U.S.
produced more energy than consumed was in the 1950s.

Surging U.S. exports of liquid petroleum gas (LPG) bring this critical
fuel to improve the lives of families in dire energy poverty still relying
on dirty, life-shortening traditional biomass fuels. On the climate
front, surging U.S. natural gas production and plunging natural gas
prices brought by the shale revolution have been the largest factors
driving down U.S. per capita greenhouse gas (GHG) emissions to
their lowest levels in my lifetime! Lower global natural gas prices
and surging exports of liquified natural gas (LNG) are globalizing the
incremental displacement of coal with cleaner electricity sources like
natural gas, solar, and wind.

The broader social, community, governance, environmental, and
human flourishing aspects of energy are topics near and dear to our
hearts and were significant drivers of why we founded Liberty ten
years ago.

                          TO BETTERING HUMAN LIVES,

                          CHRIS WRIGHT
                          CHAIRMAN AND CEO
                          LIBERTY OILFIELD SERVICES                          9
COMMITMENT TO ESG
Liberty has been a force for disruptive change in the service             As we move forward, Liberty will strive to serve our customers
industry since our founding a decade ago. We saw the power of             exceptionally, provide transparency for our stakeholders, and
putting people first, developing a service business from the ground       strengthen our communities through best-in-class governance and
up by fostering an engaging environment for our employees, and            risk management and controls. We take our responsibility seriously
delivering value to our customers and communities. The most               and will continue to hold ourselves accountable with vigorous
crucial intangible assets are culture and a strong reputation, curated    ethical standards.
through investment in our employees, innovation in an ever-changing
environment, and a robust governance system. Liberty has grown
into one of the largest North American completions companies by

                                                                                    652                             26%
sustaining these competitive advantages through cycles.

In 2020, we acquired Schlumberger’s North American completions                   EMPLOYEE OWNERS               PERCENTAGE OF TIER IV
business, advancing our business with complementary technologies,
people, assets, geographic diversification, and vertical integration.
                                                                                (34% OF EMPLOYEES)               OFF-ROAD ENGINES
The combination of talent, knowledge, and enhanced scale lays the
groundwork for continued improvement to our processes to improve
our efficiency and reduce our negative impacts on the environment.                  2020 TOTAL RECORDABLE INCIDENT RATE (TRIR)
We have strengthened our ability to advance our customers’ ESG
efforts, while providing expanded opportunities for our employees                                                   0.80
and communities.                                                                          0.66
Liberty is proud to deliver affordable, dependable energy that is vital
to human progress. We constantly strive to advance sustainable
solutions for our clients and within our operations. The market’s focus
on ESG aligns with the principles that have been part of our DNA since                   Liberty TRIR             Industry Average TRIR
day one. Liberty’s focus on digital technology has been critical to the
immense improvements in shale-well productivity and efficiency over
the last decade. Our team was first to develop the Quiet Fleet®, an
incredible advancement in reducing environmental impact through
the elimination of noise pollution in nearby communities. We created                 121                            47%
a logistics solution through containerized sand that reduces dust and           STUDENTS RECEIVED               WOMEN AT CORPORATE
noise in our operations and truck traffic in the community. Today, our          SCHOLARSHIPS FROM                 HEADQUARTERS
team’s ingenuity and careful evaluation of emissions and efficiency
over the past few years have now led to continuous improvements in
                                                                                  LIBERTY IN 2020
frac engine technology, leading to our soon-to-be-deployed electric
frac fleet, digiFrac, that we expect to drive emissions at least 20%
below the best technologies on the market.                                          HIGHLY EFFECTIVE
                                                                                    COVID RESPONSE
 10
11
LEGACY OF SUSTAINABILITY
FROM DAY ONE

2011                                                                                                 SEPTEMBER 2014
                                                                                                     Liberty team grows to 500
Assembled industry-first comprehensive
database of Bakken petrophysical and                                       2014
completions well data                                        CONTAINERIZED SAND
                                                             Reduces dust, noise, and
                                                                        truck traffic

                                                                                                                                            JUNE 2016
             JANUARY 2012
                                                                                                                           Liberty acquires Sanjel assets
             Inaugural frac in
             North Dakota
                                                                                                                            Liberty starts in West Texas

2012

                    2012
       SLICKWATER DESIGN
         Increasing Bakken oil
          productivity by 50%
                                                     2013                                                     2015
Rolled out FIRST iPads to E&P                   DUAL FUEL                                                    SPIRIT
  customers, a key enabler of         Liberty’s first dual fuel                         Fluid system places proppant
         customer integration       fleet reduces emissions                                       cheaper and cleaner

                                                  MAY 2013                                         FEBRUARY 2015
                                  Liberty starts in Colorado                               Liberty starts in Wyoming

12
12
MARCH 2017 OCTOBER 2018 DECEMBER 2020
Liberty team grows to 1,500 DIGIFRAC Closes OneStim® acquisition
Starts development
program for fully electric Liberty adds Wireline and
JANUARY 2017 low emissions fleet Freedom Proppant businesses
IVF and adoption assistance added as
employee benefit
2020
JULY 2017 Liberty starts in Canada
Liberty starts in
South Texas Liberty becomes the 2nd
largest frac service provider
JANUARY 2019
Adopts Ban the Box initiative
LBRT IPO 2021
NOVEMBER 2016 NOVEMBER 2017 2020
Liberty team Liberty team grows NEXT GEN FRAC FLEET WHITE
grows to 1,000 to 2,000 PAPER
ESG profile quantified for
Next Gen fleets
2016
QUIET FLEET ®
JUNE 2018
Liberty introduces
First Liberty Women’s Summit
2020
Quiet Fleet technology Deploys Tier IV DGB Fleets
2018
Tier IV DGB Caterpillar Field
Test Partnership
1314 14
PART 1:
LIBERTY’S BUSINESS IN GLOBAL CONTEXT: LOW-COST
ENERGY AS AN AGENT OF HUMAN WELL-BEING

 ENERGY
 ENERGY POVERTY
 CLIMATE CHANGE
 CLIMATE CHANGE ECONOMICS
 EMISSIONS AND AIR QUALITY: THE BIG PICTURE

                                                 15
ENERGY
THE STORY OF ENERGY IS QUITE SIMPLE. IT IS THE STORY OF FREEDOM. The second human energy transition was the invention of agriculture
FREEDOM FROM BACK-BREAKING TOIL. WHAT DOES A HUMAN SPIRIT roughly ten thousand years ago. This led to a large increase in the
human ability to produce energy from the land. The soaring production
FREED FROM TOIL CREATE? OUR WORLD. THE MODERN WORLD. of energy (food) from agriculture led to a substantial rise in human
population and the first cities, written language, complex culture,
CHRIS WRIGHT, LIBERTY CEO and many other changes in human communities. Unfortunately, the
2016 COMMENCEMENT ADDRESS historical evidence doesn’t show improvement in the lives of the
average person. Life expectancy remained around 30 years before and
after the arrival of agriculture. The second energy revolution changed
Energy is the essential ingredient that makes everything happen. the world markedly, but it did not improve the lot in life of the
Everything. The dramatic complexity of living organisms today was average human.
only made possible by an energy revolution billions of years ago:
mitochondria as the energy source in all complex life. Mitochondria The third energy transition, the arrival of fossil fuels, completely
organelles have their own DNA but are ubiquitous within nearly all changed humanity. This energy transition led to a doubling of human
complex plants and animals (eukaryotes) and provide four to five life expectancy globally. Prior to fossil fuels only a lucky few at the top
orders of magnitude more energy per gene than bacteria, enabling of social hierarchies escaped dire poverty that simply was the human
copious protein synthesis and, hence, complex lifeforms (source: condition. Fossil fuels today support billions of people in lifestyles
https://www.pnas.org/content/112/35/E4823). that were simply unimaginable only a few generations ago. Planes,
trains, and automobiles changed the game of human mobility. Modern
Human history has been profoundly influenced by the energy sources medicine, communications, the internet, and air conditioning have
available. Harnessing of fire, perhaps a million years ago, significantly changed the human condition beyond recognition for our ancestors.
changed the energy (food) sources available to humans. While we have The explosion of air conditioning post World War II dramatically
larger brains than other mammals, we also have a smaller digestive changed the map of where people live, enabling growth of mega cities
tract, which makes us unable to liberate much energy from complex like Houston, Atlanta, Phoenix, and Miami. This one energy-enabled
carbohydrate chains. Cooking food breaks down these complex chains technology has led to mass migration in the U.S. to the warmer, sunnier
making them digestible in human stomachs. climates that more people prefer.
16Figure 1.2 provides a rough timescale of fossil fuels displacing the RENEWABLE ENERGY AS A PERCENTAGE OF TOTAL GLOBAL ENERGY
nearly 100% of human energy previously supplied by renewable 100%
biofuels and a small amount from wind. The figure shows how in
the second half of the 19th century fossil fuels ignited the industrial 90%
revolution, enormously increasing human productivity that economic
Renewables as Share of Global Energy
historian Deirdre McCloskey called the Great Enrichment. By the year 80%
1900 over half of global energy was supplied by fossil fuels. It was not
70%
until after World War II, however, that the Great Enrichment began to
spread in the world’s lesser developed countries. But spread it did.
60%
The decades after WWII saw billions of humans lifted out of poverty.
A revolution that is still far from done, but has boosted living standards 50%
like never before.
40%
After dominating human energy supply throughout history, renewable
energy’s percent of global energy bottomed in the 1970s/1980s at 30%
around 13%. Since then, it has crept up to around 15% today as the Projections
continued gradual decline in market share of traditional fuels like wood, 20%
dung, and agricultural waste is being offset by the rise of solar, wind,
10%
and industrial scale biofuels. Solar and wind today make up about
2-3% of global primary energy supply. Also shown is the wide range of
0%
future projections for renewables market share from the International
1800 1850 1900 1950 2000 2050
Energy Agency and U.N. out to 2050. Of course, projections are just
projections. Figure 1.3 shows that changing the global energy system Figure 1.3 Renewable energy as a percentage of total global energy, 1800-2050.
Data from 1800-2018. The hatched funnel shows the spread of scenarios from the
is a gradual process. It moves slowly even when significantly more
International Energy Agency and United Nations.
Source: https://www.sciencedirect.com/science/article/pii/S0040162520304157
GLOBAL DIRECT PRIMARY ENERGY CONSUMPTION, 1800-2019 abundant, higher quality, cheaper, and cleaner fuels lead to consumer
Modern biofuels Solar pull as in the case of hydrocarbons displacing older, lower quality
Wind
140,000
Other renewables
Hydro energy sources.
Nuclear
All energy per person, TWh
120,000 Gas In addition to the continued displacement of traditional fuel sources
with hydrocarbons, there is a strong and growing force for change
100,000
in today’s energy system: concerns about climate change. Climate
80,000
change is covered in more detail in a subsequent section.
Oil
60,000 Media and political proclamations today calling for massive and
rapid changes in world energy systems appear unrealistic.1 Similar
40,000 proclamations have been made over at least the last five decades.
Coal The recent record illustrates the collateral human damage when
20,000
Traditional biomass attempting to force large-scale change without superior, cost-
0
Traditional biomass effective technologies. The early movers like Germany, the U.K.,
and California used top-down political mandates to drive changes in
1810
1880
1950
2020
1800
1820
1830
1840
1850
1860
1870
1890
1900
1910
1920
1930
1940
1960
1970
1980
1990
2010
2000
the energy system without carefully evaluating the tradeoffs. They
JP Morgan Annual Energy Paper 2021, Michael Cembalest: https://am.jpmorgan.com/
1 17
Figure 1.2 Source: Vaclav Smil (2017) and BP Statistical Review of World Energy.
content/dam/jpm-am-aem/global/en/insights/eye-on-the-market/future-shock-amv.pdfhave all driven significant increases in electricity (and other energy) Globally, and in the U.S., hydrocarbons remain just above 80% of total
prices with a resulting economic burden on their citizens, particularly primary energy supplied as they have been for the last few decades.
lower income people who spend a larger percent of their income on This is not to say that there are not significant changes happening in
energy. Lower income citizens also skew toward energy-intensive the mix of energy sources. Besides natural gas taking market share
jobs like manufacturing, farming, and transportation and hence from coal, we have also seen solar and wind rising rapidly. Nuclear and
disproportionately see their jobs being displaced to locales with lower hydro have not seen meaningful growth even with their status as the
energy costs. We will cover this issue more in the following section on two largest sources of very low carbon energy. Hydro struggles with
energy poverty. environmental pushback due to the large land footprint and intrusion in
waterways. Nuclear is held back by uncertainty around permitting and
The U.S. Energy Information Administration (EIA) data in Figure 1.4 regulatory challenges due to public fears over nuclear safety. The data
gives a sense of the changing global sources of electricity over the does not support the public fears as nuclear has an outstanding, pack-
last 50 years. The first thing that is clear is that global demand for leading safety record.
electricity and energy is rising. Globally electricity represents only
20% of total energy consumption. In wealthy countries, electricity The global energy system is and always has been both complex and
can get as high as 40% of total energy supplied. On a global basis critical to human welfare. It is too important to get wrong. In our own time
coal is the largest source of electricity, supplying around 35%. Natural the energy system is just as important as ever, but it is also immense in
gas is second at around 25%. Low carbon energy sources – nuclear, scale, meaning that rapid change cannot be expected. As Vaclav Smil has
hydropower, wind, and solar – combined supply just over 35% of global reminded us repeatedly, energy transitions take time.
electricity, a market share that has been roughly flat for the last 35
years but is rising modestly now.
GLOBAL ELECTRICITY PRODUCTION BY SOURCE
The last ten years have seen the dramatic impact in the United 25,000 TWh Other renewables
States, and to a lesser extent globally, of the shale revolution. Solar Wind
American natural gas production has risen dramatically, which
pushed global natural gas prices down.
20,000 TWh
The biggest impacts are seen in the electricity sector, where Hydropower
natural gas vaulted to the top supplying nearly 40% of
U.S. electricity. Coal has fallen hard from over 50% of U.S.
Nuclear
electricity supply just 15 years ago, to less than 25% today.
15,000 TWh
Oil
This has meant both cleaner air (lower PM2.5, SOX, mercury,
etc.) in the U.S. and a decline in U.S. GHG emissions on a per
Gas
capita basis to its lowest level in over 50 years. Well over
10,000 TWh
half of the steep U.S. drop in GHG emissions over the last 15
years is attributable to natural gas displacing coal (source:
EIA September 2020 report). The displacement of coal
by natural gas has also led oil and gas to their highest ever
5,000 TWh
market share of U.S. primary energy of nearly 70% in 2019 Coal
and 2020. The story is not a surge of hydrocarbons’ market
share, just a shifting among oil, gas, and coal. Nuclear energy
comes third at nearly 20% of U.S. electricity. The rest comes
mainly from hydropower, wind, and solar. 0 TWh
1985 1990 1995 2000 2005 2010 2015 2020
18 Figure 1.4 Source: EIA, Our World in Data based on BP Statistical Review of World Energy and Ember (2021)
Note: ‘Other renewables’ includes biomass and waste, geothermal, wave and tidal.In sub-Saharan Africa, an
estimated five out of six people
(approximately 900 million
people) in total lack access to
clean cooking resources.
95%
Almost 95% of that subset of
the population rely on solid
biomass for cooking in the
form of fuel wood, charcoal, or
dung. The remaining 5% rely on
kerosene or coal.
500,000
Household air pollution stemming
from inefficient and polluting
cooking fuels was linked to nearly
500,000 premature deaths in sub-
Saharan Africa in 2018.
ENERGY POVERTY 2.5 MILLION
Globally, WHO estimates deaths
from indoor air pollution at 2.5
The most urgent challenge with energy today is that fully one-third of humanity still
million – a figure comparable to
lacks access to basic modern energy, including over 80% of Africans and half of
the combined death toll of malaria,
Indians. Over two billion people still cook their daily meals and heat their homes with
tuberculosis, and HIV/AIDS in 2018.
traditional fuels, typically wood, dung, agricultural waste, or charcoal. Simply for lack
of access to a basic stove and an LPG canister, two to three million people die every
year from the resulting indoor air pollution. This staggering loss of human potential can
and must be eradicated.
19WHO estimates there are several million additional deaths from The good news is that tremendous progress is being made. Energy
outdoor air pollution from the same source: particulate matter, or access is increasing globally as hundreds of millions of people have
PM2.5, which is one of the world’s deadliest emissions. Transitioning made the transition from traditional cooking and heating fuels to
from traditional solid fuels to liquid fuels (or natural gas or electricity) modern fuels – most commonly to liquid petroleum gas (LPG) –
is the key to reducing outdoor PM2.5 concentrations just as it is for over the last 15 years. The U.S. shale revolution has been simply
reducing indoor PM2.5 levels. Figure 1.5 shows a global map of outdoor tremendous in lowering the energy cost bar for low-income families
PM2.5 pollution. This problem is worst in Africa, south Asia, southeast to transition from burning solid biofuels to clean-burning LPG stoves
Asia, and China, the same places where energy poverty drives the fueled by refillable LPG canisters. The U.S. is now by far the world’s
indoor air pollution crisis. Wealthy countries have used technology to largest exporter of LPG (dominantly propane) as well as the source
have both highly energized societies and clean air. of virtually all the growth in world LPG trade over the last decade.
This has brought down LPG prices and significantly grown available
Together PM2.5, malnutrition, preventable disease, and lack of access supplies. Continuing this trend is essential to bringing everyone clean-
to drinking water and basic education collectively are responsible burning cooking fuel in the next two decades.
for over 10 million premature deaths per year. Bringing affordable,
reliable energy to the world’s poor will be essential to eradicating
these scourges.
GLOBAL SATELLITE-DERIVED MAP OF PM 2.5 AVERAGED OVER 2001-2006
20 Figure 1.5 Source: Global satellite-derived map of PM2.5 averaged over 2001-2006. Credit: Dalhousie University, Aaron van Donkelaar
https://www.nasa.gov/topics/earth/features/health-sapping.htmlU.S. RESPONSIBLE FOR VIRTUALLY ALL GLOBAL LPG EXPORT GROWTH NUMBER OF PEOPLE IN THE WORLD WITH AND WITHOUT ELECTRICITY ACCESS,
1990-2016
7 billion
1,600
1,400 6 billion
LPG waterborne exports (MBPD)
1,200 5 billion
1,000
4 billion
Cleaner indoor air
800
Poverty abatement
3 billion
600
2 billion
400
1 billion
200
0 0
1990 1992 1994 1996 1998 2000 2002 2004 2006 2008 2010 2012 2014 2016
2010
2014
2018
2020
2012
2016
2019
2010
2014
2018
2020
2012
2016
2019
2010
2014
2018
2020
2012
2016
2019
2010
2014
2018
2020
2012
2016
2019
with electricity without electricity
Saudi
U.S. Qatar Algeria U.A.E. Norway Iran Kuwait
Arabia
Figure 1.6 Source: IEA and IHS Waterborne Figure 1.7 Source: The World Bank, World Development Indicators (WDI)
and UN Population Prospects
HEALTH AND HYDROCARBONS
ACCESS TO CLEAN-BURNING LPG IS ESSENTIAL TO MITIGATING OVER
2 MILLION DEATHS EACH YEAR FROM INDOOR AIR POLLUTION.
21
Source: UN Photo courtesy of the World LPG AssociationTHE DEVELOPED WORLD TAKES Below are side-by-side maps of per capita electricity consumption
by country and child malnutrition by country. There is a reason that
ELECTRICITY ACCESS FOR both maps look quite similar: energy is the prime mover that enables
GRANTED. FOR HUNDREDS OF everything else. If you have electricity, your life and that of your family
improves beyond recognition.
MILLIONS OF PEOPLE IT IS A
LUXURY OR ABSENT. Continuing the last several decades of unprecedented progress in
the human condition requires massive increases in affordable, reliable
Nearly one billion people have no access to electricity. Another billion energy for the world’s poorest countries and the poorest citizens in the
have only intermittent – four hours per day – access to modest amounts world’s middle income and wealthy nations. While progress continues
of electricity. This is enough to power a light bulb or charge a cell to be made, there are now growing headwinds due to the heavy-
phone, but not enough to power a water pump or other machinery handed actions of the world’s wealthy nations in the name of climate
necessary to raise their productivity and energize significant increases change. The World Bank, European Development Bank, and many large
in productivity and income. One billion people received their first commercial banks are now restricting or simply not offering funding
access to electricity in the last 20 years – the large majority from for hydrocarbon-fueled power plants, which are the main source of
hydrocarbons or hydropower. electricity generation globally, and even more so in developing nations.
ELECTRICITY CONSUMPTION kWh PER CAPITA
Figure 1.8 Source: World Bank – World
Development Indicators
22 0 kWh 750 kWh 6,000 kWh >55,000 kWhCHANGING WOMEN’S LIVES
• WOMEN IN ENERGY POVERTY SPEND MORE THAN AN HOUR PER DAY
GATHERING FUEL WOOD FOR COOKING.
• WOMEN IN ENERGY POVERTY SPEND AN HOUR PER DAY SOURCING WATER
FOR DRINKING AND COOKING.
Source: UN report – https://sustainabledevelopment.un.org/content/documents/17489PB12.pdf
PERCENTAGE OF UNDERWEIGHT CHILDREN AT AGE 5
Figure 1.9 Source: World Bank – World
Development Indicators
ENERGY ACCESS =
BETTER HEALTH
Nations with low access to
electricity have dramatically
higher child malnutrition
rates, as can be seen in the
similarity in these two maps.
Improved energy access
is a necessary condition to
improved health outcomes.
>60% 40% 25% 10% 0% 23The United Nations Human Development Index (HDI) is a good rough As with child mortality, and virtually any index of human well-being,
proxy for the human condition as it combines life expectancy at birth, increasing the HDI requires increased energy consumption. This
years of education received, and per capita gross national product. point is illustrated in the two graphs below. The first graph shows the
In 1990 62% of the global population (5.3 billion in 1990) scored relationship between energy consumption per capita and HDI across
“Low” on the HDI. The last three decades have shown tremendous countries, and the second graph shows the changes over the last
progress as now only 12% of today’s larger population (7.6 billion) thirty years for both China and India where rising energy consumption
score “Low” on the HDI. However, 12% is still over 900 million people. accompanies rising HDI.
ACCESS TO AFFORDABLE ENERGY IS
HUMAN DEVELOPMENT INDEX (HDI)
ESSENTIAL FOR HDI IMPROVEMENT
0
ENERGY USE PER CAPITA
(KG OF OIL EQUIVALENT)
Figure 1.10 Size of Circles Depicts Relative Size of Population | Source: World Bank and United Nations Development Programme 2018
24
24BETWEEN 1990 AND 2018, INDIA AND CHINA HAVE SEEN A
51% AND 52% IMPROVEMENT, RESPECTIVELY, IN HDI
INDIA CHINA
• MOVED FROM LOW TO MEDIUM HDI • MOVED FROM LOW TO HIGH HDI
• MEAN EDUCATION INCREASED 2.2X • MEAN EDUCATION INCREASED 1.6X
• LIFE EXPECTANCY INCREASED 11.5 YEARS • LIFE EXPECTANCY INCREASED 7.4 YEARS
• ENERGY PER CAPITA INCREASED 82% • ENERGY PER CAPITA INCREASED 192%
HUMAN DEVELOPMENT INDEX (HDI)
ENERGY USE PER CAPITA
(KG OF OIL EQUIVALENT)
Figure 1.11 Source: World Bank and United Nations Development Programme 2018
25Swedish public health doctor and global data maestro Hans Rosling Energy access for the world’s least fortunate is not only a social goal
wrote a great book as he was dying. Factfulness chronicles the for Liberty, it is a driving principle upon which the company was
enormous progress of humanity over the last several decades based founded. Energy poverty is not just a developing world problem.
on empirical measures of human well-being. The book also contains Over 10% of Americans struggle to pay energy bills and report
an illustrative figure (Figure 1.12), shown below, that captures and keeping their houses at unsafe temperatures to balance their budgets
quantifies the range of today’s living conditions. What we often fail to (source: EIA).
realize is that only about one-seventh of the world’s population lives in
conditions at all like the readers of this report. Too often policy-making Rich-world policies made to combat climate change can cause
and simply opinion formation focus only on that top one-seventh. more damage than benefits delivered if they don’t consider all the
world’s citizens. Making energy more expensive or impeding access
Rising from poverty and joining the modern, developed world requires to hydrocarbons is dangerous and opportunity crushing for those
an enormous increase in personal energy consumption. There is struggling to better their lives. Many climate policies also generate
simply no other way to rise from poverty. poor results in lowering global GHG emissions.
The modern world was enabled by a surge of available, reliable, Wood has higher GHG emissions than LPG per unit of energy.
affordable energy and all that followed in a highly energized society. The Extensive dependence on wood for fuel also leads to significant
speed at which liberating, energy-rich living conditions can be brought to deforestation impacts. Haiti has suffered extreme deforestation as
more people depends on the low energy costs that will create rising per so many of its citizens depend on wood for heating and cooking,
capita income. Slower economic growth inhibits the rise out of energy while neighboring wealthier and modern-energy enabled Dominican
poverty as do rising energy costs. Energy costs matter. Republic is covered in rainforest. Aerial photos show the stark
contrast at the border between these two nations.
LEVEL 1 LEVEL 2 LEVEL 3 LEVEL 4
LEVEL 4
Drinking Water
WORLD POPULATION IN BILLIONS OF PEOPLE
$32/Day
LEVEL 3
Transportation
$8/Day
LEVEL 2
$2/Day
Cooking
LEVEL 1
26
26
Figure 1.12 Source: Factfulness Gapminder and Dollar StreetOUR NEED FOR PETROCHEMICALS IS GROWING FASTER
THAN DEMAND FOR HYDROCARBON ENERGY
A little-known fact is that 14% of worldwide oil demand and 8% of natural gas demand go to make petrochemicals, like plastics and
pharmaceuticals. This demand is not for energy, it is to provide the essential raw materials that make the modern world possible. Petrochemical
demand is growing faster than demand for oil or natural gas. Petrochemicals represent between one-third and one-half of total projected future
demand growth for oil and gas. Could you imagine battling COVID without face masks, other PPE, syringes, carrier fluids for vaccines, etc.?
EVERYDAY GOODS TRANSPORTATION HEALTHCARE ENGINEERING AND OTHER
• Electronics • Lighter vehicle exteriors • Sterile packaging • Wind turbine and solar
• Food packaging • Synthetic rubber tires • Ethyl-alcohol/hand panel parts
• Clothing and footwear • Fuel additives sanitizer • Battery containers
• Textiles • Engine coolants • Ventilators, monitors, and parts
• Deodorants and cosmetics • Interior panels, seats, defibrillators, masks • Coatings
• Detergents and carpet • PPE • Insulation
• Diapers • Bicycles • Room conveniences • Paints
• Sports equipment • Boats • Vaccine syringes • Unbreakable glass
• Eyewear • Vaccine carrier fluids and • Agro-chemicals
vaccine refrigeration
• Pharmaceuticals
DID YOU KNOW?
HYDROCARBONS ARE AN INTEGRAL PART OF THE COVID-19 VACCINE
RESPONSE. THEY ARE USED TO DEVELOP, DISTRIBUTE, AND 27
REFRIGERATE, AND ARE EVEN USED IN CARRIER FLUID IN VACCINES.ENERGY ACCESS IS GREEN.
DOMINICAN
HAITI
REPUBLIC
28
28THE ISLAND OF HISPANIOLA IS SHARED BY
HAITI AND THE DOMINICAN REPUBLIC.
The national border can be seen in this photo DUE TO THE SEVERE
DEFORESTATION in Haiti as traditional biofuels are the primary energy source for
much of the population.
The Dominican Republic, on the other hand, has EIGHT TIMES HIGHER PER CAPITA
8X ENERGY CONSUMPTION than Haiti, almost entirely from fossil fuels.
Higher energy consumption means HEALTHY, LONGER LIVES.
Far less people relying on traditional energy sources like wood means THRIVING
FORESTS AND A CLEANER ENVIRONMENT.
29CLIMATE CHANGE
The human condition has been completely transformed by three One methane molecule combines with two oxygen molecules to
energy transitions: harnessing of fire, advent of agriculture, and fossil create one CO2 molecule and two water vapor molecules (the white
fuels. (source: Ian Morris, Foragers, Farmers and Fossil Fuels). The steam you see rising from power plants) while liberating significant
fossil fuel transition that so uplifted the human condition came with amounts of energy to produce electricity, power industrial processes,
another change: climate change. While agriculture was the primary heat your house, etc.
source of human energy, including that harnessed from draught
animals, the carbon cycle had annual flows. During the Northern 700 ATMOSPHERIC CO 2 AT MANUA LOA OBSERVATORY
Hemisphere spring and summer plant photosynthesis, using energy 650
from sunlight, draws carbon dioxide (CO2) out of the atmosphere to
combine with water to make chlorophyll, the basic building block of 600
Double Preindustrial Levels
plant biology. In the fall and winter photosynthesis drops dramatically 550
and plant decomposition returns CO2 to the atmosphere, completing
the annual cycle. Photosynthesis requires a minimum atmospheric 500
CO2 concentration of 0.015% (150 ppm). During the last glacial period 450
(16,000 to 100,000 years ago) atmospheric CO2 nearly breached this
level, falling to only 180 ppm. 400 Atmospheric CO2
350
It is estimated that atmospheric CO2 concentration was just below
0.03% (280 ppm) before the industrial revolution and large scale 300
burning of hydrocarbons, or fossil fuels. The hydrocarbon-powered
250
global economic growth since World War II has driven a steady climb
(shown in Figure 1.13) in atmospheric CO2 concentration to slightly 200
above 0.04% (415 ppm in 2019) as humans have been liberating the Photosynthesis Ceases
150
solar energy stored long ago (over hundreds of millions of years) in
ancient plants (coal) and marine phytoplankton (oil and natural gas). 100
Atmospheric CO2 concentration rises due to the combustion of
50
fossil fuels, which is essentially a reversal of the photosynthetic
reaction where oxygen is combined (burning) with hydrocarbons. 0
1960 1970 1980 1990 2000 2010 2020
The equation shown on the next page represents the chemical
reaction of burning methane, the simplest hydrocarbon. Figure 1.13 Scripps Institution of Oceanography NOAA Earth System Research
Laboratory https://www.e-education.psu.edu/earth103/node/1018
30CH4 + 2 O2 = CO2 + 2 H2O is used because these molecules absorb infrared radiation that the
earth continually emits into space to balance the incoming heat
from the sun. The net impact of increasing GHG concentrations is to
Roughly half of the CO2 released in this combustion reaction has gone warm the average temperature of the earth. The largest warming is
either into the oceans or into “greening” the planet as the increased expected (and has been measured) in the cold polar areas at night
availability of CO2 (plant food) in the atmosphere has led not only with progressively less warming moving towards the tropics. Even in
to increased agricultural productivity (why commercial greenhouses the tropics, the warming impact is larger at night than during the day.
enrich their air with CO2) but also to a significant increase in grasses, Estimates from radiation physics predict that doubling pre-industrial
trees, phytoplankton, and plant matter of all kinds across the globe. times atmospheric CO2 concentration to 560 ppm (likely by late this
Figure 1.14 shows the significant greening of the planet over the last century) would result in a 1.3 – 1.4 degree C average warming of the
few decades. planet in the absence of feedback effects. A recent empirical study
of historical temperature data provides similar warming estimates
The other half of the released CO2 has remained in the atmosphere of 1.2 – 1.8 degree C in response to a doubling of atmospheric CO2
driving the increased CO2 concentration shown in Figure 1.13. It is this levels (source: Lewis, Curry, 2018). There remains significant scientific
increased atmospheric CO2 concentration that is the source of climate uncertainty around feedback effects, mainly induced changes in
change concerns as CO2, like water vapor, methane and nitrous oxide, atmospheric water vapor (a more significant GHG than CO2) and
is a significant “greenhouse” gas. The term greenhouse gas (GHG) impacts on cloud formation. This is highly technical with myriad
research efforts focusing on this
critical topic. We will not delve into a
GLOBAL GREENING FROM discussion of climate feedback in
CO 2 FERTILIZATION this report.
This summary is simply to provide
basic understanding and context
around climate change and provide
a summary overview of key historical
observational data for global average
temperature, sea level rise, extreme
weather events and deaths from
extreme weather events. The first
two are rising, the third displays no
trend, and the fourth is plummeting.
These are far from the only areas of
climate change discourse, but they
are the central ones.
Figure 1.15 on the next page
shows the entire record of the
atmospheric temperature record
from the University of Alabama,
Huntsville. We show atmospheric
data as this technology allows a
Figure 1.14 https://www.nasa.gov/feature/goddard/2016/carbon-dioxide-fertilization-greening-earth
31UAH GLOBAL LOWER TROPOSPHERIC TEMPERATURE VARIATIONS (°C) 1979-2020
0.5
0.4
0.3
Temperature Anomaly (°C)
0.2
0.1
0.0
-0.1
-0.2
-0.3
-0.4
1980 1990 2000 2010 2020
Figure 1.15 https://www.nsstc.uah.edu/data/msu/v6.0/tlt/uahncdc_lt_6.0.txt Version 6.0 of the UAH Temperature Dataset Spencer, et al 2015
more uniform measure across the whole planet, as opposed to land-
based sensors that suffer from uneven spatial coverage, changing
conditions around measurement locations like urban heat island
effects, different temperature sensors employed, continuously WHILE GLOBAL SEA LEVEL IS RISING, CORAL
evolving “homogenization” techniques, etc. Satellite measurement of ATOLL ISLANDS ARE NOT SHRINKING.
global temperatures began in 1979. The full 40-year record of lower
atmospheric temperature shown in Figure 1.15 shows a rate of warming
of 0.14 degree C per decade.
Remote Sensing Systems also provide global atmospheric temperature
measurements that show a somewhat higher rate of warming.
Averaging the two raises the observed warming rate to around 0.17
degree C per decade. This implies that at the rate of warming observed
over the past 40 years, we would expect little more than another one
degree C of warming by the end of the 21st century. This is in addition
to the roughly one degree C of warming that the world has seen over
32
Source: https://agupubs.onlinelibrary.wiley.com/doi/10.1029/2020GL088752the last century. Climate change impacts are MEAN SEA LEVEL RISE FROM TIDAL STATION AND ALTIMETRY FROM 1880-2020
most often estimated by economists based on 350
the total warming
from pre-industrial times. We will discuss
Global Mean Sea Level Change (mm)
300
these projections in the following Climate
250
Economics section.
200
After increasing global temperatures, sea level
rise and extreme weather events are the other 150
climate changes that are most often raised as
100
concerning. We include the data here on sea
level rise over two different time scales and 50
with two different measurement technologies.
Tide gauges have the longest direct 0
instrumental (not proxy) record of global sea
-50
level rise. Figure 1.16 shows a roughly 150-year
record of changes in global average sea level -100
from tide gauges. The modern rise in sea level 1880 1900 1920 1940 1960 1980 2000 2020
began in the middle of the 19th century as the Figure 1.16 Sea level rise PSMSL Tidal Data 1700-2002 Updated from Jevrejeva et al, 2008,
Little Ice Age came to an end and the planet https://www.psmsl.org/products/reconstructions/gslGRL2008.txt
started warming. It shows an average rate of
rise of a little less than one inch per decade.
The quality of the data set is limited by the
number of tide gauges included, which is
lower in the early years of the record but much
better in the more recent years.
MEAN SEA LEVEL RISE FROM SATELLITE DATA FROM 1993-2020
Despite this limitation it is worthwhile to view
150
a longer-term perspective on sea level trends.
From indirect proxy records, we know that sea
Global Mean Sea Level Change (mm)
125
levels have risen around 400 feet since the end
100 of last glaciation nearly 20,000 years ago.
75 Figure 1.17 shows the satellite record of changes
in sea level. The satellite sea level record only
50 begins in 1993. It shows a relatively constant
rate of sea level rise over its 28-year record of
25 a little over one inch per decade (1.3 inches per
decade). The discrepancy between the rates
0
of rise from satellite and tide gauges remains
-25
in the most modern data. It is likely the result
of the different measurement mechanism that
-50 each are employing. However, we have some
1995 2000 2005 2010 2015 2020
Figure 1.17 Sea level rise 33
https://scitechdaily.com/satellite-mission-keeps-a-steady-eye-on-sea-level-change-from-space/GLOBAL TROPICAL CYCLONE ACCUMULATED CYCLONIC ENERGY (ACE) 1972-2020 GLOBAL TROPICAL CYCLONE LANDFALLS 1970-2018
2400 32
30
Accumulated Cyclonic Energy (ACE) 104 knots2
Category 1-2 Category 3+
Number of global tropical cyclone landfalls
28
2000 26
24
22
20
1600
18
16
14
1200
12
10
8
800 6
4
2
400 0
1970 1980 1990 2000 2010 2020 1970 1980 1990 2000 2010 2020
Global Northern Hemisphere Figure 1.19 Updated from Pielke, Roger (2020),
https://journals.ametsoc.org/view/journals/clim/25/13/jcli-d-11-00719.1.xml
Figure 1.18 Updated from Maue, R.N. (2011) http://climatlas.com/tropical/
7 U.S. TROPICAL CYCLONE LANDFALLS 1900-2020
Number of U.S. tropical cyclone landfalls
6
5
4
3
2
1
0
1900 1910 1920 1930 1940 1950 1960 1970 1980 1990 2000 2010 2020
Figure 1.20 Source: https://journals.ametsoc.org/view/journals/bams/99/7/bams-d-17-0184.1.xml
34 *Cyclones are commonly referred to as hurricanes and typhoons.confidence in knowing that sea levels are U.S. STRONG TO VIOLENT TORNADOES (>F3), 1950-2019
currently rising at a global average rate of
130
around one inch per decade or perhaps a bit
more, with no observable change in the rate of 120
rise over the last few decades. We must say 110
“global average” as sea level has significant 100
geographical variability due to the uneven
Number of tornadoes >F3
90
rebound of the continental plates (isostatic
rebound) in response to the massive ice 80
sheets melting at the end of the last glaciation 70
10,000 to 20,000 years ago. For example, 60
currently sea level is roughly static near San
50
Francisco and along the U.S. west coast, while
rising at about global average along the U.S. 40
east coast, and rising at a much more rapid 30
rate than the global average on Australia’s 20
west coast. Rising sea level presents a threat
10
to coastal cities and their fresh water aquifers,
0
hence it is important to understand what 1950 1960 1970 1980 1990 2000 2010 2020
is happening.
Figure 1.21 Source: NOAA (2020) https://www.spc.noaa.gov/wcm/
Extreme weather features prominently in the
news perhaps due to the frightening sense
of awe inspired by hurricanes, tornadoes,
floods and droughts. Extreme weather GLOBAL AREA IN SEVERE METEOROLOGICAL DROUGHT, 1901–2017
has killed millions of people over the years,
displacing and impoverishing countless
more. Fortunately, to date we have not 20
Area in severe drought, million km2
seen an increase in extreme weather events,
and deaths from extreme weather events
have been plummeting as a wealthier, more
15
energized world has proven far more resilient
than in times past.
Figure 1.18 shows the trend in Accumulated 10
Cyclonic Energy (ACE), a metric that captures
together the frequency, duration and intensity
of global hurricane activity since 1970. Figure 5
1.19 shows a different hurricane metric: the
trend in the number of global land-falling
hurricanes since 1970. Figure 1.20 shows
the same metric for the United States dating 0
1900 1920 1940 1960 1980 2000 2020
all the way back to 1900. As you can see
Figure 1.22 Source: https://www.sciencedirect.com/science/article/pii/S0040162520304157
35U.S. FLOOD DAMAGE AS PERCENTAGE OF GDP, 1940-2018 U.S. FOREST AREA BURNED, 1926-2020
0.75%
0.70% 50M
0.65%
45M
0.60%
0.55% 40M
Millions of acres burned
0.50%
U.S. flood damage
35M
0.45%
30M
0.40%
0.35% 25M
0.30%
20M
0.25%
0.20% 15M
0.15%
10M
0.10%
5M
0.05%
0.00% 0
1940 1950 1960 1970 1980 1990 2000 2010 2020 1930 1940 1950 1960 1970 1980 1990 2000 2010 2020
Figure 1.23 Source: https://ascelibrary.org/doi/10.1061/%28ASCE%291527- Figure 1.24 Source: https://iopscience.iop.org/article/10.1088/1748-9326/aab791;
6988%282005%296%3A1%2813%29; https://www.pnas.org/content/118/4/e2017524118/tab- https://www.sciencedirect.com/science/article/pii/S0040162520304157#fig0018
figures-data; https://rogerpielkejr.substack.com/p/global-disasters-a-remarkable-story
from these figures, while there is large annual variability in hurricane damage. United States annual flood damage as a percent of GDP
activity, the data shows no obvious increasing trend. 2020 proved a starting in 1940 is shown in Figure 1.23. Annual flood damage shows
very active hurricane season, at least in the Atlantic where there was a meaningful downward trend, more likely due to better flood
a record number of named storms (tropical storms plus hurricanes). preparedness than due to an actual reduction in floods or extreme
However, 2020 doesn’t even crack the top 10 years in Atlantic rain events. With the availability of abundant, reliable energy, humans
Accumulated Cyclonic Energy. have been better able to predict, prepare, and sometimes even
prevent these deadly and costly flooding events.
Figure 1.21 shows the frequency of severe tornadoes in the United
States starting in 1954. Fortunately, the trend here appears to Wildfires are a slightly different story as forest management practices
be downward. play a leading role. A U.S. Forest Service scientists study of Western
U.S. Forests concluded that increased “live fuel” due to changing
Figure 1.22 shows the percent of the world in extreme level drought forest management practices were responsible for more than 50%
since 1900. There appears to be a slight decline in global drought of the recent increase in wildfires. Figure 1.24 shows a hundred
prevalence over the last century, as might be expected as a slightly years of annual U.S. forest acres burned. In the 1930s wildfires
warmer world implies a slightly wetter world due to increased annually burned several times more acres than they do today. The
evaporation. Floods are harder to quantify except in their economic Wildfire Acres Burned graph also shows the dramatic impact of the
36You can also read