Russia Economic Report #43 - Russia: Recession and Growth under the Shadow of a Pandemic - Pubdocs.worldbank.org.
←
→
Page content transcription
If your browser does not render page correctly, please read the page content below
2020

   Russia Economic Report #43
   Russia: Recession and Growth under the Shadow of a Pandemic
   Special Focus: Education

The cutoff date for the analysis and data used in this report was June 30, 2020 for parts 1 and 2.

Table of Contents

OVERVIEW......................................................................................................................................................................... 7
PART 1. Recent Economic Developments ....................................................................................................................... 16
   1.1 Global activity: a sharp recession amid the COVID-19 pandemic..................................................... 16
   1.2 Russia: sliding into recession after relatively robust growth in the first quarter ............................. 21
   1.3 Balance of payments: the COVID-19 crisis has weighed on the current account since February,
   mainly due to the contraction in energy goods exports ......................................................................... 26
   1.4 Monetary Policy: The CBR moved to an accommodative monetary policy ............................................. 34
   1.5 Financial sector: Vulnerabilities on the Rise ..................................................................................... 37
   1.6 Fiscal policy: Fiscal revenues are under strain from low oil prices and the spread of the pandemic
   ................................................................................................................................................................ 45
   1.7 Labor market and poverty trends ..................................................................................................... 50
PART 2. Outlook: A deep recession looms – with a modest hike in the poverty rate .................................................... 61
PART 3. Education in Russia ............................................................................................................................................ 67
   1. The importance of education in Russia and long-term positioning for stronger economic growth .. 68
   2. Better and smarter education has been a focus of government policies ........................................... 74
   3. The short- and long-term impacts of COVID-19 on Russia’s education system ................................. 79
   4. Challenges of Russia as a premium higher education destination: the value of internationalization
   and concentration on elite universities .................................................................................................. 83
   Conclusion ............................................................................................................................................... 87
Annex .............................................................................................................................................................................. 90

List of Figures
Figure 1: Global activity has fallen into a recession .................................................................................... 17
Figure 2: The global goods trade has sharply contracted amid supply-chain disruptions and weak
demand ....................................................................................................................................................... 17
Figure 3: Global stock markets recovered and borrowing costs stabilized ............................................... 17
Figure 4: Google mobility indicators have underscored the weakness in economic activity .................... 18
Figure 5: In the first quarter of 2020, economic growth in China contracted by 6.8 percent.................... 19
Figure 6: Brent crude oil prices fell to a multi-decade low ......................................................................... 20
Figure 7: Demand for oil is expected to decline 18 percent in the second quarter of 2020 ...................... 20
Figure 8: In the United States, the oil rig count fell to its lowest level since 2009 ..................................... 20
Figure 9: The epidemic reached Russia later than the EU, US, and Asian countries .................................. 21
Figure 10: High-frequency indicators of consumer and investment demand suggest continued growth in
January -February ....................................................................................................................................... 21
Figure 11: In the first quarter of 2020, GDP growth flash estimate points to a limited effect from COVID-

                                                                                                                                                                    1
19 ................................................................................................................................................................ 22
Figure 12: Export volumes for many commodities exported by Russia dropped in the first quarter of
2020 compared to the first quarter of 2019 ............................................................................................... 22
Figure 13: Electricity consumption dropped in April (adjusted for temperature effects, y/y) ................... 22
Figure 14: In April, growth weakened in all sectors except agriculture ..................................................... 23
Figure 15: PMI indexes reached record lows in April ................................................................................. 23
Figure 16: The number of SMEs has declined, notably in the Central Federal District .............................. 24
Figure 17: The number of employees in SMEs has followed a declining trend, picking up in May 2020... 24
Figure 18: The current account weakened in the first quarter of 2020 to 5.5 percent of GDP compared to
8.9 percent of GDP in the same period last year ........................................................................................ 27
Figure 19: In the beginning of 2020, prices dropped for most commodities exported by Russia.............. 27
Figure 20: Total goods exports fell by 19.8 percent, y/y, in January-April 2020 ........................................ 28
Figure 21: Services exports fell by 5 percent, y/y, in the first quarter of 2020 and by 18 percent in
January-April 2020 ...................................................................................................................................... 28
Figure 22: Exports to the EU, CIS, and Asia dropped considerably in January-March 2020, y/y, imports
declined modestly ....................................................................................................................................... 28
Figure 23: In March, inflation rose for the first time in a year ................................................................... 35
Figure 24: Heightened global risk aversion on financial markets created pressure on the exchange rate
and bond spreads in Russia, which was exacerbated by a slump in oil prices ........................................... 37
Figure 25: Deposits remain banks’ main funding source (as percent of total liabilities) ........................... 38
Figure 26: High level of NPLs in the system ................................................................................................ 38
Figure 27: Key credit and financial-sector performance indicators remained stable at the onset of
pandemic .................................................................................................................................................... 39
Figure 28: Credit growth dynamics continue to be mixed.......................................................................... 39
Figure 29: Corporate loans account for 54 percent of the banking sector loan portfolio, as of April 1 .... 43
Figure 30: Among the most vulnerable sectors in the corporate sector lending portfolio are
manufacturing, trade, and transportation (structure of debt by sector, as of May 1)............................... 43
Figure 31: The federal budget surplus dropped in the first five months of 2020 ...................................... 46
Figure 32: Regional budget expenditure rose by 14.4 percent in January-April 2020, compared to
January-April 2019 ...................................................................................................................................... 46
Figure 33: Russia’s support package is low, relative to advanced economies, but at par with others
(percent of GDP) ......................................................................................................................................... 49
Figure 34: In terms of government debt sustainability and external sector debt, Russia favorably
compares to other EMDEs .......................................................................................................................... 50
Figure 35: The number of employed and labor force decreased in April-May .......................................... 51
Figure 36: The unemployment rate was close to a minimum but increased in April-May, percent .......... 51
Figure 37: Real wage contracted in April 2020 across most sectors, percent year-on-year ..................... 52
Figure 38: Real disposable income decreased in the Q1 2020 compared to the same period of 2019,
percent year-on-year .................................................................................................................................. 52
Figure 39: Ex ante, announced government measures could partly contain the crisis-induced increase . 56

                                                                                                                                                                    2
Figure 40: The impact of the crisis varies by groups of population ............................................................ 57
Figure 41: Crude oil supply is expected to fall ............................................................................................ 62
Figure 42: The growth forecast for Russia suggests deep contraction in 2020 (real GDP growth, percent)
 .................................................................................................................................................................... 63
Figure 43: Crude oil, oil products, and natural gas accounted for 87.6 percent of energy export value,
and 54.4 percent of total exports (2019) .................................................................................................... 63
Figure 44: Infrastructure projects and support to SMEs total about half of the plan ............................... 66
Figure 45: Top Harmonized Learning Outcomes Performers ..................................................................... 69
Figure 46: Relative performance in collaborative problem solving based on performance in PISA science,
reading and mathematics ........................................................................................................................... 72
Figure 47: Potential learning loss in reading in Russia due to COVID-19 (if schools are closed for 5
months) ....................................................................................................................................................... 81
Figure 48: An effective online learning support platform is available (percentage of 15-year-old students
whose school principal agreed or strongly agreed when answering this question) .................................. 82

List of Tables
Table 1: Balance of payments accounts, US$ bln ....................................................................................... 30
Table 2: Fiscal support measures total 3.9 percent of GDP. ....................................................................... 47
Table 3: Poverty (cumulative) ..................................................................................................................... 53
Table 4: A deep recession is projected in 2020 (Major macroeconomic indicators) ................................. 64
Table 5: Actual poverty rates and projections by scenarios (percent): ...................................................... 64
Table 7: Skill shortages as reported by employers in Russia ...................................................................... 71
Table 8: Policies for each group of Russian regions .................................................................................... 76
Table 9: Progress of Russian universities in international university rankings (2012-2020). ..................... 83

List of Boxes
Box 1: SMEs are disproportionally affected by the current crisis, being more vulnerable and less resilient
to the supply and demand shocks, while relying more on a services consumption that has rapidly
declined....................................................................................................................................................... 25
Box 2: Russia and the EAEU impose restrictive trade policies in response to COVID-19. ......................... 30
Box 3: Financial-Sector Support Measures in Response to COVID-19. ....................................................... 40
Box 4: SME Support Measures in Response to COVID-19 .......................................................................... 44
Box 5: The Returns to Education: Crucial Component of Russia’s Human Capital ..................................... 78
Box 6: Methodology for Estimating the Impact of COVID-19-Induced School Closures on Learning Loss*
 .................................................................................................................................................................... 79

                                                                                                                                                                      3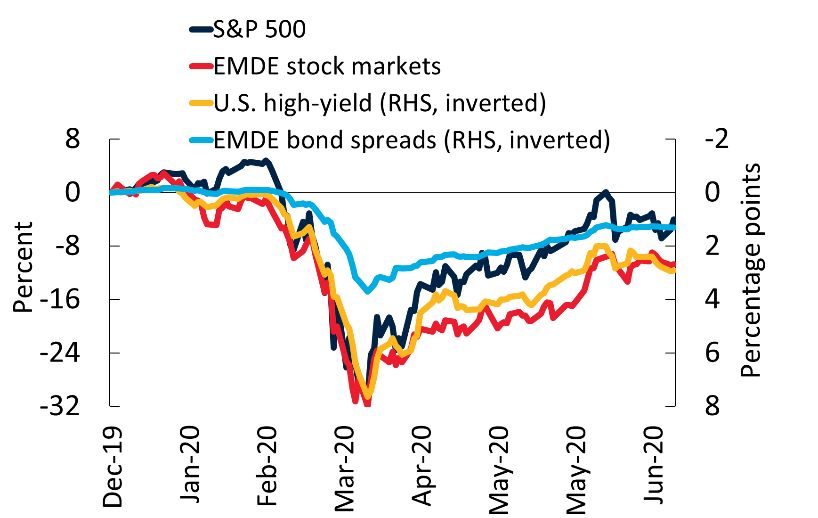
Abbreviations and Acronyms

AML/CFT    Anti-Money Laundering/Combating the Financing of Terrorism
ARWU       Academic Ranking of World Universities
BNM        Bank Negara Malaysia
CAR        Capital Adequacy Ratio
CBR        Central Bank of the Russian Federation
CGC        Credit Guarantee Corporation Malaysia
CIS        Commonwealth of Independent States
CLPS       Collaborative Problem Solving
COVID-19   Coronavirus Disease
CPAP       Constant Positive Airway Pressure
CPB        Netherlands Bureau for Economic Policy Analysis
CPI        Consumer Price Inflation
EAEU       Eurasian Economic Union
ECA        Europe and Central Asia
ECDC       European Centre for Disease Prevention and Control
EGE        Unified State Examination
EMBI       Emerging Markets Bond Index
EMDEs      Emerging Markets and Developing Economies
EU         European Union
EUROMOD    Tax-Benefit Microsimulation Model for The European Union
FDI        Foreign Direct Investment
FX         Foreign Exchange
GDP        Gross Domestic Product
GFC        Global financial crisis
GNFS       General Number Field Sieve
HCI        Human Capital Index
HLO        Harmonized Learning Outcomes
HSBC       Hong Kong and Shanghai Banking Corporation
HSE        Higher School of Economics
IEA        International Energy Agency
IMF        International Monetary Fund
KYC        Know Your Customer
LNG        Liquified natural gas
MSCI       Morgan Stanley Capital International
NPA        Non-performing assets
NPL        Non-performing loan
NWF        National Welfare Fund
OECD       Organization for Economic Co-operation and Development
OPEC       Organization of the Petroleum Exporting Countries
PBOC       People’s Bank of China
PIRLS      International Reading Literacy Study
PISA       Program for International Student Assessment
PIT        Personal Income Tax

                                                                        4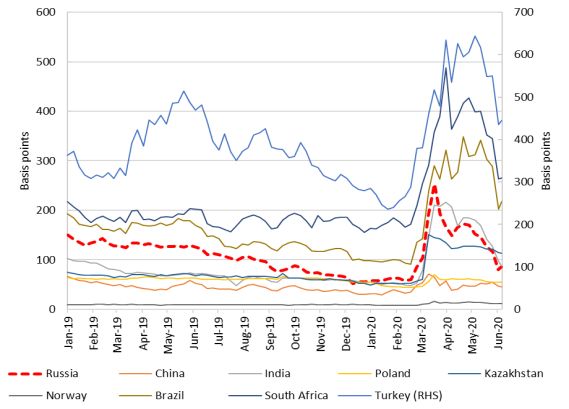
PMI       Purchasing Managers’ Index
QS        Quacquarelli Symonds
READ      Education Aid Development Program
REER      Real Effective Exchange Rate
RF        Russian Federation
RLMS      Russia Longitudinal Monitoring Survey
ROA       Return on assets
ROE       Return on equity
Rosstat   Russian Federal State Statistics Service
RUSMOD    Tax-Benefit Micro Simulation Model for Russia
SACE      Italian Export Credit Agency
SIC       Social Insurance Contributions
SMEs      Small and Medium-Sized Enterprises
THE       Times Higher Education
TIMSS     Trends in International Mathematics and Science Study
VAT       Value-Added Tax
WB        The World Bank
WTI       West Texas Intermediate
WTO       World Trade Organization

                                                                  5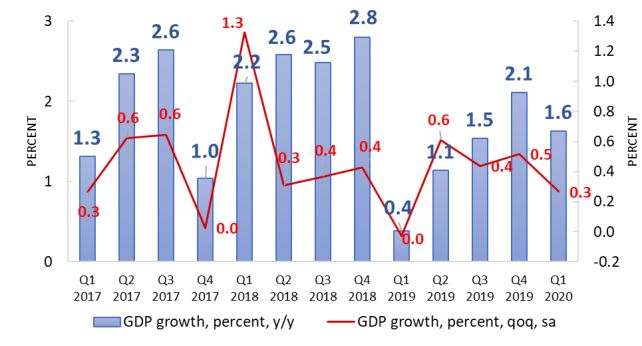
Acknowledgements

This report is produced twice a year by World Bank economists in the Macroeconomics, Trade and
Investment (MTI) Global Practice. The team that prepared this edition was led by Apurva Sanghi (Lead
Economist for the Russian Federation) and Olga Emelyanova (Economist, MTI), and consisted of Mikhail
Matytsin (Research Analyst, POV), Irina Rostovtseva (Research Analyst, MTI), Lucie Wuester (Consultant,
MTI), Katerina Levitanskaya (Senior Financial Sector Specialist, FCI), Martin Melecky (Lead Economist,
FCI), Peter Stephen Oliver Nagle (Senior Economist, EFI PG), Collette Mari Wheeler (Economist, EFI PG),
Julia Renee Roseman Norfleet (Research Analyst, EFI PG), Samuel Freije-Rodriguez (Lead Economist,
POV), Nithin Umapathi (Senior Economist, SPL), and Yohei Okawa (Economist, EFI PG).

The focus note on education in Russia was produced by the World Bank Education ECA Global Practice
team: Harry Anthony Patrinos (Practice Manager), Tigran Shmis (Senior Education Specialist, Education
ECA), Denis Nikolaev (Education Specialist), Maria Ustinova (Consultant), Polina Zavalina (Consultant)
and Suhas Parandekar (Senior Economist).

Peer reviewers included Dmitry Zaitsev (Commissioner, Accounts Chamber of the Russian Federation),
Kevin Carey (Practice Manager, EMNM2, MTI), Ivailo Izvorski (Lead Economist, EECM1, MTI) and Halsey
Rogers (Lead Economist, HEDGE, Education).
The team would like to thank Renaud Seligmann (Country Director for the Russian Federation), Sandeep
Mahajan (Practice Manager, MTI Global Practice), Asli Demirguc-Kunt (Chief Economist, ECACE), Michael
Lokshin (Lead Economist, ECACE), Ivan Torre (Economist, ECACE), Annette Kyobe (Resident
Representative, IMF), Oxana Dynnikova (Economist, IMF), Nina Chebotareva (Economist, IMF), Sergei
Ulatov (Director for coordination, Eurasian Development Bank) for their comments, advice and support.
The team also would like to express its gratitude to the Department for Budget Policy and Strategic
Planning of the Ministry of Finance for its collaboration.

The report was edited by Christopher Pala (Consultant). It went to press on July 6, 2020.

For queries, please contact Apurva Sanghi at asanghi@worldbank.org.

                                                                                                     6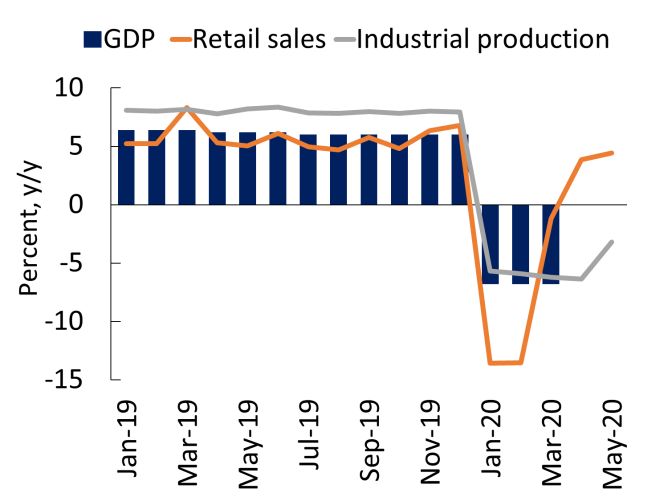
OVERVIEW
    A. Sharp recession grips the world
The COVID-19 pandemic has triggered a deep global economic recession. The COVID-19 shock is the
most adverse peacetime shock to the global economy in a century. Activity contracted across major
economies in Q1 2020, including in China, the Euro Area, the United States and Japan, as these countries
grappled with the pandemic to varying degrees. Overall, global GDP is estimated to have sharply
contracted in Q1 2020 by -11.1 percent (q/q, saar), and is expected to drop by 5.2 percent overall in
2020. Global industrial production suffered its steepest fall since the 2008 global financial crisis.
Economic indicators point to an even steeper fall in Q2 2020, reflecting an unprecedented collapse in
services and manufacturing amid lockdown measures. Manufacturing activity and new export orders, as
measured by the Purchasing Managers' Index (PMI), have slid into a deep contraction as global trade
suffers from supply disruptions and weakened demand. Many emerging market and developing
economies (EMDEs) have experienced capital outflows greater than during the 2008 global financial
crisis as aversion to risk has spread and portfolio investors have moved to safer grounds with
unparalleled speed.
Crude oil prices have plummeted since the start of the year. They dropped 65 percent between January
and April. With incipient tensions in the global oil market already present in early 2020, oil demand
collapsed as a result of the pandemic, and the restrictions needed to stem its spread have severely
disrupted the transportation sector, which accounts for around two-thirds of oil demand. Oil demand is
expected to decline by an unprecedented 8 percent in 2020. However, since April, oil prices have seen a
partial recovery, with the price of Brent crude oil averaging US$40/bbl in June, up from US$23/bbl in
April, as some countries started to ease lockdown restrictions and oil producers have implemented
sharp cuts to production.
Activity in the Euro Area – Russia's largest trading partner – also contracted. The Euro Area GDP
contracted at an annualized rate of 13.6 percent in Q1 2020 — the steepest fall in the bloc's existence —
with several economies registering record declines. Retail sales and industrial production in the Euro
Area both experienced their largest contraction on record in March. The weak momentum in sales and
production will contribute to what is expected to be an unprecedented collapse in output during the
second quarter, possibly falling by nearly 50 percent (q/q, saar), according to the European Central Bank.
China, Russia's second-largest trading partner, has embarked on a fragile recovery after a major
economic contraction. Its GDP fell by 6.8 percent in Q1 2020, the first negative growth reading since
quarterly records began in 1992. However, incoming data suggest that the output decline softened
somewhat in March, as falls in industrial production, nominal retail sales, and imports and exports
bottomed out. Available daily activity data in April pointed to a continued gradual normalization of
economic activity. The recovery remains fragile, however, as air traffic and tourism, for example, remain
well below levels observed prior to COVID-19.
    B. Russia heads toward a recession
According to the estimates of the Ministry of Economic Development, GDP contracted by 12. 1 percent,
y/y, in April and 10.9 percent, y/y, in May. High-frequency statistics in April and May pointed to negative

                                                                                                         7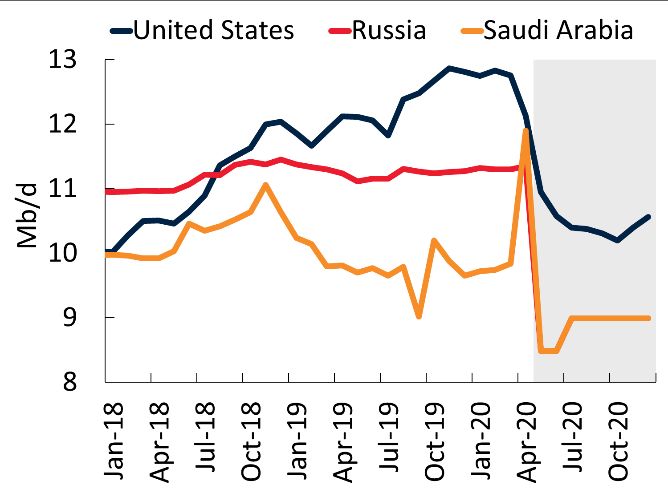
growth in most sectors. Manufacturing contracted by 10 percent, y/y, in April and 7.2 percent, y/y, in
May with severe negative impacts in metals production and transport vehicles. Mineral-resource
extraction decreased by 3.2 percent, y/y, before OPEC+ production cuts that started in May and by 13.5
percent, y/y, in May. As a result, industrial production shrank (Figure O-1). The transportation sector
was hit by falling trade volumes since the beginning of the year, contracting by 6 percent, y/y, in April
2020 and 9.5 percent, y/y, in May. PMI indexes reached record lows in April, compared to other
countries and historically, recovering somewhat in May (Figure O-2).

Figure O-1: In April - May, industrial production Figure O-2: In April, Russia's PMI indexes
growth turned negative in Russia                  reached record lows

Source: Haver.                                           Source: Haver.
                                                         Note: Purchasing Managers' Index (SA, > 50 =
                                                         mom expansion; < 50 = mom contraction).

The pandemic's spread resulted in reduced fiscal revenues and a weakened ruble. In the first five months
of 2020, despite the contribution to revenues from the one-off sale of Sberbank shares, the federal
budget registered a deficit of Rub406.6 billion compared to a surplus of Rub1,283.3 billion in the same
period last year on the back of higher spending and lower oil/gas revenues. After accelerating in April,
inflation slowed down in May to 3.0 percent, y/y, as disinflationary pressures from a decrease in
aggregate demand outweighed the impact of the FX passthrough. As in other EMDEs, heightened global
risk aversion on financial markets, further exacerbated by a slump in oil prices, weakened the ruble by
11 percent since the beginning of the year.
Bank asset quality is likely to deteriorate across the corporate, SME and retail segments. Russian banks
entered the crisis with reasonable capital buffers and comfortable liquidity. However, the high levels of
NPLs (close to 10 percent) can be expected to increase further as household and corporate finances
deteriorate due to disruptions in economic activity from the COVID-19 outbreak and a rise in
unemployment. The ability of companies and SMEs operating in the transportation, services, tourism,
trading, and real estate sectors to service and repay their bank loans will come under the greatest
pressure. Risks in foreign-currency lending have also increased due to the depreciation of the ruble and
disruptions in foreign trade.

Unemployment increased in April 2020. The unemployment rate increased to 5.8 percent in April and 6.1

                                                                                                        8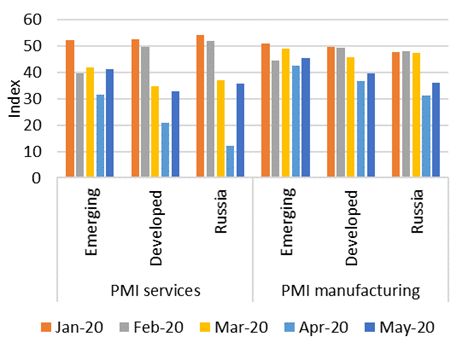
percent in May from 4.7 and 4.5 percent in same months of 2019, respectively. This corresponds to an
increase of 1.1 million people or 33 percent compared to May 2019. The number of registered
unemployed persons increased even more by 1.4 million people or 176 percent and reached 2.3 million
people in May 2020. This is likely to be only some part of the labor market reaction: various forms of
underemployment (part-time work, reduced working hours, unpaid leave) are likely to have increased in
April-May.
The crisis is affecting the well-being of households. Standards of living are being affected in schooling by
the suspension of classes; in health services, by the potential saturation of hospitals, which, combined
with a reluctance of the public to get care for important but non-urgent conditions, is leading to
inadequate care for non-communicable diseases and exacerbation of the existing disease burden; and in
mobility, by containment measures that have drastically reduced public and private transportation.
Those engaged in the retail, tourism, hospitality, and entertainment industries are most affected in the
short run due to lockdown measures and the limited ability to work online. Metropolises and cities, due
to the concentration of these types of activities and of higher population densities, are also more likely
to be most directly affected. Informal workers, who may not qualify for formal benefits, are also more
likely to be exposed to welfare losses. The share of informal employment in Russia is estimated to be
between 15 and 21 percent.
Short-term impacts could be followed by deeper medium/long-term impacts. These could involve non-
recoverable losses such as learning at critical ages, worsening of chronic health conditions, permanent
job and skill losses and small-business bankruptcies. Smaller cities and rural areas may suffer the spread
of the virus several weeks or months later. Sectors not initially affected, like agriculture, could be
affected in later stages if disruptions in internal logistics, international trade, or financial conditions
make resuming full production difficult. And overburdened health services may have to prepare for
future increased demand due to delayed treatments and a possible resurgence of virus infections.
    C. Russia's economic policy response is within its fiscal rule framework
Macro-fiscal stabilization policies and accumulated buffers have allowed the authorities to implement
effective stabilization measures. A floating ruble since 2014 has acted as a shock absorber to external
disruptions. In March 2020, when the ruble experienced strong depreciation pressure from the steep fall
in oil prices and capital outflow from the EMDEs, FX currency sales under the fiscal rule framework
helped to stabilize the foreign exchange market. The CBR sold US$13.2 billion from March to the
beginning of July under the fiscal rule framework. In addition, the CBR established a mechanism for FX
sales when the price of Urals, the Russian oil price benchmark, falls below US$25/bbl. The total amount
of FX currency sold is limited to US$30.4 billion (funds acquired through the sale of Sberbank shares).
The CBR conducts FX sales to compensate for oil, gas, and oil products exporters' revenue fallout. As of
July 4, the CBR had sold US$4.3 billion (around Rub300 billion) in the FX market based on funds acquired
through the sale of Sberbank shares.

The CBR switched to an accommodative monetary policy. The CBR lowered its policy rate from 6.25
percent in February to a record low 4.5 percent in June. It is also implementing additional policy tools
such as special refinancing rates, favorable conditions for specific types of loans, postponing the

                                                                                                          9
introduction of tighter rules, and reducing regulatory and supervisory burdens for financial institutions.
Moreover, the CBR has introduced a Rub500 billion facility to support SMEs lending and has approved
measures to ease liquidity regulations for systemically important financial institutions. The CBR also
announced measures to maintain the availability of insurance services, to support professional
participants in the securities market and the trading and clearing infrastructure, and to support
collective investment market participants. For households affected by the COVID-19 crisis, the CBR
allowed banks and microfinance organizations to restructure their loans, forgo penalties and avoid
foreclosures on collateral.
The Russian government’s package of fiscal support measures of 4 percent of GDP remains within the
fiscal rule. The measures are a combination of additional spending, the provision for guarantees and tax
deferrals, and the reallocation of expenditures (Table O-1). These measures, combined with CBR's
measures, are broadly similar to those in other countries on public health, support for employees, short-
term liquidity, the smooth functioning of financial markets, exchange-rate stability and lending support.
Table O-1: Fiscal measures total 4 percent of GDP
Bln Rub % of GDP
Healthcare and epidemiological measures 246.8 0.3%
Households 665.9 0.7%
incl. self-employed 9.6 0.01%
Large companies & SMEs & Individual Entrepreneurs & NPOs 2,590 2.7%
Regions 373 0.4%
TOTAL 3,876 4.0%
Source: Government of the RF, Ministry of Finance, World Bank staff estimations.
Russia's fiscal and financial support package is relatively small compared to advanced economies, but at
par with benchmark countries. The optimal size of any support package is contingent on the severity of
the outbreak and a country's initial conditions (such as the state of the health sector; commodity
dependence; fiscal and monetary space and degree of informality, to name a few). With these caveats,
Russia's support package in response to the crisis is relatively small and is less front-loaded compared to
other G-20 economies. However, it is at par with countries with similar GDP per capita (Figure O-3).
10Figure O-3: Russia’s support package is low relative to advanced economies but at par with others
(percent of GDP)
Source: IMF, June 2020: Fiscal Monitor Database of Country Fiscal Measures in Response to the COVID-19
Pandemic. https://www.imf.org/en/Topics/imf-and-covid19/Fiscal-Policies-Database-in-Response-to-COVID-19.
Note: Data as of June 12, 2020, except Russia as of June 30, 2020 (WB staff calculations). LHS shows selected
countries with comparable GDP per capita range; RHS shows G-20 economies (apart from Argentina, China,
Mexico, Turkey included on LHS).
Russia has fiscal headroom to further support relief and recovery measures. In terms of government debt
sustainability and external sector debt, Russia favorably compares to other EMDEs. Public debt as a
share of GDP totals about 14 percent, compared to 58 percent average for EMDEs. The ruble bond
market is capped to about Rub23 trillion, of which government bonds were around Rub 9 trillion by end
2019, indicating some room for domestic debt issuance. Given a low external debt (29 percent of GDP
compared to 60 percent EMDE average), borrowing in euros is another option. Finally, tapping into the
NWF could provide some fiscal space in this unique crisis: as of June 1, the NWF’s liquid part is at Rub
8.2 trillion (8.4 percent of GDP). Starting from January 1, 2021, the government announced an increase
in the personal income tax from 13 to 15 percent on incomes above Rub 5 million a year.
Various social protection measures announced by the government, in principle, could compensate for the
increase in crisis-induced poverty. The crisis would have increased the poverty rate from a baseline
projection of 12.0 percent to 14.8 percent in 2020 (based on the projected growth rate of minus 6
percent in 2020). However, a preliminary assessment of social protection mitigation measures
announced thus far, such as changes to child allowances, maternity capital, and social security
contributions to SMEs, finds that such measures can partly compensate for this increase in poverty rate,
bringing it down to 12.2 percent in 2020 (Figure O-4).
These findings need to be interpreted with caution. These estimates are subject to actual
implementation, which will depend on many different factors. For example, the assessment assumes
current take-up rates of unemployment insurance where 25 percent of beneficiaries get the benefit, but
the actual take-up might be different. Child allowances, of which only some are means-tested, tend to
have a better take-up rate. Tax exemptions and subsidies to SMEs are new measures and it is difficult to
11ascertain their take-up rates. If any of these policies have lower take-up rates than expected, because of
administrative or other logistical complications, the poverty rate could end up above the baseline. The
analysis also hypothesizes a contained impact of the crisis on metropolitan areas and large urban
centers, and the spread of the pandemic is somehow controlled and short-lived, with limited ripple
effects on rural areas. Finally, the assessment assumes that GDP would contract by a moderate, baseline
6 percent in 2020 (see Outlook section). A more adverse scenario would yield different results.
Figure O-4: Ex ante, announced government measures could partly contain the crisis-induced increase
in poverty
Poverty impact of COVID-19 and policy responses (a simulation exercise), percent of the population
15
14.8
Change due
to January'2020
social policies
14
Change due to March-June 13.8
anti-pandemic social policies
(assuming partial take-up of child allowances
13.2 and tax-subsiides to SMEs,
but only 25% take-up of unemployment insurance) Change due to current
projections of
12.9 -6.0% GDP growth
13
( with sector
and region
12.6
specific impacts)
12.3
12.2
Change due to initial
2020 projections of
12 12.0
2016 2017 2018 2019 2020
Source: World Bank staff estimations.
Note: The blue line represents official poverty rates. Segmented orange line represents projections based on
RUSMOD model and RLMS-HSE-2018 data.
In the medium-term, a more substantive agenda for social protection reforms is necessary. Russia spends
around 3.2 percent of GDP on social assistance programs, which at face value is double the global
average of 1.6 percent and well above the 2.2 percent average spending in its regional group. However,
the social-assistance system in Russia does not necessarily prioritize the poor. Overall, only 0.4 percent
of GDP is directed to means-tested programs (compared to an 0.5 percent average in the EU, ranging
from 0.1 in Bulgaria to 1.4 percent in the Netherlands). Mitigating the impact of the COVID-19 crisis on
the poor and vulnerable is attainable using the current welfare system but needs strengthening along
two dimensions: (i) its coverage of the poor must be expanded and (ii) its generosity needs to be
increased. Before the crisis, the poor received only 10 percent of social assistance transfers. Even when
covered, they receive insufficient support to move out of poverty. The level of means-tested benefits is
small: a poor person receives on average around one-third of the poverty gap.
D. Outlook: A deep recession looms
With oil prices averaging US$32/bbl in 2020 and the global economy contracting by 5.2 percent, y/y, the
baseline scenario suggests a contraction of Russian GDP by 6.0 percent, an 11-year low, with a moderate
12recovery in 2021-2022. In 2020, overall household consumption is expected to shrink by 4.9 percent, and
gross fixed capital investment by 8 percent. Negative contribution from exports contraction is expected
to weigh on GDP growth the most. Any numerical forecast for the period ahead, however, is subject to
unprecedented levels of uncertainty and assumptions.
If containment measures are fully lifted in the second half of 2020 in the absence of a second wave of
pandemic, as is assumed in the baseline scenario, a moderate recovery could get underway. Some
positive momentum is expected to spill over to 2021, pushing GDP growth into positive territory (2.7
percent) and to 3.1 percent in 2022. As uncertainty diminishes, household consumption is expected to
lead the recovery, and investment is expected to increase by about 3 percent in 2021. From a low base
in 2020, export growth is expected to pick up in 2021 on the back of higher global demand. Even with
positive, projected GDP growth ahead, GDP levels in 2022 would have barely caught up to pre-pandemic
levels (Figure O-5).
Figure O-5: GDP levels in 2022 would have barely caught up to pre-pandemic levels
Source: Rosstat, World Bank staff calculations.
The general government budget is expected to turn to deficit in 2020-2022. With oil prices dropping
below the threshold price of US$42.4/bbl specified in the fiscal rule, general government deficits of 7.2,
1.6 and 0.5 percent of GDP are projected to materialize in 2020-2022. These deficits would be financed
in line with the fiscal rule framework, by the NWF, by proceeds from the Sberbank purchase, by unspent
funds from 2019 and by higher borrowing (at both the federal and regional levels). The NWF is projected
to total about 8 percent of GDP by the end of 2022.
The 12-month CPI inflation is projected to average 3.7 percent in 2020 and to stabilize at the central
bank's target of 4 percent in 2021-2022. With much lower energy exports, the current account balance
is expected to turn negative in 2020-2021. Net capital outflow is expected to stay moderate on the back
of lower profits, a weaker ruble and a higher confidence of investors based on macro stabilization
policies since 2015.
13Risks are firmly tilted to the downside. They include a more protracted pandemic and hence a
prolongation of containment measures, a slow and shallow global economic recovery, a further drop in
commodity prices, and a slower recovery due to lasting impacts on households and firms and
disruptions in global value chains. Pre-existing financial-sector vulnerabilities could be amplified by the
pandemic. In a more adverse scenario, GDP could contract by 9.6 percent in 2020 and recover by a
marginal 0.1 percent in 2021.
E. Special Focus: Education in Russia
Education is a significant contributor to Russia’s human capital. Russia is ranked 34th in the World
Bank’s human capital index, and Russian students rank in the global top 10 in harmonized learning
outcomes (a measure of their performance in different international assessments of mathematics,
reading, and science). Systemic analyses, reforms, and the internationalization of education have helped
Russia become one of the leading countries in education outcomes. Russia both contributes to – and
benefits from – participating in the global education community.
However, there remain systemic issues with 21st-century skills, critical for the future labor force. Russian
students fare poorly in terms of collaborative problem-solving skills relative to their performance in the
traditional or cognitive skills measured by the OECD’s Programme for International Student Assessment
(PISA). That is, they do well in terms of traditional math, science, and reading proficiency, but not as well
in terms of what could be defined as “skills of the future.” The development of such skills is a critical
area for enhancing the Russian education system and can be an effective response to the COVID-19
crisis as it raises personal resilience, efficiency, and the employability of young citizens. Another
systemic issue is wide regional disparities. For example, premiums to education in Russian regions range
from 10.1 percent (Karelia Republic) to 38.2 percent (Altai Republic) at the university level and from 10.4
percent to 20.6 percent at the vocational level.
COVID-19-related school closures could lead to a learning loss of more than one-third of a Russian school
year. If schools remain closed for five months this year, the learning loss of the average student could
reach 16 PISA points in reading (despite current compensatory measures such as online learning and
educational TV). These losses are higher than those estimated for OECD and EU countries. Moreover,
there are distributional issues: while students from the top quintile could lose about 14 PISA points,
those in the bottom quintile could lose 18 points. These 18 points translate into a loss compared with
missing one-half of the year’s learning (Figure O-6). A five-month school closure could reduce marginal
future earnings by about 2.5 percent per year over a student’s working life. Longer closures would have
a larger impact.
14Figure O-6: Potential learning loss in reading in Russia due to COVID-19 (if schools are closed for 5
months)
Source: OECD PISA database, World Bank staff calculations.
Note: Losses are calculated for reading (which is fundamentally correlated with other subjects).
The current response to the COVID-19 crisis could also be an opportunity to tackle structural imbalances
of Russian education and speed up needed reforms:
- The pandemic could widen the achievement gap between socioeconomic groups in Russia.
Programs could be adopted to address this issue. These could include reducing the digital divide
to ensure that all students and teachers benefit from learning platforms, for example, by making
IT equipment more accessible for families and teachers, improving connectivity, and better
support for the development of digital learning materials.
- Regional disparities could be reduced by, in addition to improving connectivity in lagging
regions, ensuring more equitable access to quality learning. Traditional education approaches in
regions could be improved by more diverse teaching and learning practices, stimulating learning
environments in schools, and more extracurricular opportunities for vulnerable students.
- Higher education could be improved starting with a clear national strategy for its
internationalization. This could include identifying areas of specific attention, with universities
attracting more international students. Such an approach is even more needed under the
COVID-19 pandemic when, in the medium-term, competition for international students is likely
to grow significantly. More flexible legislation and a more equitable allocation of funds for
transformative reforms beyond elite universities would also help.
- National programs in education lack rigorous impact evaluations and independent quality
assurance mechanisms. Instilling such evaluation and mechanisms would help reduce disparities
and increase efficiency. They could include specially targeted programs, guidelines (including
coaching programs for teaching staff), collection of best practices, and inter-regional exchanges.
15PART 1. Recent Economic Developments
1.1 Global activity: a sharp recession amid the COVID-19 pandemic
The COVID-19 pandemic has triggered a deep global economic recession. Global activity is expected to
contract 5.2 percent — the largest contraction since World War II — as countries grapple with the
COVID-19 pandemic to varying degrees. Global industrial production suffered its steepest fall since 2008
the global financial crisis in Q1 2020, at -4.4 percent (q/q, saar). Economic indicators point to an even
steeper fall in Q2 2020, reflecting an unprecedented collapse in services and manufacturing amid
lockdown measures. Nearly all countries have imposed stringent measures to stem the virus’s spread —
including travel restrictions, lockdowns, and international border and school closures — that have
generated both supply and demand shocks. The impact has been particularly severe for international
trade due to disruptions in the global value chain and weakened demand. Many emerging market and
developing economies (EMDEs) have experienced capital outflows greater than during the global
financial crisis, as aversion to risk has risen and portfolio investors have moved to safer grounds at an
unparalleled speed.
Crude oil prices have plummeted since the start of the year, dropping 65 percent between January and
April. With incipient tensions in the global oil market already present in early 2020, oil demand collapsed
as a result of the pandemic, and the restrictions needed to stem its spread have severely disrupted
transportation, which accounts for around two-thirds of oil demand. Oil demand is expected to decline
by an unprecedented 8 percent in 2020. However, since April, oil prices have seen a partial recovery, as
countries have started to ease lockdown restrictions, and oil producers have implemented sharp cuts to
production. The price of Brent crude oil averaged US$40/bbl in June, a substantial increase from its April
average of US$23/bbl.
The global economy has fallen into a sharp recession amid the COVID-19 pandemic.1 The pandemic,
which has infected over 7 million people globally, is expected to plunge the global economy into a deep
recession in 2020, with activity contracting 5.2 percent (World Bank 2020). The collapse in services
activity has been unprecedented, reflecting a sharp decline in demand amid associated lockdown
measures and travel restrictions (Figure 1). Manufacturing activity and new export orders, as measured
by the Purchasing Managers’ Index (PMI), have also slid into a deep contraction as global trade suffers
from supply disruptions and weakened demand.
Global trade flows have collapsed due to the fall in demand and to severe disruptions to value chains.
The international goods trade has been deeply affected by the fall in demand, as well as by severe
disruptions to global value chains, particularly in Europe and Asia (Figure 2). Global tourism — an
important source of export receipts for many economies — has also plunged due to the pandemic. Daily
counts of the number of commercial flights were down by more than three-quarters relative to last year
as of early June.
1
World Bank. 2020. Global Economic Prospects, June 2020. Washington, DC: World Bank.
16Figure 1: Global activity has fallen into a Figure 2: The global goods trade has sharply
recession contracted amid supply-chain disruptions and weak
demand
Source: Haver Analytics; World Bank. Source: CPB Netherlands Bureau for Economic Policy
Note: GFC = global financial crisis. PMI readings Analysis; World Bank.
above 50 indicate expansion in economic activity; Note: Data are measured in volumes. Last observation is
readings below 50 indicate contraction. COVID-19 April 2020.
low is April 2020. GFC low calculated over period
2009-19. Last observation is May 2020.
Global financing conditions eased, Figure 3: Global stock markets recovered and borrowing
following large economic policy costs stabilized
responses in major economies. After
worsening at the beginning of 2020,
financial conditions eased in the second
quarter, helped by unprecedented
monetary and fiscal policy responses in
major economies and early signs that the
epidemiological curve in the Euro Area
may be bending. Equity markets
recovered and private borrowing costs,
which had more than doubled since the
beginning of the year across many debt
segments, stabilized (Figure 3). Major
advanced-economy central banks have Source: Bloomberg; J.P. Morgan; World Bank.
been rapidly expanding their balance Note: “EMDE stock markets” is represented by the Emerging
sheets. The Federal Reserve has Markets MSCI Index. "EMDE bond spreads" represented by the
J.P. Morgan Emerging Market Bond Index. Cumulative change
increased support of the corporate debt since the start of the year. Last observation is June 30, 2020.
market and pledged to provide up to
US$2.3 trillion in loans to the economy.
EMDE financing conditions are stabilizing after tightening in the first half of 2020 despite substantial
17policy support. Several large EMDE central banks injected liquidity, including policy rate cuts in Mexico,
Pakistan, Poland, Russia, South Africa, Turkey, and China. Capital flight from EMDEs eased in April,
following record portfolio outflows in March that led to soaring borrowing costs, sharp depreciations,
and pressure on reserve buffers in many countries. This has helped EMDE sovereign bond spreads
retreat somewhat and currencies to firm, although they remain significantly weaker than their levels at
the start of the year, keeping financing conditions tight in a number of economies. Measures announced
by the G20 to suspend debt repayments of low-income countries asking for forbearance until year-end,
as well as a new liquidity line by the IMF that could provide short-term balance-of-payments support for
several EMDEs, have contributed to the tentative stabilization in EMDE financing conditions.
Activity in the Euro Area, Russia’s largest trading partner, also contracted, but tentative signs
emerged that the COVID-19 outbreak is plateauing. The Euro Area GDP contracted at an annualized
rate of 13.6 percent in the first quarter of 2020 — the steepest fall in the bloc’s existence — with several
economies registering record declines. Retail sales and industrial production in the Euro Area both
experienced their largest contraction on record in 2020, falling 11.7 percent and 17.1 percent (April,
m/m), respectively. The weak momentum in sales and production will contribute to what is expected to
be an unprecedented collapse in output during the second quarter, which could fall by nearly 50 percent
(q/q, saar) according to the European Central Bank. Activity is likely to have fallen further in the second
quarter, as the composite PMI collapsed to 13.6 points in April and continued to contract in May and
June, albeit at a less severe pace. New high-frequency mobility indicators developed by Google and
Apple have underscored this weakness, pointing specifically to a deep freeze in consumption activity,
with declines in mobility ranging from a third
to three quarters in large Euro Area countries Figure 4: Google mobility indicators have underscored
under lockdown (Figure 4). The number of the weakness in economic activity
new COVID-19 infections, however, is
showing signs of having peaked in several
member countries after rising rapidly through
March. The falling rate of new infections is
due in large part to the widespread
implementation of stringency measures in
February and March. Several Euro Area
member countries are now beginning to
slowly lift some restrictions, citing substantial
progress in mitigating the outbreak. In
response, mobility indicators around retail
and recreation are gradually improving.
China, Russia’s second-largest trading
partner, has embarked on a fragile recovery Source: Google COVID-19 Community Mobility Reports;
after a major economic contraction. Its GDP World Bank.
Note: Mobility data are the percent change from baseline
fell by 6.8 percent in Q1 2020 — the first over February 15 and June 23 in 2019 and 2020, based on
negative growth reading since quarterly data from Google.
18records began in 1992 (Figure 5). However,
Figure 5: In the first quarter of 2020, economic growth in
incoming data suggest that the output China contracted by 6.8 percent
decline softened somewhat in March, as
falls in industrial production, nominal retail
sales, and imports and exports all
bottomed out. After rebounding in March,
the Caixin manufacturing PMI slipped back
into contractionary territory in April but
has since firmed to 50.7 in May and
strengthened further in June. The PBOC cut
the required reserve ratio for small and
medium-sized banks, further easing
monetary policy to support the recovery.
The State Council has also announced
additional credit support to SMEs
equivalent to 1 percent of GDP. The
available daily activity data in April pointed Source: Haver Analytics, World Bank.
to a continued, gradual, normalization of Note: Figure shows seasonally adjusted nominal retail sales.
Last observation is 2020Q1 for GDP and May 2020 for retail
economic activity, with 84 percent of the sales and industrial production.
country’s small and medium-sized
enterprises (SMEs) having reportedly resumed operation as of April 15. Industrial production resumed
growth in April and further rose in May, to 4.4 percent (y/y), while coal consumption and traffic delays
showed tentative signs of normalizing to historical levels. The recovery remains fragile, however, as air
traffic and tourism remain well below levels observed prior to COVID-19.
Commodity market developments
Almost all commodity prices have seen steep declines since the start of the year. The COVID-19
pandemic has had a major effect on both the demand and supply of commodities through the impact of
containment measures on activity and supply chains. Energy prices have been most affected, particularly
crude oil, while gold prices have risen amid safe-haven flows.
Crude oil prices have plummeted since the start of the year, dropping 65 percent between January
and April. Brent crude oil prices averaged US$23/bbl in April, a multi-decade low (Figure 6). Demand for
oil has collapsed as a result of shutdowns from the COVID-19 pandemic and the severe fall in global
economic activity, with the International Energy Agency projecting that oil demand declined by 18
percent in Q2 2020 (Figure 7). The decline in prices was exacerbated by the breakdown of OPEC+ talks in
early March, and a new production agreement announced on April 12 initially failed to boost prices. In
part reflecting the imbalance between demand and supply, the price of WTI Cushing, the U.S.
benchmark, briefly turned negative in April, although technical factors were also at play. However, oil
prices have since recovered as production cuts have been implemented, and lockdown measures have
started to be lifted in some countries, but they remain more than one-third lower than their January
peak.
19Figure 6: Brent crude oil prices fell to a multi- Figure 7: Demand for oil is expected to decline 18
decade low percent in the second quarter of 2020
Source: Bloomberg, World Bank. Source: IEA, World Bank.
Note: Vertical lines denote January 20, 2020, March Note: Shaded area denotes IEA forecast.
09, 2020 and April 13, 2020. Last observation is June
29, 2020.
Global oil production was slower to fall than
Figure 8: In the United States, the oil rig count
demand. The breakdown of the OPEC+ agreement fell to its lowest level since 2009
in March triggered an end to their existing
production cuts and led to Saudi Arabia announcing
it would increase production in April to 12mb/d.
However, OPEC+ reached a new production
agreement in April that included cuts of 9.7mb/d in
May and June 2020, with Russia and Saudi Arabia
each reducing production to 8.5mb/d, a sharp drop
from existing levels. The group agreed to maintain
these cuts in July, before gradually reducing them
thereafter. Among non-OPEC+ countries, most oil
companies have implemented substantial cuts in
capital expenditure. For example, the rig count in
the United States has fallen by around 70 percent Source: Baker Hughes, World Bank.
since March, reaching an all-time low in June (Figure 8). Increasingly, producers are also announcing cuts
in existing production, including in Canada, Norway, and the United States.
Most non-energy prices have also fallen since the start of the year. Metals prices fell 14 percent
between January and May, led by aluminum (-17 percent), zinc (-16 percent) and lead (-15 percent).
Metals have been heavily affected by slowing demand and the shutdown of key industries, such as the
automobile industry. Prices have seen a modest recovery in June, amid some optimism about the
recovery in China, with copper prices seeing the largest increase, up 10 percent (m/m) in June.
20Disruptions to the supply of metal ores and refined metals arising from containment measures have also
provided some support to metal prices. Among precious metals, gold prices have increased 11 percent
since January, as a result of heightened uncertainty and safe-haven flows, while platinum prices
dropped by almost 20 percent reflecting their heavy use in the production of catalytic converters in the
transportation industry. In general, agricultural commodity prices have seen modest declines since
January, with two exceptions. Natural rubber prices are down almost 20 percent from January,
reflecting their use in the manufacture of tires, while rice prices have risen more than 20 percent on
worsening crop conditions and some trade restrictions.
1.2 Russia: heading towards a recession after relatively robust growth
in the first quarter
The impact of COVID-19 on economic activities in Russia was limited in Q1 2020 and mostly channeled
through a sharp reduction in trade and commodity prices. With the introduction of lockdown measures
at the end of March, Russia slipped into recession hit by domestic supply and demand shocks against a
backdrop of already weak external demand. In April, contraction in the output of five basic sectors 2
totaled 9.9 percent, y/y, which is on par with the contraction of this indicator in 2009, during the global
financial crisis.
The impact of COVID-19 on economic activity in Russia was limited in the first quarter of 2020.
Containment measures, including strict mobility restrictions, were introduced only in the last week of
March, after the number of infected reached 658, most of which were in Moscow (410) (Figure 9). High-
frequency indicators of consumer and investment demand in January-February 2020 pointed to
continued domestic demand growth (Figure 10). As a result, the economy posted relatively robust GDP
growth of 1.6 percent in the first quarter of 2020 (Figure 11). A low base effect from the first quarter of
2019 also supported this robust reading.
Figure 9: The epidemic reached Russia later than the Figure 10: High-frequency indicators of
EU, US, and Asian countries consumer and investment demand suggest
continued growth in January -February
Note: Cases per million inhabitants, seven-day moving Source: Rosstat.
average, China and South Korea on RHS scale.
Source: ECDC, national government announcements, WB
2
Agriculture, industrial production, transportation, construction, and retail trade.
21You can also read