Betting on the Long-Term - REBUILDING INVESTMENT FOR THE EUROPE OF TOMORROW THE LONG-TERM INVESTMENT TASK FORCE OF THE PARIS MARKETPLACE
←
→
Page content transcription
If your browser does not render page correctly, please read the page content below
2018

Betting on the Long-Term
   REBUILDING INVESTMENT FOR THE
   EUROPE OF TOMORROW

THE LONG-TERM INVESTMENT TASK FORCE OF THE PARIS MARKETPLACE
             CHAIRED BY GÉRARD DE LA MARTINIÈRE
             FOREWORD BY JACQUES DE LAROSIÈRE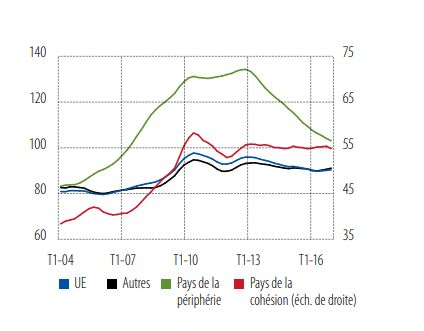
Contents
List of tables ............................................................................................................................................ 3
List of graphs ........................................................................................................................................... 3
Overview ................................................................................................................................................. 4
Foreword ................................................................................................................................................. 5
Introduction ............................................................................................................................................. 9
About the LTI Task Force of the Paris market ...................................................................................... 10
Part 1: Long-term investment in Europe ‒ a persistent weakness.................................................. 11
A.        Investment below pre-crisis levels ................................................................................................ 11
B.        Particularly weak long-term investment in Europe ....................................................................... 14
C.        Even though long-term investment requirements are rising .......................................................... 18
D.        Major obstacles remain inherent to the European market ............................................................. 18
          (1)       Public-sector investment under significant constraints ..................................................... 18
          (2)       Private sector investment limited by debt reduction ......................................................... 19
          (3)       Illiquidity premium crushed in an environment of low interest rates ................................ 20
          (4)       High risk aversion among households ............................................................................... 20
          (5)       An uncertain macroeconomic environment ....................................................................... 20
Conclusion ............................................................................................................................................. 21
Part 2: Inadequate measures failing to support long-term investment .......................................... 22
Introduction ........................................................................................................................................... 22
A.        Measures to support financial stability that ultimately undermine long-term investment ............ 22
     1.      Measures focused on the short term… ...................................................................................... 22
          (1)       Widespread reference to market value .............................................................................. 22
          (2)       Liquidity perceived as protection against risk ................................................................... 25
          (3)       Measured risk managed over the short term ...................................................................... 27
     2.      Other measures penalising long-termism .................................................................................. 27
          (1)       Penalising long-term assets ............................................................................................... 27
          (2)       Penalising the transformation activities of banks .............................................................. 30
          (3)       Penalising research ............................................................................................................ 30
B.        Targeted corrections unable to stimulate LTI in Europe ............................................................... 31
     1.      The Green Paper on long-term financing and the Capital Markets Union (CMU) ................... 31
     2.      European budgetary instruments of a new kind, although yet to fine-tuned ............................. 31
     3.      Amendments made to the main regulations .............................................................................. 32
          (1)       New derogations to support long-term commitments ....................................................... 33
          (2)       Targeting the softening of capital charges ......................................................................... 34
          (3)       New requirements to encourage long-term shareholder engagement................................ 36

                                                                             1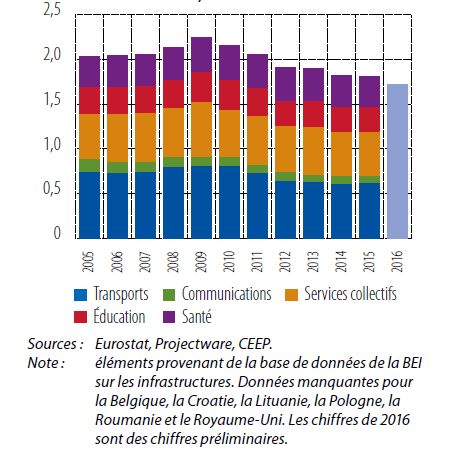
Uncertainty relating to the transposition of Basel III into European standards ............................. 36
Conclusion ............................................................................................................................................. 38
Part 3: A holistic approach to long-term investment ....................................................................... 40
Introduction ........................................................................................................................................... 40
A.        LTI ̶ a 'reversed' definition ........................................................................................................... 40
     1.      It is neither an asset class (even if certain assets are more “long-term friendly” than others)... 40
     2.      ... nor a type of liability (even if stable liabilities are a prerequisite for LTI) ........................... 41
     3.      ... nor a single type of operator – rather a continuum ................................................................ 41
     4.      ... nor an investment horizon in the strictest sense .................................................................... 42
B.        LTI – a bit of all these elements .................................................................................................... 43
C.        A bundle of characteristics ............................................................................................................ 43
     1.      Pillar 1: Long-term asset & liabilities management .................................................................. 44
          (1)       Long-term strategy ............................................................................................................ 44
          (2)       Ability to manage assets consistently with stable liabilities .............................................. 44
          (3)       The resultant investment policy......................................................................................... 44
     2.      Pillar 2: Assessment of long-term risk and return ..................................................................... 45
          (1)       The risks are the classic financial risks, but viewed through a long-term perspective ...... 45
          (2)       The assessment of risks and return must take the management horizon into account ....... 46
          (3)       Assessing risk and return, including the externalities associated with investments .......... 47
     3.      Pillar 3: A measurement of LT value ........................................................................................ 48
Conclusion ............................................................................................................................................. 49
Part 4: Recommendations................................................................................................................... 50
A.        Principle no. 1: Repositioning LTI at the centre of public policies ............................................... 51
     Recommendation no. 1: Incorporate a measurement of LTI within European national accounting
     systems .............................................................................................................................................. 51
     Recommendation no. 2: Ensure that the LTI dimension is taken into account during the
     development of European financial regulations and assess the same regulations in terms of LTI. .. 51
B.        Principle no. 2: Allow for adequate measurement of long-term risk and return ........................... 52
     Recommendation no. 3: enable the accounting system to more accurately reflect the effects of a
     long-term management strategy ........................................................................................................ 52
     Recommendation no. 4: Measure risk in the light of the management horizon ................................ 52
     Recommendation no. 5: Taking account of long-term risks and mitigation strategies ..................... 53
C.        Principle no. 3: Promote long-term asset & liabilities management ............................................. 54
     Recommendation no. 6: Promote stable behaviour by focussing on progressive adjustments ......... 54
     Recommendation no. 7: Propose consumer long-term investment vehicles ..................................... 54
D.        Principle no. 4: Promote alignment of the various operators' interests with long-term objectives 55
     Recommendation no. 8: Promote contract structures favourable to the long term ........................... 55

                                                                              2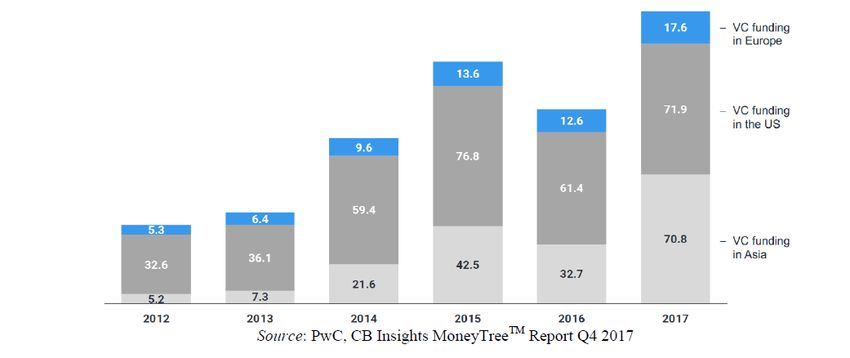
Recommendation no. 9: Promote transparent and long-term securitisation ...................................... 56
   Recommendation no. 10: Promote the principles of good governance in support of LTI ................ 56
   Recommendation no. 11: Enhance the readability of financial information relating to LTI............. 56
   Recommendation no. 12: Reinforce financial literacy and information regarding LTI .................... 57

Bibliography…………………………………………………………………………………………...58
Glossary………………………………………………………………………………………………..64
Contributors……………………………………………………………………………………………66

List of tables
Table 1 Investment amount and estimated gap in social infrastructure .............................................................. 18
Table 2 The new rules imposed by the final Basel III accord of 07/12/2017 ......................................................... 37
Table 3 The main types of risk viewed from a long-term perspective................................................................... 46

List of graphs
Graph 1 Gross fixed capital formation EU28, in % of GDP (current prices) ........................................................... 11
Graph 2 Contribution to GDP growth, EU28 ......................................................................................................... 12
Graph 3 Comparative changes in gross fixed capital formation, annual growth rate (%) .................................... 13
Graph 4 Investment by country groupings, relative change in % as at Q1 2008 .................................................. 13
Graph 5 Infrastructure investment by sector (in % of GDP) .................................................................................. 15
Graph 6 Shareholding among eurozone residents ................................................................................................ 16
Graph 7 Corporate R&D expenditure (in % of GDP) in the EU and other benchmark countries ........................... 16
Graph 8 The phases of private equity ................................................................................................................... 17
Graph 9 Total venture capital financing by continent, in billions of USD .............................................................. 17
Graph 10 Rates of public and private investment, in % of GDP, EU27 .................................................................. 19
Graph 11 Corporate debt vs GDP .......................................................................................................................... 19
Graph 12 Contribution of each institutional sector to investment, in % change vs 2008 ..................................... 20
Graph 13 IFRS9 treatment of fixed income products ............................................................................................ 24
Graph 14 Proportion of equities investments among European insurance companies (excluding unit-linked
portfolios, in market value) ................................................................................................................................... 29
Graph 15 Continuum of operators liable to invest over the long term ................................................................. 42

                                                                                3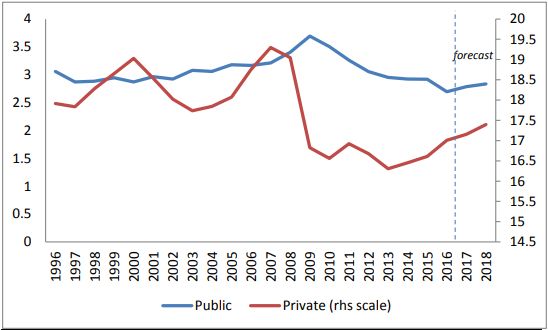
Overview
The European Union (EU) is experiencing a paradox: more than 10 years since the eruption of the
financial crisis, growth has finally returned – on the whole – but investment, and especially long-term
investment, is yet to reach pre-crisis levels. However, the challenges facing the EU require an
unprecedented long-term investment effort. This observation is all the more alarming as the structural
forces holding back long-term investment will undoubtedly persist into the future.

Following the crisis, the priority of reforms was to shore up the financial system to prevent the
emergence of new crises and to promote the return of confidence. At the European level, this priority
given to financial stabilisation has been accompanied by the desire to favour the development of
financing via the market to mitigate intermediated financing that has been perceived to have failed.
Although financial stability is a prerequisite to an upturn in long-term financing, this alone will not
suffice – as demonstrated by the persistent weakness of long-term investment (LTI) in Europe.

It rapidly became clear that the reforms adopted in the name of stability also tended to favour short-
term behaviour and to penalise long-term investment. Given this scenario, targeted measures were
adopted to rectify what was perceived as the undesirable effects of the reforms, yet such 'quick fixes'
were ultimately of limited impact.

The hypothesis we are formulating is that, in the absence of a specific, coherent and comprehensive
approach to long-term investment, the measures implemented have only been patchy and limited, and
sometimes even inappropriate. In order to avoid the same pitfalls when formulating our
recommendations, we are therefore proposing a simple yet robust and comprehensive definition of
what long-term investment means at the essential level.

"Long-term investment is the financial investment strategy deployed by any operator holding
stable resources which at the same time allows for and requires asset allocation able to generate
an economic return over time."

On the basis of this definition, we believe that it is possible to create a favourable regulatory
environment by applying a few simple principles:

Principle no. 1: Reposition LTI at the heart of public policy
Principle no. 2: Enable effective quantification of long-term risks and returns
Principle no. 3: Promote long-term asset & liabilities management
Principle no. 4: Promote the alignment of interests among the various operators around long-term
                objectives

                                                    4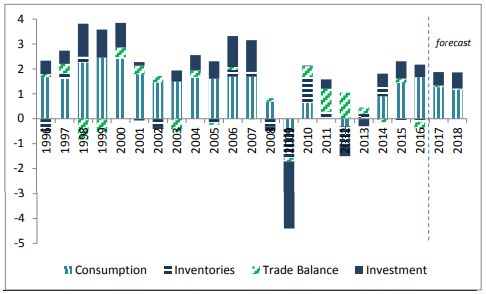
Foreword

The report produced by the Long-Term Investment Task Force led by Gérard de La Martinière sets out
a startling paradox which legislators and regulators have scarcely begun to appreciate.
On the one hand, the report highlights the considerable demand for long-term financing (in
infrastructure, R&D and to face the immense challenges posed by digitisation, energy transition and
the implementation of the circular economy), which, one might think, present an array of attractive
investment opportunities for pension funds, insurance companies and European investment vehicles.
On the other hand, the report also presents statistics that reveal chronic under-investment.
According to figures published by the European Investment Bank, investment in infrastructure lags
some 20% behind pre-crisis levels. The effort in social infrastructure (education, healthcare and social
housing) estimated at around 170 billion euros per year has significantly decreased and lies
significantly below requirements, as stated by the high-level group chaired by Romano Prodi and
Christian Sautter. The R&D effort of European companies is equally weak, and the EIB notes that in
terms of the number of patent submissions, countries in Europe lag behind South Korea, Japan and the
USA. In short, within the context of the digital revolution, the EU is suffering from a deficit of
intangible assets compared to other economies of the world (Thum-Thyssen et al, 2017), whereas
these very assets are crucial for productivity and growth.
However, the difficulties experienced by the financing mechanisms to meet the needs of the economy
have not passed by policy-makers; they are simply struggling to come up with adequate responses.
Preoccupied by the dependency on bank credit, policy-makers in Europe are prioritising the
development of market-led financing mechanisms. The project named Capital Markets Union (CMU)
has the objective of better linking savings with investment throughout the EU and stimulating growth
by providing SMEs (notably) and infrastructure projects with additional sources of financing. The
European action plan of September 2015 incorporated a range of 33 action points and was
supplemented in 2016, including initiatives in the areas of fintechs, sustainable finance and the Pan-
European Personal Pension Product (PEPP). However, only a limited number have already been
adopted.
Furthermore, and although recently softened to favour simple, transparent and standardised (STS)
securitisation, the architecture of Solvency II1 has led European insurance companies to withdraw
from the securitisation market2. Under these conditions, only a few well-equipped operators have been
able to replace it by direct purchase of bank loan portfolios, even though in this form such assets
represent a high level of operational risk, the portfolios are not negotiable and do not benefit from any
of the protection offered by securitisation.
Similarly, it should also be noted that insurance companies have withdrawn from equities investments
to a massive and generalised degree. Their equities portfolios used to account for over 20% of their
assets in Europe. Now this figure is tending towards 10%, a reduction of some 50% in little more than
10 years.
The Capital Market Union therefore does not appear to be leading to any significant progress vis-à-vis
long-term investment, and market finance in Europe still shows itself to be incapable of providing the
required volume of long-term financing.

1Solvency II is European legislation that defines the equity requirements of insurance and reassurance companies.
2Securitisation is a financial mechanism by which banks essentially transfer the long-term financing they have granted,
notably to the real estate sector, in order to be able to finance new demands in the economy.

                                                          5
In the meantime, the traditional methods of financing are clearly being undermined by regulation. The
2017 study of financial structures produced by the European Central Bank reveals that the level of
assets in the eurozone banking sector fell from nearly 400% of GDP in 2008 to just over 250% in
2016... a reduction of around 30%. This deleveraging is the result – to some extent desirable – of
regulation.
Ultimately, it must be said that in spite of the extraordinary efforts taking place to revive economic
activity paralysed by the financial crisis, notably via highly accommodative monetary policies
injecting unprecedented levels of liquidity and significantly lowering the cost of credit to encourage
investment, recovery remains moderate, especially in Europe, and has been accompanied by little
investment. Unlike all other OECD countries, in Europe investment has thus far failed to recapture
pre-crisis levels.
Looking deeper into this paradox and given the reduced effectiveness of the regulatory policies
adopted, we become aware of a contradiction between economic and monetary policies, on the one
hand, and investment, financing and financial risk control policies on the other.
It must, first of all, be stressed that current economic and monetary policies are even more
accommodative than those preceding the subprime crisis and have led to the emergence of risks in the
face of which the financial industry ‒ unquestionably less robust than today ‒ hit the rocks. It therefore
comes as no surprise that the financial industry must once again confront similar dangers: attraction to
inadequately remunerated risk, increase in public and private debt, asset bubbles, reduced
intermediation margins due to persistently low rates, risks associated with unwinding accommodative
monetary policy...
This is why, in spite of unprecedented strengthening of financial institutions’ prudential constraints,
confidence continues to be lacking among investors and supervisory authorities ‒ whose constant
addition of supplementary regulatory mechanisms (capacity to absorb losses, stress testing, continuity
plans…) demonstrate that the economy is still at risk, and not that financial institutions are more
fragile.
The continued rise in such risks combined with the tightening of prudential constraints prevent the
financial sector from achieving levels of performance and resilience similar to those of other sectors in
the economy (profitability, inadequate price/earnings ratios, NPLs, etc.), obstructing them from raising
capital and mechanically reducing their role in the financing of the economy.
We are witnessing an accelerating vicious circle through which creating liquidity hardly benefits long-
term investment and is struggling to generate sustainable growth. Quite to the contrary, it is
accentuating risk and therefore uncertainty, leading to ever-stricter constraints being placed on long-
term financial operators, namely banks and insurance companies, further reducing long-term
investment.
In order to exit the vicious circle, rather than "throwing money at the problem", the overriding priority
should be to structurally reform our economies. This notably means reducing budget deficits,
excessive levels of indebtedness and balance of payment imbalances, the primary threats facing long-
term investors.
At the same time, public policy must enhance the growth potential of European economies as this is a
prerequisite for the ability to absorb existing debt and meet the challenges posed by international
competition. In Europe this notably means reducing the cost of production and stimulating
innovation… while at the same time developing proactive education and training programs designed
to reduce the inequalities so frequently perceived as an inevitable consequence of modernising our
economies.
6Finally, it is necessary to explain and strengthen economic policy in order to systematically reduce
long-term uncertainty. It would be a mistake to await market forces alone to deliver profound change
(energy transition, circular economy, etc.), which require sustained public-sector effort. The
uncertainties associated with such developments can only be attenuated through political power.
Long-term change frequently produces positive externalities that are not necessarily 'monetised', the
benefits of which are not readily accessible to those who are expected to provide the finance. The right
conditions for such long-term change can be provided by public power alone, via the combined effect
of clear and coherent policies with stable incentives and structured information, or by tax policy which
may redistribute, incentivise or dissuade.
For example, only the systematic provision of information on the climatic impact associated with
investments or the strict management of carbon pricing by the public authorities is able to confront the
considerable moral conundrum in which investors, entrepreneurs and project developers seek to
maintain or increase their contribution to tackling environmental threats, to the extent that the cost of
such threats is borne by others or by society as a whole and the risks only materialise over the long
term.
Increasing long-term investment once again also requires the removal of numerous obstacles blocking
the path of investors, notably those resulting from short-term prudential and accounting principles
inspired by market operators' risk analysis approaches.
In general terms, financial institutions' risks are not market risks, even when their assets are acquired
or sold on organised markets. Prudential and accounting standards should rather acknowledge that the
long term does not entail greater risk, but simply presents a different risk profile!
Financial information on balance sheet securities (assets and liabilities) recognised at market value
(mark to market), namely in line with the daily price movements on the markets at the heart of
international standards forged by the IASB, impose unjustified volatility on the stable element of
financial institutions' balance sheets. Such standards should therefore make way for the good sense
and tradition that lead to recognising credits in the accounts at their historical contractual value and
provisioned whenever payment default is anticipated.
It would also be a natural step to properly match the assets and liabilities on the balance sheets of
insurance and pension organisations. Their assets are earmarked for honouring pension rights in 20 to
30 years; by considering them – due to their valuation at market value ‒ isolated from liabilities, and
over a very short-term horizon, accounting and prudential standards are inevitably leading assets being
treated as a distinct entity alone in the interests of stability. And should one or other elements of the
assets appear to be 'high risk' (i.e. the volatility that could occur in the event of the immediate
liquidation of the insurance organisation), the holding of such assets would have to be discouraged by
imposing sufficiently high equity constraints.
This context notably questions the choice in Solvency II of the 'horizon' of one year which leads to
higher calibration of risk (and or regulated equity), whereas insurance companies are very long-term
bodies for which daily market movements are of only limited significance. In practice, the obligation
testing mark-to-market risks of balance sheet assets against unfavourable scenarios to which only
operators in the financial markets are exposed, leads to insurance companies being discouraged from
holding equities and long-term assets. However, such assets are fundamentally well suited to the
nature of long-term commitments made by these institutions and represent a vital contribution to the
sustainable growth of our economies.
7The report issued by the Long-Term Investment Task Force provides an essential contribution by
reiterating the urgency of refocusing our financial system on long-term economic challenges and by
stressing that this is only possible where financial information and the analysis of risk take into
account the specific nature of the risks in relation to their economic models and long-term
investments. The risks are different from short-term market risks, and the continual rising of
regulatory buffers in terms of capital and liquidity is not the appropriate response.
Jacques de Larosière
8Introduction
Why are we publishing a long-term investment report in 2018?
Seven years ago now, following the National Conference on Long Term Financing (Assises nationales
du financement de long terme), this task force bringing together the participants in long-term financing
in France issued its thoughts in an initial report and its conclusions remain still relevant today: long-
term investment (LTI) is crucial for dynamic, inclusive and sustainable growth in Europe, and a
proactive European policy in all aspects of the issue remains an absolute necessity if we are to reverse
persistent economic frailties.
But what has changed over the past seven years is that long-term investment is now a European
priority. As a result of the Green Paper on long-term financing of the economy, the launch of the
Capital Markets Union project and the adoption of the Juncker plan, it occupies a central position
within public policy and is giving rise to numerous initiatives.
Yet it has to be stated that European investment remains sluggish. It has only risen slightly since the
crisis and remains below the considerable demands that our society and economy must meet (climate
change, digital revolution, demographic and migration issues, upgrading of defence capabilities,
developing a knowledge-based society, massive maintenance requirements, renewal and extension of
infrastructure, etc.).
This paradox is the starting point for this report: although long-term investment is an issue currently
recognised as strategic by political and economic decision makers, and while numerous measures have
been taken to support long-term investment in recent years, the LTI deficit is persistent within the EU.
How do we explain this paradox and how can the status quo be changed?
This is the question the task force members have sought to answer on the eve of European elections
when citizens will be called on to select the Europe of tomorrow.
This report seeks to:
- Assess the long-term investment deficit in Europe based on some simple macroeconomic data;
- Inventorise the measures taken and assess them through the lens of long-term investment;
- Present an analysis of what constitutes LTI and propose an operational definition that derives
from this analysis;
- Formulate recommendations – both general in the form of principles and illustrated with
concrete examples applied to existing regulations.
Gaining a better understanding of LTI and radically transforming how it is understood by the
regulatory authorities: this, in our opinion, is an urgent requirement for the European Union.
9About the LTI Task Force of the Paris financial marketplace
Bringing together since 2010 the economic and financial operators of the Paris financial market involved in
long-term investment (professional associations, various organisations, companies and think tanks)3, the LTI
Task Force led by Gérard de la Martinière4 is an informal body for reflection and discussion which has
contributed to the emergence of the LTI issue in France and at the European level.
An initial report produced under Mr de la Martinière was presented at the Assises Nationales du Financement
de Long Terme (National Conference on Long Term Financing) held in Paris on 17 November 2011 and
published by Documentation Française.
Since then the Task Force has been continuing its work on a regular basis, contributing to public consultations
relating to the issue of long-term investment. It has notably worked intensively on the Green Paper of the
European Commission on the long-term financing of the European economy, published in 2013.
This forum for reflection and discussion is novel in two respects: the diversity of its participants (financial
operators, companies and associations) and the variety of subjects covered ‒ both are testament to the richness
of the LTI issue (banking regulation, insurance regulation, infrastructure financing, responsible investment,
etc.).5
This multi-disciplinary working method enables current LTI issues to be placed against a long-term perspective,
and to treat them via a decompartmentalised approach appropriate to the subject matter at hand.
3 Association nationale des sociétés par actions (ANSA), France Invest (ex AFIC), Association Française des Investisseurs
Institutionnels (AF2i), Association Française des Entreprises Privées (AFEP), Association Française de Gestion Financière
(AFG), Bpifrance, Centre des professions financières (CPF), CNP, Confrontations Europe, Covéa, Groupe Caisse des
Dépôts, EUROFI, Fédération Bancaire Française (FBF), Fédération Française de l’Assurance (FFA), Fédération Nationale
des Travaux Publics (FNTP), Forum de l’Investissement Responsable (FIR), Mouvement des Entreprises de France
(MEDEF), Paris Europlace.
4 The list of members is appended to the report.
5 Diversity also characteristic of the European Parliament Intergroup on long-term investment and reindustrialisation.
10Part 1: Long-term investment in Europe ‒
a persistent weakness
The European Union (EU) is experiencing a paradox: more than 10 years since the eruption of the
financial crisis, growth has finally returned – on the whole – but investment, and especially long-term
investment, is yet to reach pre-crisis levels (A). And this observation is especially true regarding long-
term investment – understood, for want of a better alternative, via a sector-based approach (B).
However, the challenges indiscriminately facing the EU – accelerating technological innovation via
the digital revolution, climate change, an ageing population, the inception of the knowledge-based
economy, European security and defence requirements, etc. – demand an unprecedented investment
effort, especially long-term investment (C). This observation is all the more alarming as the
structurally negative forces against long-term investment will undoubtedly persist into the future (D).
A. Investment below pre-crisis levels
In Europe, investment is yet to recapture pre-crisis levels, whether in terms of euros or
percentage of Gross Domestic Product (GDP) (Graph 1). The total amount of public and private
investment (gross fixed capital formation) in the EU stood at 3,100 billion euros in 2017, the
equivalent of 20.1% of European GDP, against 22.4% of GDP in 2007 (Eurostat, 2018a), despite an
annual increase of 3.2% between 2013 and 2017 (EIB, 2017).
Graph 1 Gross fixed capital formation EU28, in % of GDP (current prices)
Source: Eurostat, DG ECFIN
This persistent weakness is an issue of major concern, as investment is one of the drivers of economic
growth (see Box 1). Although European growth has recommenced (2.4% in 2017 and 2.1% estimated
for 2018 according to figures published by the European Commission), the contribution of
investment to growth is lower on average than before the crisis (see Graph 2).
11Graph 2 Contribution to GDP growth, EU28
Source: European Commission, 2017, p. 6
Box 1: Investment and growth
Growth and investment interact through mutual enhancement or impairment (Figure 1);
different effects can be distinguished:
1/ Capacity effect: increased investment translates into higher productive capacity enabling
increased production;
2/ Output effect: growth inversely leads to additional productive capacity requirements, generating
investment.
3/ Income effect: growth generates income distribution which is partly saved. The savings
generated can be converted by the financial system into investment that fuels the engine of growth.
These effects are cumulative – in both an upwards and downwards direction.
Figure 1 : The interactions between investment and growth
Output effect
Transformation
(financial system)
Long-term
Savings Investments growth
Income effect
revenue Capacity
effect
This persistent investment weakness is unique to Europe (Graph 3), as the USA and other OECD
countries excluding Japan have seen a net increase in investment since 2007. Investment levels in the
OECD therefore returned to pre-crisis levels in 2014.
12Graph 3 Comparative changes in gross fixed capital formation, annual growth rate (%)
Source: OECD, 2015, p. 208
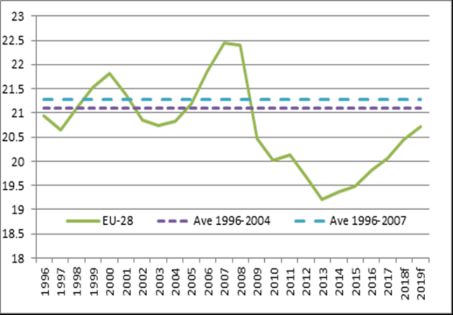
Finally, although this weakness is characteristic of the EU as a whole (according to figures
published by Eurostat in May 2018, investment has fallen in 24 countries out of 28 over the
period 2007-2017), it varies by member state (Graph 4): investment levels in countries on the
European "periphery" are 25% lower than in 2008, whereas investment levels in the "core" countries
are slowly returning to 2008 levels. Overall, therefore, it is the countries experiencing greater
economic difficulties that are also experiencing the greatest investment retardation.
Graph 4 Investment by country groupings, relative change in % as at Q1 2008
Source: EIB, 2016
Note: Gross fixed capital formation. Index: 2008 average = 100.
"Core": Austria, Belgium, Germany, Finland, France, Luxembourg, Netherlands, Sweden and UK.
"Periphery": Cyprus, Greece, Spain, Ireland, Italy, Slovenia and Portugal.
"Cohesion": Bulgaria, Czech Republic, Estonia, Croatia, Hungary, Lithuania, Latvia, Malta, Poland,
Romania and Slovakia.
13B. Particularly weak long-term investment in Europe
National accounting systems only measure investment (gross fixed capital formation), which in 2017
breaks down for the UE28 into 61.8% corporate investment, 13.3% public administration investment
and 24.9% household investment6 (OECD, 2018). It is therefore impossible to directly and simply
measure changes in long-term investment within our economies. Yet to relativise the preceding
observation, it is possible to use sector data on investment and to focus on investment in infrastructure,
R&D and innovation – namely in sectors where investments are made on a long-term horizon.
Generating highly positive externalities, investment in these sectors is crucial for long-term economic
growth (see Box 2).
Box 2: Long-term investment and potential growth
Potential growth (or long-term growth) is the growth an economy may sustainably enjoy by fully
exploiting its capacities without creating inflationary pressure.
Potential growth depends on technological progress (total factor productivity), growth in the labour
input (population growth, development of human capital) and capital growth.
Long-term investment has a major impact on potential growth as it not only increases the quantity of
capital, but also promotes innovation and enhances human capital.
This impact is related to the positive externalities it generates, namely the favourable impact it exerts
on the economy beyond the private return it generates.
Infrastructure investment is 20% down on pre-crisis levels – at 1.8% of GDP (against 2.2% in
2009), according to figures published by the European Investment Bank (EIB) in 2017. The greatest
contraction concerns transport infrastructure and is especially marked in countries with the lowest
infrastructure quality.
6 In national accounting, household investment equates to real estate investment.
14Graph 5 Infrastructure investment by sector (in % of GDP)
Transport Communications Collective services
Education Healthcare
elements from the EIB infrastructure database.
Data missing for Belgium, Croatia, Lithuania,
Poland, Romania and the UK. The 2016 figures
are provisional.
Source: EIB (2017, p. 64)
NB: "Collective services" in the sense of "Utilities" (energy, water networks, etc.)
Investment in social infrastructure (education, healthcare and social housing) has been estimated
at around 170 billion euros per year by the high-level group chaired by Romano Prodi and Christian
Sautter. Largely spent by local authorities, this amount has reduced significantly (local investment in
Europe fell by 12% between 2008 and 2015) and lays far below requirements (Fransen et al, 2018),
while such investment is extremely important to maintain and develop human capital.
Investment by European investors in listed eurozone companies has also been decreasing since
2000, especially since the crisis. Shareholding among eurozone residents fell between 2000 and 2017
(Graph 6): to return to the levels of 2000, shareholding by residents would need to increase by 4,500
billion euros, which would only be possible if investment in shares by natural persons were to
increase, whether directly or via financial intermediaries (BSI, 2018).
15Graph 6 Shareholding among eurozone residents
Source: BSI Economics (2018)
Corporate investment in research and development (R&D) in Europe is structurally low compared
to the levels achieved in other regions (Graph 7). The proportion of investment in R&D in Europe is
lower than in other advanced economies: it accounts for 1% of GDP against 2% in the US and around
3% in Japan and South Korea (Veugelers, 2017). In terms of the number of patent submissions,
European countries also lag behind South Korea, Japan and the US (EIB, 2017).
Graph 7 Corporate R&D expenditure (in % of GDP) in the EU and other benchmark countries
EU USA China Japan South Korea
Source: EIB, 2017, p. 113
Another area of investment vital to the economy is private equity. This is a major source of ongoing
financing for SMEs and unlisted companies (see Graph 8).
16Graph 8 The phases of private equity
CONSOLIDATION
BUYOUT
DEVELOPMENT
GROWTH
INNOVATION PURCHASE OF COMPANIES
CREATION IN DIFFICULTY
VENTURE GROWTH BUYOUT TURNAROUND
CAPITAL CAPITAL CAPITAL CAPITAL
Source: FranceInvest, 2018
Although investment in the private equity cycle has recovered its overall level of 2007, it nevertheless
remains disparate in different European countries and is even low compared to the investment of other
advanced economies of the world. For example, a significant investment deficit exists in venture
capital investment, which is nonetheless crucial to finance start-ups. The amount of venture capital
investment in Europe stood at 17.6 billion dollars in 2017, against 71.9 billion in the US and 70.8
billion in Asia (see Graph 9).
Graph 9 Total venture capital financing by continent, in billions of USD
The EU is therefore suffering from a deficit in intangible assets compared to other economies of
the world (Thum-Thyssen et al, 2017), despite such assets being crucial for productivity and
growth due to the positive externalities they generate (Fournier, 2016).
17C. Even though long-term investment requirements are rising
The EU is facing major challenges requiring a higher long-term investment effort: digitisation,
development of a knowledge-based economy, population aging, climate change, depletion of natural
resources, the challenges relating to migration and geopolitical risks… All of these issues call for
massive investment in high-performance and durable infrastructure and in ambitious research. The rise
of protectionism, the threat of trade wars and the strategic distancing of the US are all currently
increasing pressure on the EU.
To take the example of social infrastructure, the Prodi-Sautter working group (Fransen et al, 2018)
assessed the current financing effort in social infrastructure in the three sub-sectors of education,
healthcare and housing as set against the financing requirements by 2030. It estimates that the
investment effort should equate to a 25% increase in the proportion of GDP already dedicated to such
infrastructure, i.e. an increase of €142 bn in investment per year (€1.5 bn p.a. over the period 2018-
2030).
Table 1 Investment amount and estimated gap in social infrastructure
Investment Estimated gap
Sector
(€bn per annum) (€bn per annum)
Education & continuing
65 15
education (0.43% of GDP)
Healthcare and dependency
75 70
(0.5% of GDP)
Social housing
28 57
(0.4% of GDP)
Total 168 142
Source: Fransen et al, 2018, pp. 40-41
In more general terms, the EU could face secular stagnation, i.e. a prolonged situation of low
growth resulting from a sustained fall in investment, a reduction in the active population and rising
savings (Gimdal et Karakas, 2016). The EU therefore needs to increase growth potential by investing
in areas that offer most growth in total productivity, such as infrastructure and intangible assets
(Aiginger et al, 2015; Gorning and Schiersch, 2014; Rubio et al, 2016; Van Ark, 2015).
D. Major obstacles remain inherent to the European market
(1) Public-sector investment under significant constraints
The level of public-sector investment has markedly reduced in the EU since 2008, especially in
member states that have had to conduct tax adjustment policies (European Commission, 2017a).
Public sector investment as a proportion of GDP has therefore reduced from 3.4% in 2008 to 2.7% in
2016. With average public-sector debt at 81.6% of GDP in 2017 (Eurostat, 2018b), budgetary
consolidation is set to continue. The most indebted European economies are those who have reduced
their infrastructure investment budget the most.
18In this context, an upturn in long-term investment cannot be principally based on the public sector and
on classic programs of budgetary stimulus.
Graph 10 Rates of public and private investment, in % of GDP, EU27
Source: European Commission, 2017, p. 7
Note: Hungary is excluded due to non-availability of data prior to 2001
(2) Private sector investment limited by debt reduction
Ten years after the crisis, companies are still in the process of debt reduction, with debt totalling some
90% of GDP in Europe (see Graph 11). Corporate indebtedness is therefore undermining investment
(ECB, 2016), which partly explains the modesty of the recovery, despite highly accommodative
monetary policies and budget policy – in spite of everything – that is slightly favourable overall.
Corporate lending therefore continues to stagnate, despite the lower cost of borrowing. The debt
reduction obstacle is especially high in the countries of the periphery.
Graph 11 Corporate debt vs GDP
EU Others Periphery Cohesion countries
countries (right scale)
Source: EIB, 2017, p. 233
19(3) Illiquidity premium crushed in an environment of low interest rates
In response to the crisis of 2008, the ECB implemented an accommodative monetary policy by
lowering nominal and real interest rates to historically low levels. This monetary policy enabled the
banking system to survive the crisis and prevented investment from collapsing. However, in the longer
term, as the prospect of a liquidity crisis becomes more distant, it also produces certain ambiguous
effects: the flattening of the rates curve does not encourage investors to place their savings over long
periods – the illiquidity premium (i.e. the remuneration differential relating to assets being tied up for
longer) has ultimately proven to be limited. Such wait-and-see behaviour may be exacerbated by
persistently high levels of uncertainty – both macroeconomic and regulatory.
(4) High risk aversion among households
In terms of contribution to investment, the main reduction comes from households (see Graph 12).
This reduction is not a function of the level of savings as European households save an average of
20% of GDP per year (Demarigny, 2015), but rather of the manner in which such savings are
allocated. In a context perceived to be uncertain, households show themselves to be risk averse
and prefer to build up a savings buffer that is liquid to a great extent. Furthermore, investment by
households is to a large degree real estate investment.
Graph 12 Contribution of each institutional sector to investment, in % change vs 2008
Source: EIB, 2017, p. 26
Editor’s note: For example, in 2016 investment was 6 points lower than in 2008 with a marginally
positive contribution from corporate investment, and a negative contribution of around 4 points from
households’ investment and of 2 points from public sector investment.
(5) An uncertain macroeconomic environment
Finally, although the uncertainty measured as market volatility rapidly returned to normal levels after
the crisis, indicators of 'political' uncertainty ("policy-related economic uncertainty") (Bakeret al,
2016) have remained high in the eurozone. Such uncertainty leads to a wait-and-see approach among
economic operators, translating into a slowdown in growth among the most productive companies and
by a reduction in their long-term investment in favour of lower risk investments aimed at producing
short-term results (Bloom et al, 2014).
20Conclusion
Overall, and as highlighted by the IMF vis-à-vis Europe (2017), economic and political
uncertainty and the persistence of areas of weakness in the balance sheets of certain companies
and financial intermediaries, combined with restricted access to credit, tend to favour
investment in short to medium-term projects offering low yield and risk. Such forces slow down
innovation and delay structural operations; they threaten to sustain a vicious circle of under-
investment, stagnating productivity, downgrading of human capital and consistently low growth.
21Part 2: Inadequate measures failing to support
long-term investment
Introduction
Following the crisis of 2008, the priority of reforms was to shore up the financial system in order to
prevent the occurrence of new crises and to re-establish a climate of confidence7. In Europe, the
stabilisation of the financial system was accompanied by the desire to promote the development of
market financing to mitigate intermediated financing, which was perceived to have failed (Song Shin,
2010).
Although financial stability is a prerequisite to the recovery of long-term investment, it is not
sufficient alone – the persistent weakness of LTI in Europe is testament to this fact. Conversely, the
persistent weakness of LTI is itself likely to negate the measures taken to re-establish financial
stability.
It rapidly became clear that the provisions adopted in the name of financial stability, transparency and
market confidence tended to favour short-termism and penalise long-term investment (A). Given this
observation, targeted measures were adopted to correct what was perceived as the undesirable effects
of the reforms, yet these 'patches' were ultimately only of limited effect (B).
A. Measures to support financial stability that ultimately undermine
long-term investment
1. Measures focused on the short term…
(1) Widespread reference to market value
An initial pillar of the reforms related to the definition of value in international accounting standards.
'Fair value', defined as the "price that would be received to sell an asset or paid to transfer a liability
in an orderly transaction between market participants at the measurement date" (IFRS 13) has become
the reference value in the international accounting approach for financial assets.
In theory, assessment of fair value may be based on multiple valuation techniques, such as the
transaction prices in identical or comparable markets or the discounting of future cash flows. In
practice, the first method is frequently applied and fair value is often reduced to market value alone,
7 For the BIS (2012), the cost of financial instability in terms of growth and prosperity justifies giving priority to reforms that
produce financial stability. According to the World Economic Forum (2012), the crisis highlighted the point to which
financial regulations and risk measures were defective, imposing a cost on society.
22which has become, via semantic shift, the reference accounting measurement, in spite of certain
criticisms of its role in the financial crisis8.
Intended to be applied to all financial instruments and all financial and non-financial companies9, the
IFRS 9 standard was developed by considering fair value through profit or loss to be the default
measurement value, thereby extending the scope of fair value accounting to new financial instruments.
This extension via IFRS 9 of the application of fair value to a larger number of assets has led to
higher volatility of balance sheets and income statements, as a function of market price movements
when the accounts are drawn up.
Several empirical studies have shown that fair value through profit or loss increases the volatility of
the accounting result (Novoa et al, 2009), leading to more volatility of results than the historic cost
method (Barth et al,1995) and to more volatility in the measurement of banks’ results than the
amortised cost method (Bernard et al, 1995).
Fair value accounting has in fact proved to be defective during market volatility and instability by
provoking artificial volatility of equity and long-term assets. Such artificial volatility is caused by
market imperfection and sometimes inappropriate valuation techniques, exacerbated by short-term
fluctuations in estimates within the financial markets (Jaggi, et al, 2010).
In practice, the IFRS 9 standard defines different options depending on the nature of the
instrument and its mode of management.
Regarding fixed income products, the IFRS 9 provides for situations where such products are not
valued at fair value through profit or loss. However, this only applies to 'basic' debt instruments whose
cash flows are solely composed of repayment of the principal and interest on the outstanding principal
(SPPI test: solely payment of principal and interest). Such fixed income products are then measured:
• At amortised cost if the management model is to hold the assets in order to collect their
contractual cash flows (HTC: hold to collect);
• At fair value against other comprehensive income (OCI) if the management model is to
receive both contractual cash flows and the proceeds from sale (HTCS: hold to collect and
sell).
8 Due to the procyclicality that fair value entails and the difficulty of using it in an illiquid market (see Allan and Carletti
(2008) and Gorton (2008)).
9 Banks, companies and investment funds have been under IFRS9 since 1st of January 2018, while insurers have a deadline
until 2021 to implement the amendments to IFRS 17.
23Graph 13 IFRS9 treatment of fixed income products
Category Recognition
Realised/unrealised gains &
No
FV through P&L losses through profit or loss
conditions
résultat
Conditions: Amorised cost
HTC and SPPI
Conditions: FV through Unrealised gains & losses in
reserves recycled through
HTCS and SPPI recyclable OCI profit or loss on disposal
Source: Bachy, 2018
Accordingly, amortised cost accounting is compatible with an LTI model limiting itself to an
investment strategy in certain fixed income products held up to maturity – which does not cover
all of the realities of LTI.
Fair value accounting through OCI consists of recognising the unrealised capital gains or losses
directly in other equity components, and realised capital gains or losses in profit or loss on sale. This
accounting method certainly avoids causing volatility in the income statement while the asset is being
held, yet causes equity volatility (via variations in unrealised profits or losses recognised in other
equity components).
Regarding equity instruments, excluding securities held for transaction purposes (trading), the
investor must choose to recognise them as of the initial recognition date, instrument by instrument and
irrevocably, either in a portfolio measured at fair value through profit or loss, a source of income
volatility, or at fair value through OCI, the variations of which do not affect income but equity without
recognising capital gain or loss on sale (no recycling).
Accordingly, for equity instruments (shares) on the one hand, the use of fair value through profit or
loss produces income volatility that does not reflect the economic reality of long-term
investment, as the asset concerned is not immediately sold. On the other hand, the use of fair value
through OCI does not allow for measurement of the performance of a long-term investment as
the realised capital gains or losses on sale are never recognised in profit and loss, thereby clouding the
performance measurement of such investments.
The impact of market value measurement is all the greater for prudential regulations having
themselves generalised its use within their calculations.
• For example, in force since 2016, Solvency II measures capital requirements according to
assets and liabilities at market value ("market consistent value" or "fair value"). This has
meant a significant change for insurance companies as the majority of them had previously
used other more stable methods to value premiums and provisions recognised in their
accounts, such as historic cost and depreciated or amortised cost, which are now prohibited by
the regulator (KPMG, 2017).
24You can also read