BIS Working Papers No 917 Trade sentiment and the stock market: new evidence based on big data textual analysis of Chinese media
←
→
Page content transcription
If your browser does not render page correctly, please read the page content below

BIS Working Papers
No 917
Trade sentiment and the stock
market: new evidence based
on big data textual analysis of
Chinese media
by Marlene Amstad, Leonardo Gambacorta, Chao He
and Dora Xia

Monetary and Economic Department

January 2021

JEL classification: F13, F14, G15, D80, C45, C55.

Keywords: Stock returns, trade, sentiment, big data,
neural network, machine learning.

BIS Working Papers are written by members of the Monetary and Economic
Department of the Bank for International Settlements, and from time to time by other
economists, and are published by the Bank. The papers are on subjects of topical
interest and are technical in character. The views expressed in them are those of their
authors and not necessarily the views of the BIS.

This publication is available on the BIS website (www.bis.org).

© Bank for International Settlements 2021. All rights reserved. Brief excerpts may be
 reproduced or translated provided the source is stated.

ISSN 1020-0959 (print)
ISSN 1682-7678 (online)

Trade sentiment and the stock market: new evidence
based on big data textual analysis of Chinese media

Marlene Amstad∗, Leonardo Gambacorta♦, Chao He♠ and Dora Xia♣

Abstract

Trade tensions between China and US have played an important role in swinging
global stock markets but effects are difficult to quantify. We develop a novel trade
sentiment index (TSI) based on textual analysis and machine learning applied on a
big data pool that assesses the positive or negative tone of the Chinese media
coverage, and evaluates its capacity to explain the behaviour of 60 global equity
markets. We find the TSI to contribute around 10% of model capacity to explain the
stock price variability from January 2018 to June 2019 in countries that are more
exposed to the China-US value chain. Most of the contribution is given by the tone
extracted from social media (9%), while that obtained from traditional media explains
only a modest part of stock price variability (1%). No equity market benefits from the
China-US trade war, and Asian markets tend to be more negatively affected. In
particular, we find that sectors most affected by tariffs such as information technology
related ones are particularly sensitive to the tone in trade tension.

Keywords: Stock returns, trade, sentiment, big data, neural network, machine learning.
JEL classification: F13, F14, G15, D80, C45, C55.

∗
 Harvard University, Kennedy School, e-mail: marleneamstad@hks.harvard.edu
♦
 Bank for International Settlements and CEPR, e-mail: leonardo.gambacorta@bis.org
♠
 Wisers Information Limited, e-mail: chaohe@wisers.com
♣
 Bank for International Settlements, e-mail: dora.xia@bis.org

The authors would like to thank Richard Bolton, Stijn Claessens, Sebastian Doerr, Jon Frost, Yi Huang, Nikhil
Patel, Lin Peng, Helen Rey and participants at research seminars at BIS, China Center on Contemporary
China and Bendheim Center for Finance at Princeton University and the Geneva International
Macroeconomics and Finance Workshop in Leukerbad for useful comments and suggestions. The paper
was prepared while Marlene Amstad was a professor at the Chinese University of Hong Kong, Shenzhen.
Giulio Cornelli provided excellent research assistance. The opinions expressed in this paper are those of
the authors and do not necessarily reflect those of the Bank for International Settlements or any other
institution the authors are affiliated.

 1
1 Introduction

Trade tensions between China and US have played an important role in
swinging stock markets during 2018-19 (BIS, 2019). However, empirical
evidence that evaluates the impact of these trade tensions on equity
markets is still scant. This paper contributes to the ongoing debate by
using a novel identification approach and introducing a new trade
sentiment index (TSI) analysing the tone regarding trade tension in
Chinese media and examining its capacity to explain the behaviour of
60 global stock markets.
 Our paper contributes to two main strands of literature. The first
one is the literature on trade protectionism that has more recently
analysed trade war tensions applying an event study approach. These
papers analyse the behaviour of the equity market around specific ad-
hoc announcements by both the US and Chinese governments of their
intentions to raise tariffs over a comprehensive lists of goods imported
from each other (Huang et al, 2018; Sun et al, 2019, Ferrari et al, 2020).
Differently to this strand of the literature we do not analyse the effects
of exogenous shifts due to trade tension episodes but rather we try to
quantify the contribution of trade sentiment in explaining equity price
movements. To do this, we take a more prolonged horizon and develop
a daily available index based on textual analysis of Chinese media
over a three-year horizon (2017:01-2019:06), excluding from the
analysis the more recent Covid-19 pandemic period.1
 The paper is also related to the strand of literature that analyses the
role of investor sentiment in financial markets (Da et al, 2014). We differ
in two aspects from previous media news-based studies (Tetlock, 2007),
and the more recently developed Economic Policy Uncertainty (EPU)
index by Baker et al (2013), which extract the sentiment by counting
keywords in traditional media news. First of all, our study uses the
positive or negative tone of the media coverage instead of relying only
on the frequency of media coverage by counting keywords/articles. 2
This allows us to differ between the impact of e.g. “trade war ends”
versus ”trade war intensifies”, which from a purely frequency based

1 In 2020 markets were largely driven by sentiment towards the pandemic. See Amstad et
 al (2020) for example.
2 We differ from others who extract the tone by relying on a lexicon based approach by
 applying a multilayer convolutional neutral network (MC-CNN) to construct a trade
 sentiment index that differentiates between positive (e.g. “trade tension wanes”) and
 negative (e.g. “trade tension intensifies”) tone.

2
approach by counting the keyword “trade war” would be the same.
Additionally, our dataset covers broad types of media outlets including
social media outlets and is not limited to traditional newspapers.
Specifically, our dataset entails 3.5bn articles from 74’020 media
sources. We are able to disentangle the contribution of these different
media outlet in explaining equity market dynamic and find the index
derived from social media to be significant while the index derived from
traditional media is not.
 Using the newly constructed TSI, we perform a comprehensive
analysis of the impact of trade war tensions on 60 global equity
markets. In particular, we show that neither traditional drivers of equity
markets – such as changes in the value of the US dollar, oil prices,
measures of risk aversion – nor monetary policy measures are able to
fully capture the evolution of stock market prices during the trade war
period.
 We find that China-US trade tensions measured by our TSI has a
broad and significant impact on global equity markets. A
corresponding frequency-based index that simply counts relevant
keywords shows not or much less significant results. This represents a
first attempt to show that the use of tone instead than simple frequency
of terms could improve upon the analysis of investors’ sentiment.
Moreover, our paper shows differences between the signals given by
the tone of social media versus those obtained by traditional media,
whose analysis is currently standard in the literature.
 Our results show that in the trade war no equity market wins, but
only loses to varying degree. Looking at the effects across jurisdictions,
we find that the effects of trade tensions are larger in Asia, especially
among the countries playing an important role in the China-US value
chain. 3 Among firms in the US (China), the equity returns of firms with
larger revenue from China (US) are more sensitive to trade sentiment
changes. These effects remain also when controlling for geographical
distance of the jurisdiction to the country where the sentiment is
measured.
 The rest of the paper is organised as follows. Section 2 reviews the
literature on trade protectionism focusing on the current trade tension
between China and US as well as papers that use textual analysis and
different types of sentiment indices. Section 3 describes the data and
the empirical methodology to uncover positive and negative tone in

3
 This is consistent with Ferrari et al (2020) which use a measure of trade tension based on tweets by
 US President Trump and find a limited impact on the US equity markets compared to Chinese ones.

 3
media news. We also compare our TSI to a simpler frequency based
index, as well as to popular economic policy uncertainty indices. In
Section 4, we evaluate the impact of our TSI on daily equity returns on
60 equity markets as well as sector and firm level data for China (A-
shares Shanghai, Shenzhen) and US. The robustness of the results are
checked in several ways: i) the presence of different monetary policy
conditions; ii) the existence of possible non-linearities or asymmetries
in the response of equity prices to TSI changes; iii) and differences in
time zone and trading hours. The last section concludes.

2 Literature review

Our paper contributes to two main strands of literature: the long-
standing discussion on trade protectionism including the recent trade
tension between China and the US and the literature on the role of
sentiment in financial markets, including the new developments in
textual analysis.

2.1 Trade protectionism and recent China-US trade war

The long-standing literature on the limit of trade protectionism starts
with the seminal work of Adam Smith’s (1776) who elaborated on the
benefits of product specialization and free trade. David Ricardo’s (1817)
further reinforced these points, focusing on the costs of tariffs in his
theory of comparative advantage. Until today, these views are shared
among the vast majority of economists, 4 but not necessarily in the
broader public and policy debate (Poole, 2004).
 The debate on the effects of trade protectionism revamped more
recently during the so-called “trade war” between the US and China.
The latter is often seen as starting on March 31, 2017, when the US
president signed executive orders for tighter tariff enforcement in anti-
subsidy and anti-dumping trade cases. Since then the US

4 Indeed, 95% of economists agreed or strongly agreed with the statement “freer trade
 improves productive efficiency and offers consumers better choices, and in the long run
 these gains are much larger than any effects on employment” in the IGM economic expert
 panel conducted on March 13th 2019. See http://www.igmchicago.org/surveys/free-trade
 [accessed in December 2019].

4
administration imposed higher tariffs in other occasions with China
doing the same on US imports. 5
 The macroeconomic impact of the China-US trade war has been
already widely analysed (Berthou et al, 2018; Carstens, 2018; IMF, 2019).
Overall, a 10-percentage point increase in global tariffs is found to
reduce global GDP by around 1% after two years. Indirect effects,
caused by a worsening of capital markets, could amplify these effects
up to 3%. Macroeconomic effects have been shown to be widespread
and not limited to the trade sector. For US consumers and producers,
welfare losses take place mainly because of increase in prices of
intermediate and final goods (Amiti et al., 2019; Fajgelbaum et al.,
2019). There is also evidence that investments diverted from China to
other Asian markets, such as Malaysia, Taiwan and Vietnam, altering
global value chains (Casselman, 2019; Nomura, 2019). The analysis of
equity markets in the fall of 2019 reveals that equity prices of firms
operating in sectors most exposed to trade tensions (such as
automobile, metals, technology and telecommunications, and
transportation sectors) have suffered more than others (BIS, 2019; IMF,
2019).

2.2 Sentiment indices and textual analysis

Our paper contributes also to the literature on how to measure investor
“sentiment” in financial markets, including new developments in textual
analysis. The notion of “sentiment” generally refers to an investor’s
pessimistic or optimistic belief with respect to a rational arbitrageur
(Tetlock, 2007). The literature suggests four different types of indices to
measure investors’ sentiment: market-based, survey-based, search-
based and news or media-based indices (Baker and Wurgler, 2007).
The first type are market-based indices (using eg trading volumes or
option-implied volatility; Borochin and Yang, 2017). While these indices
are easily observable and readily available, they could be conceptually
flawed, being the equilibrium outcome between demand and supply,
rather than reflecting changes in behaviour on the demand side.

5 For detailed and regularly updated timelines of key events see eg Reuters
 (https://www.reuters.com/article/us-usa-trade-china-timeline/timeline-key-dates-in-the-
 us-china-trade-war-idUSKBN1WP23B) or ChinaBriefing (https://www.china-
 briefing.com/news/the-us-china-trade-war-a-timeline/).

 5
The second type of indices are survey-based (eg consumer/investor
confidence indices; Lemmon and Portniaguina, 2006). 6 These measures
could be able to disentangle supply and demand but lack the daily
frequency needed for stock market analysis. Moreover, one potential
disadvantage is the well-documented “survey bias”, caused by the fact
that survey answers might be different from actual behaviour,
particularly for survey topics perceived as delicate.
The third type are search-based indices that provide a possible solution
to the disadvantages of the two measures discussed above, by
leveraging on the availability of new analytical tools like Google
Trends. 7 These indices reveal the attitude directly as the search has no
intermediary between the consumer or investor. A widely popular
indicator of this type is the Financial and Economic Attitude Revealed
by Search (FEARS) index (Da et al, 2014), which aggregates the
frequency of internet search queries of terms such as “recession”,
“bankruptcy” and “unemployment” from millions of U.S. households.
FEARS is shown, for daily data between 2004 and 2011, to predict short-
term equity return reversals, 8 temporary increases in volatility, and
mutual fund flows out of equity funds into bond, funds. One limitation
of these measure is that they cannot measure directly the tone. For
example, “unemployment reduction” is counted in the same way as
“unemployment increase”.
The fourth types are news or media -based sentiment indices exploring
keywords in newspapers. While the analysis of how news influence
stock prices is not novel, 9 the construction of these indices have
become more popular in the recent years because of the increased
accessibility and computation of unstructured big data pools. A
relevant example is Tetlock (2007) that measures the interactions
between the media and the stock market using daily content from the
popular Wall Street Journal column “Abreast of the Market”. In

6 Examples are Michigan Consumer Sentiment index, AAII Sentiment Survey Report of US
 Investor sentiment by the American Association of Individual Investors or UBS/Gallup
 Index of Investor optimism.
7 Google Trends makes, for a given search term, the Search Volume Index (SVI) publicly
 available. SVI represents the history of the volume scaled by the time-series maximum
 (http://www.google.com/trends/).
8 FEARS index is correlated with low returns today but predicts high returns tomorrow, a
 reversal pattern consistent with sentiment induced temporary mispricing.
9 The capital market literature has focused on how stock price returns react to news and
 no-news either of specific companies (Chan, 2003; Vega, 2006) or to macroeconomic news
 (Birz et al, 2011).

6
particular, he finds that high media pessimism predicts downward
pressure on market prices followed by a reversion to fundamentals.
These types of indices have been also used to evaluate the effect of
uncertainty on stock price returns. 10 In particular, Baker et al. (2013)
initiated (and regularly update) a suit of economic policy uncertainty
(EPU) indices. The first one is based on queries on US newspapers and
later on they extended such measure for a range of countries. They are
all based on frequency of keywords, traditional print media and
available on a monthly basis. For China, three EPU versions exist: (a)
China-EPUe, based on English keywords in the South China Morning
Post (Baker et al, 2013); (b) China-EPUc, based on Chinese keywords in
Chinese in the Renmin Daily and the Guangming Daily; (c) the Trade
Policy Uncertainty index (TPU) that runs from January 2000 to present
(for keywords see Table 1). 11 Li et al (2016) find that the association of
EPU and stock returns for China (and India) is quite weak.
 So far, news-based indices have been focusing on the frequency
(also referred as “counts” or “volumes”) of specific keywords. A
disadvantage of this approach is that a simple count does not qualify
the tone (positive or negative) associated with the keyword.
Classification procedures that try to extract the tone have been so far
mainly lexical based, where pre-defined positive or negative lists of
keywords are needed to extract the tone from a text. This proved not
only to be time-consuming but also to be quite inflexible because the
context in which the list is used may differ. Further, in many papers
news outlets were limited to traditional print media, neglecting other
sources which gained in volume and accessibility, like the web, forums
(also called microblogs) and other social media.
 The trade sentiment index we use in this paper, as will be explained
more in detail in the next section, tries to overcome both limitations.
We explore the tone instead of a pure frequency of keywords using
deep learning techniques 12 and our analysis disentangles the

10 Pástor and Veronesi (2013) show in a theoretical model that political uncertainty
 determines a risk premium, makes stocks more volatile and more correlated, especially
 when the economy is weak. Ozogus (2009) investigates empirically the dynamics of
 investors' beliefs and Bayesian uncertainty and finds a negative relationship between the
 level of uncertainty and asset valuations.
11 China-EPUc starts in October 1949, TPU in January 2000 and both measures are regularly
 updated (Davis et al, 2019).
12 Deep learning techniques allow the identification of patterns or the representation of data
 by means of artificial neural networks. The learning can be supervised, semi-supervised or
 unsupervised. In this research, we use supervised deep learning for tone analysis.

 7
information gained from social media versus traditional media such as
newspapers.

3 Trade sentiment index (TSI)

This section describes the construction of our trade sentiment index
(TSI). We discuss in turn the characteristics of the database, the
keywords used and the methodology to extract the tone. As a control,
we also construct a trade count index (TCI) that simply counts the same
keywords as done in the traditional approach. The comparison of the
results obtained using the TSI versus those obtained using the TCI will
help us to shed some light on the existence of a bias, if any.

3.1 Data base characteristics and keywords

The statistical population to construct our TSI is the publicly available
text in all Chinese media, independent of the country or media outlet
where the text is published. Our broader approach in terms of Chinese
media coverage represents a significant novelty because all currently
available indices are calculated on the base of a few traditional print
media (such as newspapers) or a single social media source (e.g. Weibo
or Twitter). Further, we aim for a measure that is available on a daily
basis since the start of the China-US trade tension in 2017 and could
be potentially updated on a regular basis.
 We use Wisers data, a comprehensive and one of the world’s largest
Chinese media database. 13 The raw data set used in this paper consists
of approximately 3.5 bn articles from a broad spectrum of 74,020 media
sources over 2.5 year’s span between 1 January 2017 and 30 June 2019,
equivalent to about 3 million articles per day.
 A broad spectrum of media outlets is covered. The left-hand panel
of Graph 1 presents the data set by publication type. “Traditional
media” from 4,040 newspapers (such as People’s Daily, China Daily,
South China Morning Post, and Hong Kong Economic Times) and
magazines (such as China Newsweek, iMoney, and Wealth Magazine)
account for only 2.6% of the database. “Social media” outlets splits into
three subclasses: (a) “Web” covering media articles from websites such

13 The Wisers full data base consists of approximately 85 billion articles from 570’000 media
 sources, with a daily new volume of around 96 million articles; it does not include sources
 as books, papers, maps, posters and slides.

8
as AASTOCKS.com, Chinese World Net, and Finance Asia alike account
for the largest part with around 50% of the data set. 14 (b) “WeChat”
covering publicly available posts on social APPs represent around 20%
of the articles and (c) “Forum” covering posts on discussion boards and
other microblogs such as Baidu Tieba account for slightly less than 28%.

 Our database is not only broad in terms of media outlet but also in
terms of topics. Only 6,694 or 9% of the total sources directly focus on
finance and economics (such as Hong Kong Economic Journal,
Investment Knowledge, Cmoney). The right-hand panel of Graph 1
shows the data set by region, where 92% of the articles are originated
from publishers in Greater China including 72% from Mainland China
and 9% from Hong Kong and 11% from Taiwan. Among other
countries, 4% of data are from the USA, while the residual 4% comes
from 81 other countries of the rest of the world (Pakistan, India, UAE
and UK sources account for half, around 2%).

 To cover different levels of severity in textual expressions about
trade war, we carefully selected a number of keywords in both Chinese
(simplified and traditional characters) and English (singular and plural
forms) that are to be used for retrieving trade-war-relevant articles
from the raw database. Table 2 shows the keywords in simplified and
traditional Chinese and its English translation.

3.2 Methodology

3.2.1 Tone Analysis

Existing sentiment indices are mostly lexicon based. Those indices are
based on pure frequency (or counts) of subject-matter keywords (e.g.
“trade war”) sometimes additionally combined with keywords reflecting
the tone (eg “intensify”, “end”, etc). However, this methodology entails
the disadvantage that sentences such as “the trade war intensifies”
versus “the trade war is unlikely to intensify” or “the trade war will end
soon” versus “the trade war sees no signs of ending any time soon” are
interpreted as the same, while their underlying tone and therefore
expected impact on financial markets are completely opposite. An
example of this lexicon based approach is Bollen et al (2011) who
identifies the sentiment in stock prices by counting how often
sentiment keywords such as “calm” or “happy” appear in tweets.

14 The web category includes also eCommerce websites such as Taobao and JD.com. In our
 sample, the social media Xiaohongshu was not yet available for the years 2017 and 2018.

 9
A newer class of sentiment analysis uses deep learning techniques to
uncover the “tone” or technically speaking the sentiment polarity (eg
positive, negative or neutral) expressed in a text. In order to evaluate
the sentiment in the sense of positive or negative tone, we use a
standard text classification approach, the Convolutional Neural
Network (CNN) approach in the form of a multi-channel model. This
method allows to capture the semantic context 15 in which the word has
been used to decide in which category the text belongs, instead of
using a predefined library. CNNs belong to the broader class of Neural
Networks developed since the early 1950s and further refined by LeCun
et al (1989, 1998). CNNs initially were used in image classification tasks
such as object detection and face recognition, but have since been
applied to text classification (Kim, 2014; Santos et al, 2014; Zhang et al,
2015) 16 that tags an article with a pre-defined class label, e.g. spam vs
no spam for spam detection and positive vs neutral vs negative for
sentiment analysis. More recently, CNNs for text classification have
been further popularised via fastText (Joulin et al 2016) a software
developed by Facebook's AI Research lab.
Compared to standard text analysis we face an additional challenge
due to specific differences between the Chinese and English language.
Specifically, Chinese knows no alphabet nor word delimiters but instead
has three types of representations as word, as character, or as pinyin
(phonetic romanization). In the methodology, all three representations
are considered, which technically involves the application of a three-
channel-CNN - one channel per representation. Such a technique is
known as Multi-Channel Convolutional Neural Network (MCCNN). See
Appendix A for a discussion of key equations of a MCCNN. 17

15 An intuitive way to describe deep learning methods in the semantic context is to see them
 as imitating what the human brain does with a sentence like the following: “Yuor abiilty
 to exaimne hgiher-lveel fteaures is waht aollws yuo to unedrtsand waht is hpapening in
 tihs snetecne wthiout too mcuh trouble”.
16 The main advantage of CNNs versus other text classification methods is their superior
 performance in extracting effective local features from a sequence of text; and CNNs
 outperform other neural networks such as Recurrent Neural Networks (RNNs) in several
 sentiment analysis tasks. RNNs are computationally much more demanding than CNNs
 particularly when processing large-scale datasets (Kim, 2014; Zhang et al 2015).
17 Liu et al (2018) of Wisers AI Lab illustrate that in the case of Chinese language MCCNNs
 are at least as effective or even outperform (single channel) CNNs as implemented by
 fastText.

10
3.2.2 The construction of the indices

We construct TCI and TSI indices by searching our data set described
in 3.1 for the keywords in Table 2.

In order to control and rationalise the outcome of the neural network
sentiment output, we start with the calculation of a simple count of the
previously defined keywords and articles. The TCI is simply defined as
the sum of all articles with at least one keyword in an article (see
equation (1)) or the sum of all keywords (see equation (2)).

 =
 ∑ , =1

 ( 1 ) (1)

 1,
 with ( ) = � and At being all articles
 0,

where is the series of t daily counts of all article consisting of
at least one of the predefined keywords.

Similarly, is the series of t daily counts of all keyword
occurrences. For example, if the keyword “trade war” appears 3 times
in an article and the keyword “trade tension” appears 5 times in another
article, the total count of these two keywords would be 8.
Mathematically,

 =
 (2)

 ∑ , =1 ( )

In order to uncover the “tone” instead of the simple frequency, we
apply the MCCNN on each article that entails at least one of the
predefined keywords and obtain an estimate for the sentiment polarity
 ( ) as well as the corresponding sentiment score ( ) , with

 1
 ( ) = � 0 (3a)
 −1

and

 ( ) = ℎ ( ) (4a)

Following this approach, we can construct two trade war sentiment
indices that are based on articles. as the t daily sums of the

 11
sentiment polarities over all articles = 1, … , consisting of at least
one of the keywords:

 � , � , (3b)

 = ∑ , =1

 as the t daily sums of the sentiment scores over all articles =
1, … , consisting of at least one of the keywords:

 = ∑ , =1

 � , � , (4b)

During periods when trade tensions were foremost against the
background of a negative sentiment – such as during most of 2018
versus towards mid of 2019 we expect the TSI and TCI to be highly
correlated. It is worth mentioning that results for (1) and (2) on one
hand and (3a,b) and (4a,b) on the other hand are very similar. Table 3
shows indeed that the correlation between the two indices is very high,
and proximate to 1. From here on, we will therefore use only
and (equations (3a,b) and (1)) and refer to them as TSI and TCI,
respectively.

3.3 Trade tone indices and the trend tension timeline

TSI and TCI are shown separately in Graph 2. For ease of comparison
and given the mostly negative tone particularly throughout 2018 TCI
representing the number of counts is multiplied by -1.
 Differences between the TSI and TCI are evident matching local
highs and lows with major events in the China-US trade war timeline. A
list of major events in the China-US trade war is presented graphically
in Graph 3. Given the low keyword counts in 2017 we focus from 2018
until mid-2019.
 The first trough in TSI and TCI coincides with the US president
signing a memo to file a WTO case on March 22 and USA imposing
tariffs of 25% on steel and 10% on Aluminium. On May 20 US Treasury
Secretary Mnuchin announces the end of the trade war, which
translates in low TCI while the TSI increases, entering into the positive
territory. TSI swings back to negative territory to reach three lows that
coincide with lows in the TCI on (1) June 15, when Trump threatens to
further increase tariffs if China retaliates, (2) June 18, when the US
identifies $200bn for add tariffs at 10% and (3) on July 6, when tax on
different products for approximately $34bn worth of import from China
begins. As a follow up to the announcement of additional US tariffs on
$200 bn Chinese products imported, on September 17th and on 18th

12
China announces retaliation. This shows as a local trough in the TCI. TSI
also remains negative, however does not show a visible trough. On Dec
2, 2018 the US and China agree to temporary truce. Again, TSI and TCI
both clearly identify the date but go in opposite direction: the TCI drops
while the TSI increases. This is an example that shows the superiority of
the TSI index with respect to the TCI index.
 Different from 2018, most of the first half of 2019 has seen less
events which can be clearly identified as negative or positive news and
if so, the conflicting news followed each other in a brief window and
therefore were overlapping. Consequently, TSI and TCI move within a
limited range without reaching visible peaks or troughs. Among the few
clearly identifiable events are May 13 when the US increased tariffs
from 10 percent to 25 percent. Showing as trough in TSI and TCI.
Meanwhile, in late May the U.S tariffs on $200 billion began to be
effective and on June 1 China increased tariffs on US$60 billion worth
of products. Both events show as troughs in the inverse TCI, while they
are indicated more positively in the TSI, possibly reflecting expectations
of more pronounced tariffs. At the end of June, trade tension eased
with Trump's tweet on agreeing to talk at G20 meetings. TSI prints
slightly positive while the inverse TCI reaches a moderate local trough.
We conclude that major events in the China-US trade war timeline are
both confirmed in the evolution of TSI and the simpler measurement
of TCI. Despite the similar behaviour of the two indices, the correlation
is, however, not perfect. Table 3 indicates that the correlation between
TSI and TCI is -0.75. Overall, this illustrates the potential need to
differentiate news in the tone and confirms the possibility that the TSI
is more closely connected to the China-US trade war timeline.
 It is also interesting to see if the TSI and the TCI behave similarly to
the Trade Policy Uncertainty (TPU) index developed by Davis et al
(2019). The comparison is shown graphically in Graph 4, while Table 3
reports simple correlations. While, the TSI shows a similar dynamic with
the TPU index in some parts of the sample, the correlation is only -0.13
over the full sample, which is mostly driven by observations in 2019
when the trade tension somewhat eases. The difference can be ascribed
to three factors: i) the different methodology based on sentiment; ii)
the number of sources (larger for the TSI with respect to the TPU); iii)
the type of sources (mostly social media for TSI versus exclusively print
media for TPU). However, the methodology seems to greatly contribute
to the different behaviour. Indeed the TCI based on pure keyword
frequencies but sharing the difference ii) and iii) with the TPU, has a
correlation with of 0.55 with the TPU.

 13
4 Market responses to the TSI

After constructing the trade sentiment index, our first goal is to
evaluate whether and by how much the TSI correlates with global
equity markets. 18 We evaluate the impact on daily equity returns at a
sectorial level as well as at the firm level for the US and China. Then, we
run robustness tests for nonlinearity and asymmetry and extend the
analysis to Hong Kong equities. Finally, we disentangle the impact from
sentiment entailed in social media from sentiment in traditional media.
In each case we employ the model, that regresses t daily log returns for
i market, sector or firm on TSI controlling for changes in oil prices, the
dollar index and a measure of risk aversion. 19

4.1 Impact of the TSI on equity prices at the country level

The baseline model for each country i is given by:
 Δ(log( ))
 Δ(log( ))⎞
Δ(log( )) = + ′ ⎛ + , (5)
 Δ(log( ))
 ⎝ Δ , ⎠

where the dependent variable is the log change of equity market prices
at time t (Δ(log( ))). The explanatory variables include: (i)
the change in the logarithm of oil prices (Δ(log( )), which is
measured as Brent crude oil prices; (ii) the change in the logarithm of
the trade-weighted US dollar index (Δ(log( )); 20(iii) the log
change in the market volatility index VIX (Δ(log( )), which measures
the implied volatility of options on the Standard and Poor’s 500 stock
index; (iv) the country-specific TSI to reflect the attitude (or concern) of
investors about withstanding the trade war shock.

18 A different approach not taken here would be to study exogenous shifts in trade
 sentiment index by running an event study as is done in Huang et al (2018).
19 ADF test for log( ), log( ) and TSI indicate that the series have a unit root
 and therefore we include them in the model in first differences. The log(VIX) is borderline
 stationary and therefore for precaution we also used the first difference of the log(VIX) in
 our baseline specification. However, results are largely robust using the log(VIX) in level
 (see below).
20 We include in the model the change in the trade-weighted US dollar index, which captures
 US dollar shortages – particularly relevant in several emerging market economies (Bruno
 and Shin (2015); Avdjiev, Eren and McGuire (2020)). It is worth noting that all the variables
 are expressed in local currency and therefore isolated from other possible feedback loops
 on returns by shifts in exchange rates.

14
Regression results for the model including all countries are
reported in the first column of Table 4. We use a mean group estimator
that allows us to synthesise the results of country-specific estimates.
When using all 60 markets, including those without strong trade
relations with the US, the changes in the TSI index have not a significant
effect on equity price dynamic. The R2 of the model is 27.4% and the
change in TSI contributes for only 1.4% of equity price variability that
is around 5% of the overall variability explained by the model.
 The lack of significance in the average coefficient for TSI is probably
due to the fact that not all the countries analysed in our study have
strong trade links with US and China and this is reflected in the mean
group estimator for TSI. It is therefore interesting to analyse the impact
of the TSI on each domestic equity market by means of the country
coefficients of regression (5). Graph 5 reports the estimated change in
stock prices in each country from a one standard deviation decrease in
the TSI index. This represents the case of a deterioration in the trade
sentiment.
 The impact of TSI is statistically significant in more than half of the
stock markets we study. 21 This is consistent with the idea that a
worsening in sentiment (Δ ↓) triggers a significant selloff in equity
markets for those countries with trade linkages with US and China.
 Asian equity markets are particularly exposed. As our TSI represents
the tone in Chinese media it is not a surprise that Chinese equity
markets are most affected. A one standard deviation deterioration on
in the trade sentiment index leads to a drop in Shanghai equity prices
by 0.4%. The next eight more affected equity markets are all in the
Asian-Pacific region (Hong Kong, Japan, Taiwan, Korea, Indonesia,
Vietnam, Singapore and Australia). 22 More specifically our results
confirm and expand the 22-March-2018-event-study-based findings
by Sun et al. (2019) for Japan that documents that the impact of the

21 The ranking of countries broadly holds when frequency (TCI) instead of tone (TSI) is used.
 However, the frequency-based TCI is significant only for the Asian countries and about a
 fifth of the covered markets (see Graph B1 in Appendix B).
22
 Interestingly, this list includes also countries that industry reports indicated initially as
 potentially benefiting from a shift in manufacturing and value chains (Nomura, 2019):
 Vietnam and Taiwan (for their electric devices for phones, and parts for office and
 automatic data-processing machines), Malaysia (due to semiconductors and natural gas)
 and Hong Kong (due to its role in gold markets). This report also points out that China as
 the material supplier to most of these named beneficiaries might not necessarily been
 hurt by those shifts. Similar results are found in Casselman (2019) that indicates that
 Chinese investments diverted to other south-east Asian countries.

 15
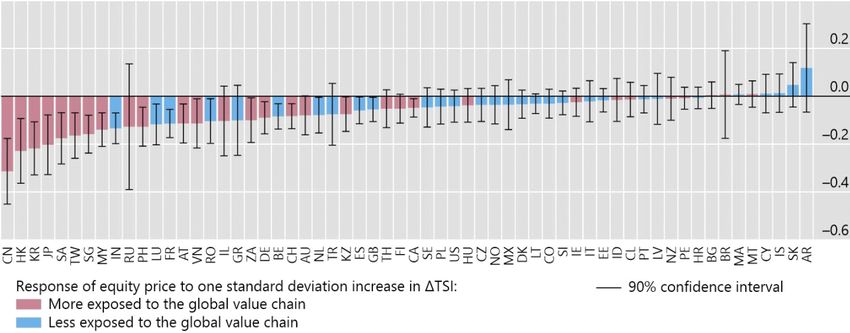
trade war has been felt beyond the two countries that were directly
involved. 23
 Major European markets such as Switzerland, Germany, France and
UK follow at position 22, 24, 26, and 33 respectively. The deterioration
in US market is marginally significantly and only about one sixth of the
magnitude of the Chinese impact (position 34 of 50 markets). In no
country the effect reverts to indicate a significantly positive effect on
the equity market. 24 This first set of results indicate that a worsening of
trade tone produces no winners, only looser to varying degree.

4.1.1 The role of global value chains

In an event study using a three-day window around 22 March 2018,
Huang et al (2018) show that whether a firm will win or lose during
China-US trade war depends on the extent of its participation in the
global value chains shared by the two countries. 25
 Looking into the drivers behind the country ranking in Graph 5 we
can notice that the individual country’s sensitivity is significantly related
to an economy role in the China-US value chain. The latter can be
measured as the value for added to China exports to final demands in
the US (provided by OECD 26) as a percentage of GDP. As reported in
the left hand panel of Graph 6, the more important a country role is in
the China-US value chain the more sensitive its stock market returns

23 Japan is one of the most important trading partners of US and China. Sun et al (2019)
 show using quarterly sales data and stock market returns, that the operations in China of
 Japanese multinational corporations have been negatively affected by the trade war,
 especially when Chinese affiliates rely heavily on trade with North America. This has led to
 a reduction in their stock prices.
24 Equity markets in Argentina, Russia, Estonia, Malta, and Brazil react positively but these
 effects are insignificant at conventional level.
25 Huang et al (2018) show that in the 3-day window centred around the event date, a 10
 percentage points increase in a firm’s share of sales to China is associated with a 0.8%
 lower average cumulative returns, while firms that directly offshore inputs from China have
 a 0.8% lower average cumulative return than those that do not. In addition, the authors
 document that firms that are more exposed to trade experienced higher default risks
 gauged by the growth rate in implied CDS spread over the same 3-day window.
26 See: https://stats.oecd.org/Index.aspx?DataSetCode=TIVA_2018_C4#. “Gross exports by origin of
 value added and final destination, presented here, is derived from the latest version of the
 OECD's Inter-Country Input-Output (ICIO) Database and provides estimates of gross
 exports by industry i in country c, broken down by the value added originating from
 source country/region s and, according to the final demand destination country/region p.
 The indicator FD_EXGR_VA presents gross exports of final and intermediate products by
 industry i in country c, broken down by both the source country/region s origin of value
 added and, according to final demand destination country/region p.”

16
react to a deterioration in the TSI. This negative relationship holds for
almost all markets. Hong Kong and Japan show a higher sensitivity and
Taiwan a slightly lower sensitivity than average. Similar results are
found in Sun et al (2019).
 These findings are confirmed when individual countries’ equity
market sensitivities to the TSI are related to trading relationship with
China (see right panel of Graph 6), 27 but not to trading relationship with
US (not reported). The more a country imports from and export to
China the more its equity market reacts negatively to a deterioration of
the TSI index. Looking at the correlation between the TSI effect on
equity and import plus export with China as a share of a country GDP,
the stock markets of Japan, Korea and Hong Kong show a higher
sensitivity while Vietnam’s equity market seems more resilient.
Moreover, the results reported in Graph 6 are also robust against the
inclusion in the model of measures of geographical distance from
China (See Table B2).
 Column (2) of Table 4 reports the regression results of equation (5)
estimated only for those countries that are more exposed in the China-
US value chain (those with a global value chain indicator above the
median). In this case the TSI index have a strong and significant effect
on equity price dynamic. The change in TSI contributes for 2.6% of the
R2 that is around 10% of the equity price variability explained by the
model. By contrast, the results obtained using the TCI (see the second
column of Table B1 in the Appendix B) indicate a lower contribution,
less than 5%.

4.1.2 Robustness checks

 We checked the robustness of the results in a number of ways.
 First, we included in the regression the log of the VIX rather than its
first log difference (see column (3) of Table 4). The VIX is indeed
borderline stationary and some models include this variable in level
rather than in changes. The results remains very similar but we observe
a reduction in the R2 of the model.
 Second, we considered a model that also includes the change in the
money market rate to control for different monetary policy stances over
time (test conducted for 16 of our 30 countries). The results are
qualitatively very similar (see column (4) of Table 4).

27 HK is removed from trading relationship with China regressions as an outlier.

 17
Third, we tested for the possible existence of non-linear effects in
the response of equity prices to TSI changes. In particular, we test
whether the impact is different for very negative trade tension
developments than for other news. We included in the model a dummy
that takes the value of 1 for episodes in which TSI is above 25 percentile
and zero elsewhere. Results reported in the column (5) of Table 4 do
not indicate significant non-linear effects among the countries.
 Fourth, we test whether the effect of TSI on equity prices is
asymmetric in case of positive and negative changes in the tone. In
particular, we included in the model a dummy variable that takes the
value of 1 in case ∆(TSI)>0 and zero elsewhere. The results indicated no
significant asymmetric effects between positive and negative changes
in the TSI (see column (6) in Table 4).
 Fifth, we find our results to be robust to market differences in time
zone and trading hours. 28 When regressing equation (5) with two day
cumulative returns between t-2 and t instead of t-1 versus t the before
mentioned results still hold but the R2 drops to 13.7% (see column (7)
in Table 4).

4.2 Impact of the TSI on equity prices at the sectoral and firm level

After assessing the impact of the TSI on domestic equity markets, we
explore its impact at the sectoral and at the firm level in China (A-
share 29 in Shanghai, Shenzhen) and the US.
 This test is particularly useful to insulate the effects of the trade
tensions because the tariffs typically target specific sectors and trading
partners. The US motivates tariffs with concerns of market-distorting
government interventions and policies by trading partners such as
technology transfer, subsidies to state-owned enterprises, or even
concerns regarding national security interests. For these reasons,
industry reports often expect that the areas of intellectual property,

28 For countries like US, news in China at time t would impact US equities at time t-1 given
 the 12/13 hr difference.
29 A-share stocks are denominated in Chinese Yuan Renminbi and issued to domestic
 investors (and qualified foreign institutional investors). The other type is B-share stocks
 that are quoted in HK dollars or US and issued to offshore investors. The B-share market
 accounts for below 0.3% of the entire A-share market.

18
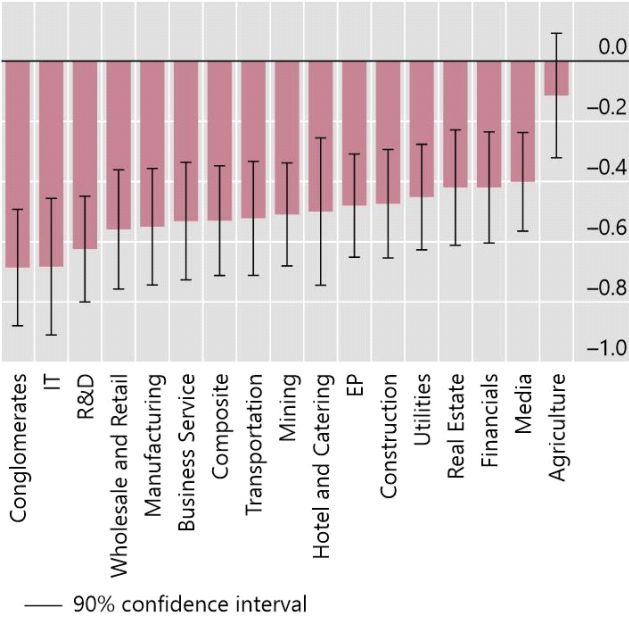
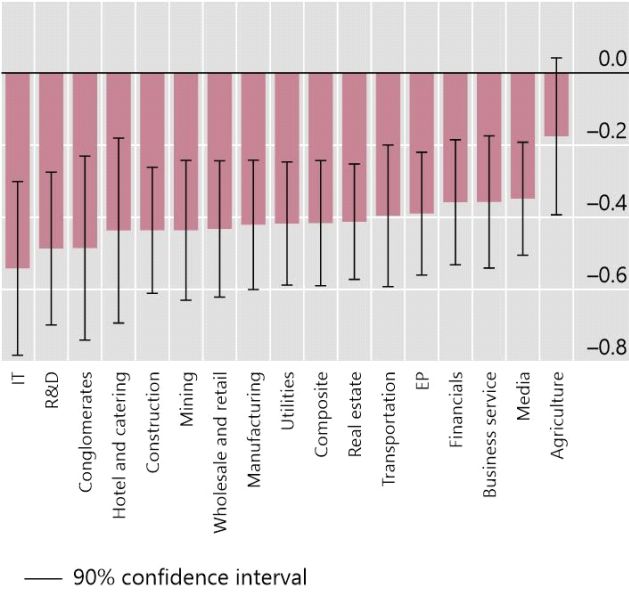
technology transfer, agriculture, financial services should be more
affected than others (JPMorgan, 2019). 30
 Similarly, to the analysis conducted at the country level, we find no
winners: all sectors tend to be negatively affected by the trade tensions,
but to a different degree.

4.2.1 China

Greater China’s equity market is composed of three approximately
equally sized stock exchanges: Shanghai (SSE), Shenzhen (SZSE) and
Hong Kong (HKEX). All together, these three equity markets reach a size
similar to that of Japan and second only to the US equity markets.
The two mainland equity markets (SSE and SZSE) are quite specialised:
Shanghai focuses on big state-owned firms, while Shenzhen includes
more smaller and younger firms. Liquidity in both markets has greatly
improved over past decades, with remarkably high turnover rates (SSE
160%, SZSE 264%) that exceed the ones of the US markets (NYSE 60%,
Nasdaq 116%).
 Using the coefficient estimated from equation (5) at the sectorial
level, Graph 7 reports the effects of a one standard deviation drop of
the TSI on equity prices in mainland China markets. In both SSE and
SZSE, all sectoral equity price evaluations drop following a
deterioration of the TSI, with the exception of agriculture. Results are
similar using the TCI, but the effects are quantitatively smaller, probably
reflecting a reduced precision of the index (see Graph B2 in Appendix
B).
 Despite the differences in types of listed firms in SSE and SZSE
markets, IT related sector are most responsive to a deterioration of the
trade sentiment. In Shanghai telecommunication services and IT stand
out. Those are broadly the sectors most affected by tariffs and this
result is in line with industry reports cited earlier. By contrast, utilities
and financials are the most resilient sectors. In Shenzhen, smaller and
younger firms seem overall more sensitive to trade tensions. Here
conglomerates, IT and R&D are the most sensitive sectors, with real

30 The report specifically points out that: (a) home appliances (vacuums, air conditioners,
 refrigerators, furniture, water heaters, etc.) are an important part in the $200bn basket of
 goods facing additional tariffs since Sep 2018; (b) consumer electronics (such as
 smartphone and laptops) and particularly the Apple supply chain is largely affected; (c)
 property sector, airlines, and some consumer sector suffer under a less stable Chinese
 Yuan Renminbi and possible depreciation due to tariffs.

 19
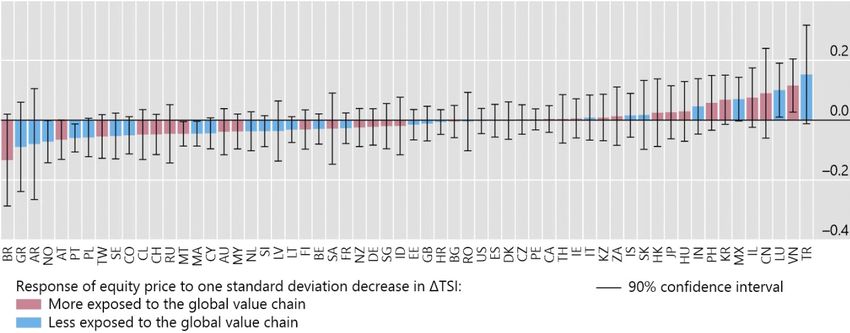
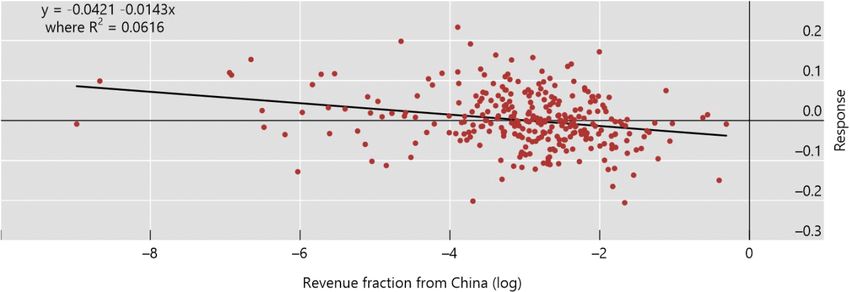
estate, financials, media and before mentioned agriculture the least
sensitive sectors.
 Interestingly, when looking into the drivers behind these sectoral
findings we find that Chinese firms in Shanghai with larger revenue
from the US are more exposed to our trade sentiment index. Using
information provided by Refinitiv, in Graph 8 we show that Chinese
firms with larger revenue from US are those that are more exposed to
a deterioration of the TSI.
 As a final step of the sectorial analysis for China, we also consider
the impact of the TSI on HKEX. As reported in Graph 9, the effect on
firms quoted on the Hong Kong market are similar to those for
mainland China. Most sectors are significantly affected with Software &
services, mainland properties and Internet & IT the most affected.
Meanwhile, Real Investment Estate Trusts (REIT) is the HK sector less
affected by a deterioration in TSI.

4.2.2 United States

For the US we consider the New York Stock Exchange (NYSE) and
National Association of Securities Dealers Automated Quotation
(NASDQ). Market capitalization is the largest in the world with USD 22
trillions for the NYSE and USD 10 trillions for the NASDQ. These equity
markets are widely considered the most liquid in the world.
 Using also in this case the coefficients estimated from equation (5)
at the sectorial level, Graph 11 shows that US equities react by less than
Chinese equities to a (one standard deviation) drop in trade sentiment
in Chinese media. This result could reflect at least in part the fact that
our TSI index is constructed using Chinese media. The US sectors that
lose the most after a worsening of TSI are financials, IT, consumption
discretionary 31 and industrials. Meanwhile, equity prices in the other
sectors do not react significantly to a deterioration of the TSI.
Interestingly, IT emerges as one of the most sensitive affected US
sector, as some big tech firms located in the US were at the center of
the trade tensions. Overall, the pattern that those sectors hit the most
by tariffs are most sensitive to tone is also confirmed in the US market.
 Also in this case, we find heterogeneous effects among firms with
different sources of revenue. Using information provided by Refinitiv,

31 Consumption discretionary are defined as businesses that tend to be the most sensitive
 to economic cycles, including hotels, restaurants, and other leisure facilities, media
 production and service, and consumer retailing and services.

20
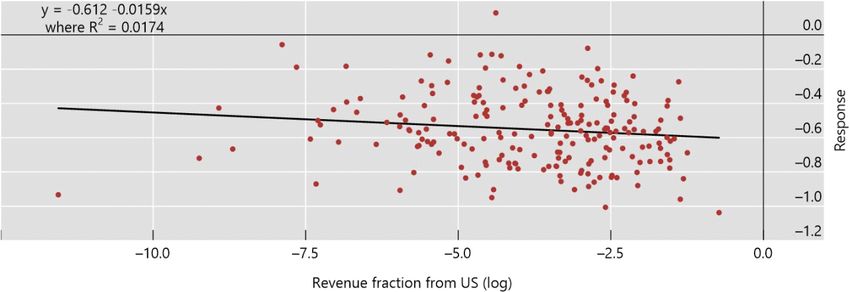
the US firms with larger revenue from China are those that are more
exposed to a deterioration of the Chinese trade sentiment (Graph 12).

4.3 Disentangling TSI effects: traditional media vs social media

So far we have documented that the TSI explains a substantial part of
equity variability, especially for those countries and sectors that are
most exposed to the China-US value chain. This section explores the
difference between a TSI based on articles published in social media
and a TSI based on articles published in traditional media. While others
have analysed sentiment based on social media 32 we are - to our
knowledge - the first to compare the impact on equity prices
disentangling the sentiment derived from social media from that
derived from traditional media in the context of the trade war.
 In order to construct the TSI-social media and the TSI-traditional
media, we apply the same methodology described in section 3.2 to two
different databases: one for social-media, constructed with information
from Web, WeChat and Forum, and another one for traditional-media
only. We report graphically the two new indexes in the left hand panel
of Graph 12. The correlation between the two indexes is not so high
and equal to 50 per cent (see Table 3).
 In Table 5 we rerun equation 5 and reproduce the different columns
for sensitivity analysis replacing TSI with TSI-social-media and TSI-
traditional-media. Interestingly, in all specifications, TSI-social-media is
always significant while TSI-traditional-media is not. Specifically, TSI-
social media contribution to the overall equity variability is very similar
to that of TSI, while the contribution of TSI-traditional media is very
limited. All other results remain the same.
 The country level analysis also confirms the results from the
aggregate analysis. TSI-social-media is significant for roughly the same
third of the markets as TSI composite (Graph 13). Meanwhile TSI-
traditional-media is not significant or barley significant for most of the
countries (Graph 14). Results are robust to including TSI-social-media
and TSI-traditional-media separately instead of jointly in the
specifications of Table 5.

32 Studies have evaluated the impact on equity markets using sentiment indexes derived
 from Twitter (Bollen et al (2011), Yahoo! Finance (Antweiler and Frank (2004), Kim and Kim
 (2014)) or from postings to the investment website SeekingAlpha.com (Chen et al (2014)).

 21
The right-hand panel of Graph 12 reports the TCI-social media and
the TCI-traditional media. In this case the correlation between these
two indexes is 0.83, indicating that when simply counting the frequency
of specific keywords, the differences between the information derived
from social media and traditional media could be more limited.
However, running equation 5 replacing TCI with TCI-social-media and
TCI-traditional-media, the greater contribution of the first index in
explaining equity variability is confirmed (see Table B3 in Appendix B).

5 Conclusions

Trade tensions between China and US have played an important role in
swinging equity markets in the last years. This paper contributes to the
ongoing debate by constructing a trade sentiment index (TSI) using
textual analysis in Chinese and examining how this index explains the
behaviour of 60 global financial markets. With the help of machine
learning techniques we explore the tone (positive vs negative) rather
relying only on the frequency of specific keywords. Further, we employ
a big data approach that covers a broad set of media outlets and allows
us to disentangle the impact from articles published in social media
versus those in traditional media.
 We contribute to the literature in three ways. First, by showing that
the China-US trade war affects capital markets globally and that no
market wins from a worsening sentiment due to an intensification of
the trade war. Those markets with a more important link to the China-
US value chains lose the most. Consequently, Asian markets are most
exposed and show the highest sensitivity to the TSI. At the firm level,
we find that firms in the US (China) with larger revenue from China (US)
are more sensitive to trade sentiment changes. In particular, we find
that sectors most affected by tariffs such as information technology
related sectors are particularly sensitive to tone in trade tension. Taken
together, our results are broadly consistent with theories of investor
sentiment.
 Second, we show that a sentiment index that represents the
positive or negative tone (TSI) explains better equity market variability
than an index that simply counts the frequency of specific keywords
(TCI). Overall the TSI contributes 10% of the model capacity to explain
equity price variability, while the TCI contributes only 5%. This result is
consistent with the weak correlation found by Li et al (2020) between
equity returns and the policy uncertainty index, which is also a simple
frequency indicator based on traditional media outlets.

22
Third, we show that TSI using social media (web, forum, WeChat)
contributes about 9% of the explained model variability, while a TSI
based on traditional media only contributes 1%. This result suggests
caution when using – as it is quite standard in the current literature -
sentiment indices based only on traditional media.

 23
References
Amiti, M, S J Redding, and D Weinstein (2019). "The impact of the 2018 trade war on
us prices and welfare". NBER technical report.
Amstad, M, G Cornelli, L Gambacorta, and D Xia (2020). "Investors’ Risk Attitudes in
the Pandemic and the Stock Market: New Evidence Based on Internet
Searches”. BIS Bulletin 25.
Antweiler W and M Z, Frank (2004). “Is all that talk just noise? The information content
of internet stock message boards”. Journal of Finance, 59(3): 1259–1294.
Baker, M, and J Wurgler. (2006). “Investor sentiment and the cross-section of stock
returns”. Journal of Finance, 1:1645–80.
Baker, M, and J Wurgler (2007). “Investor sentiment in the stock market”. Journal of
Economic Perspectives 21:129–51.
Baker, S, N Bloom, and S Davis (2013). “Measuring economic policy uncertainty”. The
Quarterly Journal of Economics, 131(4).
Baker, S, N Bloom, S J Davis, and X Wang (2013). "Economic Policy Uncertainty in
China," mimeo, University of Chicago.
Berthou A, C Jardet, D Siena and U Szczerbowicz (2018), “Costs and consequences of
a trade war: a structural analysis”, Rue de la Banque 72.
Birz, G and J R Lott (2011). “The effect of macroeconomic news on stock returns: New
evidence from newspaper coverage”. Journal of Banking and Finance, 35(11): 2791-
2800.
BIS (2019). “Markets swing on trade and monetary policy”, BIS Quarterly Review,
September.
Bloom, N, S Bond and J V Reenen (2007). “Uncertainty and investment dynamics”.
Review of Economic Studies, 74: 391–415.
Bollen, J., Mao, H., and Zeng, X.-J. (2011). Twitter Mood Predicts the Stock Market.
Journal of Computational Science, 2(1): 1-8.
Borochin, P and J Yang (2017). “Options, equity risks, and the value of capital structure
adjustments». Journal of Corporate Finance, 42, 150-178.
Carstens, A (2018), “Global market structures and the high price of protectionism”,
speech given at the Federal Reserve Bank of Kansas City’s 42nd Economic Policy
Symposium, Jackson Hole, Wyoming, 25 August.
Casselman, B (2019). “Trade War Starts Changing Manufacturers in Hard-to-Reverse
Ways”, New York Times, 30 May.
Chan, W (2003). “Stock price reaction to news and no-news: drift and reversal after
headlines”. Journal of Financial Economics, 223-260.
Chen, H, P De, Y J Hu, B H Hwang (2014). “Wisdom of crowds: the value of stock
opinions transmitted through social media”. Review of Financial Studies, 27(5): 1367–
1403.
D’Avolio, G (2002). “The Market for Borrowing Stock”. Journal of Financial Economics,
66(2–3): 271–306
Da, Z., J Engelberg and P Gao (2014), “The sum of all FEARS investor sentiment and
asset prices”, The Review of Financial Studies, 28(1): 1-32.

24
You can also read