Blood-brain barrier disruption as a cause of various serum neuron specific enolase cut off values for neurological prognosis in cardiac arrest ...
←
→
Page content transcription
If your browser does not render page correctly, please read the page content below
www.nature.com/scientificreports
OPEN Blood–brain barrier disruption
as a cause of various serum
neuron‑specific enolase cut‑off
values for neurological prognosis
in cardiac arrest patients
Changshin Kang1, Yeonho You1*, Hong Joon Ahn1,2, Jung Soo Park1,2, Wonjoon Jeong1,
Jin Hong Min2,3, Yong Nam In2,3, Insool Yoo1,2, Yongchul Cho1, Seung Ryu1, Jinwoong Lee1 &
Seung Whan Kim1,2
We compared the cut-off and prognostic value of serum neuron-specific enolase (NSE) between
groups with and without severe blood–brain barrier (BBB) disruption to reveal that a cause of various
serum NSE cut-off value for neurological prognosis is severe BBB disruption in out-of-hospital cardiac
arrest (OHCA) patients underwent target temperature management (TTM). This was a prospective,
single-centre study conducted from January 2019 to June 2021. Severe BBB disruption was indicated
using cerebrospinal fluid-serum albumin quotient values > 0.02. The area under the receiver operating
characteristic curve of serum NSE obtained on day 3 of hospitalisation to predict poor outcomes was
used. In patients with poor neurologic outcomes, serum NSE in those with severe BBB disruption was
higher than in those without (P = 0.006). A serum NSE cut-off value of 40.4 μg/L for poor outcomes in
patients without severe BBB disruption had a sensitivity of 41.7% and a specificity of 96.0%, whereas
a cut-off value of 34.6 μg/L in those with severe BBB disruption had a sensitivity of 86.4% and a
specificity of 100.0%. We demonstrated that the cut-off and prognostic value of serum NSE were
heterogeneous, depending on severe BBB disruption in OHCA patients treated with TTM.
Ischaemia–reperfusion cerebral injury after cardiac arrest (CA) is significantly associated with mortality and
poor neurologic prognosis in CA patients1,2. Despite advances in cardiopulmonary resuscitation (CPR) and post-
resuscitation care including target temperature management (TTM)3, a significant number of out-of-hospital
cardiac arrest (OHCA) patients remain unconscious after t reatment4. Because the clinical outcomes of these
patients are associated with long-term hospitalization and financial burdens, early and accurate prognosis for
these patients is important for selecting the most appropriate diagnostic or treatment strategy, considering
withdrawal of life-sustaining therapies in hopeless p atients5,6.
Recent guidelines recommend a multimodal strategy for prognosis in these patients. The absence of brain-
stem reflexes and bilateral absence of cortical somatosensory evoked potentials are the strongest predictors of
poor neurologic outcomes and must be investigated first. The second line modality for predicting neurologic
outcomes includes electroencephalography and imaging techniques. In addition, biomarkers of brain injury,
particularly neuron-specific enolase (NSE) levels, are useful tools for predicting neurologic outcomes and con-
sidering therapeutic strategies. The European Resuscitation Council and European Society of Intensive Care
Medicine Guidelines 2021 recommend a specific NSE cut-off value of 60 μg/L at 48 and/or 72 h after the return
of spontaneous circulation (ROSC) to accurately predict outcomes after CA. However, repeat NSE measurements
are currently recommended as an additional tool for prognostication because of a wide range of NSE cut-off
values7. The reasons for the wide range of NSE cut-off values for early prognostication include measurements at
different timepoints, the high sensitivity of the measurement to blood sample handling and storage conditions
1
Department of Emergency Medicine, Chungnam National University Hospital, 282 Munhwa‑ro, Jung‑gu,
Daejeon 35015, Republic of Korea. 2Department of Emergency Medicine, College of Medicine, Chungnam National
University School of Medicine, Daejeon, Republic of Korea. 3Department of Emergency Medicine, Chungnam
National University Sejong Hospital, Sejong, Republic of Korea. *email: yyo1003@naver.com
Scientific Reports | (2022) 12:2186 | https://doi.org/10.1038/s41598-022-06233-4 1
Vol.:(0123456789)www.nature.com/scientificreports/
(e.g., haemolysis), the type of assay used, differences in the sensitivity for hypoxia, and the presence of extra-
neuronal sources of biomarkers8–12.
Previous studies have reported that NSE is released from damaged neurons into the cerebrospinal fluid
(CSF) and then released into the systemic circulation due to blood–brain barrier (BBB) disruption, and that the
CSF NSE prognostic performance was significantly higher than that of serum NSE at 24 h after ROSC and had
excellent area under the receiver operating characteristic curve (AUROC) values and a high sensitivity at 100%
specificity, although the process of obtaining CSF NSE is i nvasive13–18.
To the best of our knowledge, no studies have evaluated the prognostic value and level of serum NSE in OHCA
patients treated with TTM in relation to severe BBB disruption. We evaluated the heterogeneity of serum NSE
levels and its prognostic value in predicting poor neurologic outcomes between post-OHCA patients treated
with TTM with or without severe BBB disruption.
Methods
This study was approved by the Institutional Review Board of the Chungnam National University Medical Centre
(CNUH IRB 2018-04-051). All procedures and protocols were implemented in accordance with the Declaration
of Helsinki and the International Conference of Harmonization and Good Clinical Practice (ICH GCP); they
were also reported following the CONSORT criteria. Approval and written informed consent were obtained
from the patients’ next-of-kin.
Study design and patients. This was a prospective, single-centre, observational cohort study of patients
who were treated with TTM following OHCA from January 2019 to June 2021. For the primary endpoint, we
compared the prognostic value and serum NSE levels between post-OHCA patients treated with TTM with and
without severe BBB disruption.
Patients’ neurologic statuses were obtained by directly calling the patient’s caregiver 6 months after ROSC. A
cerebral performance category (CPC) of 1–2 demonstrated good neurologic outcomes, while a CPC of 3–5 was
related to poor neurologic outcomes. Resuscitated OHCA patients who underwent TTM and whose Glasgow
Coma Scale (GCS) score was ≤ 8 following ROSC were included in the study. The exclusion criteria for this study
were as follows: (1) < 18 years of age; (2) experienced a traumatic CA or an interrupted TTM (due to haemo-
dynamic instability), (3) ineligibility for TTM (i.e., intracranial haemorrhage, active bleeding, known terminal
illness, or poor pre-arrest neurological status); (4) ineligibility for lumbar puncture (LP) (i.e., brain computed
tomography showed severe cerebral oedema, obliteration of the basal cisterns, occult intracranial mass lesion,
antiplatelet therapy, anticoagulation therapy, or coagulopathy: platelet count < 40 × 103/mL or international nor-
malised ratio > 1.5)19, (5) receiving extracorporeal membrane oxygenation, (6) no next-of-kin to consent to LP,
and (7) refusal of further treatment by the next-of-kin.
TTM protocol. TTM was applied using cooling devices (Arctic S un® Energy Transfer Pads™, Medivance
Corp., Louisville, KY). The target temperature of 33 °C was maintained for 24 h with subsequent rewarming to
37 °C at a rate of 0.25 °C/h, and the temperature was monitored using an oesophageal and bladder temperature
probe. An Anesthetic Depth Monitor for Sedation (Unimedics Co., Ltd., Seoul, Korea) was used to monitor the
anaesthesia depth. Midazolam (0.05 mg/kg intravenous bolus, followed by a titrated intravenous continuous
infusion at a dose between 0.05 and 0.2 mg/kg/h) and cisatracurium (0.15 mg/kg intravenous bolus, followed by
an infusion of up to 0.3 mg/kg/h) were administered for sedation and control of shivering. Electroencephalogra-
phy was performed for patients with persistent deterioration of their level of consciousness, involuntary move-
ments, or seizures. If there was evidence of electrographic seizure or a clinical diagnosis of seizure, anti-epileptic
drugs were administered (levetiracetam: loading dose, 2 g bolus intravenously; maintenance dose, 1 g bolus
twice daily, intravenously). Fluid resuscitation or vasopressors were administered when necessary to maintain a
mean arterial pressure between 85 and 100 mmHg20.
Data collection. As in a previous study17, the following data were collected from the database: age, sex,
presence of a witness at the time of collapse, bystander CPR, first monitored rhythm, aetiology of CA, time from
collapse to CPR (no flow time), time from CPR to ROSC (low flow time), time from ROSC to achieving the tar-
get temperature of 33 °C (induction time), time from ROSC to obtaining intracranial pressure (ICP) via LP (ICP
time), time from ROSC to obtaining blood and CSF via arterial and lumbar catheter (sample time), sequential
organ failure assessment (SOFA), GCS scores after ROSC, and CPC at 6 months after ROSC.
Measurement of albumin quotient and serum NSE. The procedure was performed with the patient
lying in the lateral decubitus position. A lumbar catheter was inserted using a Hermetic™ lumbar accessory kit
(Integra Neurosciences, Plainsboro, NJ) at the level of the lumbar spine between L3 and L4 in patients whose
hips and knees were flexed during the procedure. Blood and CSF were obtained via a radial arterial and lumbar
catheter, respectively, on the third day of hospitalisation. Blood collected from the enrolled patients was centri-
fuged for 10 min at 3000 rpm. The collected serum and CSF were immediately frozen and stored at − 40 °C until
analysis by Green Cross Laboratories (GC Labs) (Yongin, Korea). Serum NSE levels were determined using an
electrochemiluminescence immunoassay kit (COBAS® e801, Roche Diagnostics, Rotkreuz, Switzerland). Ali-
quots with haemolysis exceeding a defined threshold value were discarded automatically. The measurement
range was 0.1–300 μg/L (normal values: < 16.3 μg/L). At GC Labs, the between-run precision at concentrations
of 12.39 and 96.16 μg/L was 1.74% and 1.66%, respectively18. Severe BBB disruption was evaluated using CSF
serum albumin quotient (Qa) values; CSF serum albumin is the gold standard for the functional assessment of
BBB disruption on Day 3 of hospitalisation16. Qa values > 0.02 indicated severe BBB disruption21.
Scientific Reports | (2022) 12:2186 | https://doi.org/10.1038/s41598-022-06233-4 2
Vol:.(1234567890)www.nature.com/scientificreports/
Out of hospital cardiac arrest, n = 487
Non-ROSC, n = 335
Sustained ROSC, n = 152
< 18 years, n = 5
GCS >8 after ROSC, n = 24
Trauma, n = 6
Brain haemorrhage, n = 10
Receiving ECMO, n = 12
Refuse further treatment, n = 10
Coagulopathy, n = 4
Antiplatelet therapy , n = 7
Terminal illness, n = 8
Enrolled patients, n = 66
Without severe BBB disruption, n = 38 With severe BBB disruption, n = 28
Figure 1. Flowchart of the study (ROSC: return of spontaneous circulation; GCS: Glasgow Coma Scale; ECMO:
extracorporeal membrane oxygenation; BBB: blood–brain barrier).
Sample size. In a previous study22, the range of AUROCs predicting poor neurologic outcomes using serum
NSE was 0.77–0.97 in CA patients with TTM, and 11–57 patients were required to achieve a power level of 0.90
at a significance level of 0.05 (two-sided test).
Statistical analysis. Continuous variables were reported as medians with interquartile ranges or means
and standard deviations, depending on normal distribution. Categorical variables were reported as frequencies
and percentages. Comparisons between the two groups were made using the chi-squared test, Fisher’s exact test,
the Mann–Whitney U test, or the two-tailed t-test. The AUROC was used to identify cut-off values of serum NSE
in patients with and without severe BBB disruption for predicting neurologic outcomes. The correlation between
Qa, serum, and CSF NSE was analysed using Kendall tau. All statistical analyses were performed using PASW/
SPSS software, version 18 (IBM, Armonk, NY) and MedCalc 15.2.2 (MedCalc software, Mariakerke, Belgium).
Results were considered statistically significant at P < 0.05 (two-tailed).
Results
Characteristics of study subjects. Of 152 post-OHCA patients in whom ROSC was recorded, 66 patients
were enrolled in the study (Fig. 1). Serum and CSF samples were obtained 53–57 h after ROSC on day 3 after
ROSC. Twelve patients underwent delayed percutaneous coronary intervention to evaluate acute myocardial
infarction as the cause of OHCA after TTM in this study. No complications related to the lumbar drainage
catheter, including bleeding, infection, or brain herniation, occurred in the enrolled patients. There were no sig-
nificant differences between patients with and without severe BBB disruption in terms of mean age, sex, witness,
bystander CPR, causes of collapse, GCS, induction time, no flow time, ICP time, sample time, or SOFA scores
(Table 1). Of the 66 enrolled patients, 27 (40.9%), 4 (6.1%), 0 (0.0%), 22 (33.3%), and 13 (19.7%) had a CPC of 1,
2, 3, 4, and 5, respectively. Fourteen patients (21.2%) had a CPC of 5 with conservative management after TTM
was completed in this study. Of these, one patient died through the withdrawal of life-sustaining therapies, eight
patients died after organ donation, and five patients died of pneumonia.
Comparison of serum NSE levels between groups with and without severe BBB disruption. In
patients with good neurologic outcomes, there were no significant differences in serum NSE levels between
patients with and without severe BBB disruption. In patients with poor neurologic outcomes, serum NSE levels
Scientific Reports | (2022) 12:2186 | https://doi.org/10.1038/s41598-022-06233-4 3
Vol.:(0123456789)www.nature.com/scientificreports/
Without severe BBB With severe BBB disruption
Characteristics Total (n = 66) disruption (n = 38) (n = 28) P value
Age (years) 54.05 ± 17.16 50.82 ± 17.88 58.43 ± 15.37 0.08
Male 50 (75.8) 32 (84.2) 18 (64.3)
Sex, n (%) 0.06
Female 16 (24.2) 6 (15.8) 10 (35.7)
Yes 44 (66.7) 23 (60.5) 21 (75.0)
Witness, n (%) 0.22
No 22 (33.3) 15 (39.5) 7 (25.0)
Yes 46 (69.7) 30 (78.9) 16 (57.1)
Bystander CPR, n (%) 0.06
No 20 (30.3) 8 (21.1) 12 (42.9)
Asystole 24 (36.4) 10 (26.3) 14 (50.0)
PEA 23 (34.8) 12 (31.6) 11 (39.3)
Initial rhythm, n (%) VF 17 (25.8) 14 (36.8) 3 (10.7) 0.04
Pulseless VT 0 (0.0) 0 (0.0) 0 (0.0)
Unknown 2 (3.0) 2 (5.3) 0 (0.0)
Hypoxia 39 (59.1) 22 (59.5) 17 (60.7)
MI 12 (18.2) 6 (16.2) 6 (21.4)
Causes, n (%) 0.91
Arrhythmia 11 (16.7) 7 (18.9) 4 (14.3)
Unknown 4 (6.0) 3 (7.9) 1 (3.6)
3 52 (78.8) 25 (65.8) 27 (96.4)
4 4 (6.1) 4 (10.5) 0 (0.0)
5 3 (4.5) 3 (7.9) 0 (0.0)
GCS, n (%) 0.07
6 3 (4.5) 2 (5.3) 1 (3.6)
7 2 (3.0) 2 (5.3) 0 (0.0)
8 2 (3.0) 2 (5.3) 0 (0.0)
Good 31 (47.0) 25 (65.8) 6 (21.4) < 0.001
Neurologic outcome
Poor 35 (53.0) 13 (34.2) 22 (78.6)
Induction time (h) 6.37 ± 2.91 6.20 ± 2.63 6.59 ± 3.27 0.60
No flow time (min) 2.00 (0.00, 11.50) 1.00 (0.00, 16.00) 3.50 (0.25, 10.75) 0.38
Low flow time (min) 18.00 (8.50, 28.50) 15.00 (7.00, 23.00) 25.50 (10.25, 39.00) 0.01
ICP time (h) 4.50 (3.22, 6.50) 4.43 (3.17, 6.00) 4.59 (3.23, 6.05) 0.86
Sample time (h) 55.00 (53.00, 57.00) 55.00 (53.00, 57.00) 54.00 (52.25, 56.00) 0.13
SOFA score 12.00 (10.00, 13.00) 11.00 (9.75, 13.00) 12.00 (10.25, 12.75) 0.59
Albumin quotient 0.015 (0.007, 0.031) 0.007 (0.006, 0.012) 0.054 (0.026, 0.156) < 0.001
Table 1. General characteristics. Continuous variables are expressed as mean ± standard deviation or median
(interquartile range) depending on the normal distribution. BBB, blood brain barrier; CPR, cardiopulmonary
resuscitation; MI, myocardial infarction; GCS, Glasgow Coma Scale; ICP, intracranial pressure; SOFA,
sequential organ failure assessment; PEA, pulseless electrical activity; VF, ventricular fibrillation, VT,
ventricular tachycardia.
Total Non-severe BBB disruption Severe BBB disruption P value
CSF NSE (μg/L)
Good outcome 22.30 (11.30, 59.90) 22.30 (11.15, 53.10) 20.40 (10.44, 154.25) 0.94
Poor outcome 300.00 (300.00, 300.00) 300.00 (300.00, 300.00) 300.00 (298.23, 300.00) 0.83
Serum NSE (μg/L)
Good outcome 22.40 (15.70, 25.00) 22.40 (15.65, 24.95) 22.55 (17.88, 34.53) 0.58
Poor outcome 91.95 (24.55, 216.00) 26.35 (20.30, 84.13) 127.00 (54.65, 300.00) 0.006
Table 2. Comparison of serum neuron-specific enolase between groups with and without severe blood–brain
barrier disruption. Continuous variables are expressed as median (interquartile range) depending on the
normal distribution. NSE, neuron-specific enolase; BBB, blood–brain barrier; CSF, cerebrospinal fluid.
were higher in those with severe BBB disruption than in those without, although there were no significant dif-
ferences in CSF NSE levels between groups (Table 2).
Prognostic value of serum NSE in predicting poor neurologic outcomes in patients with and
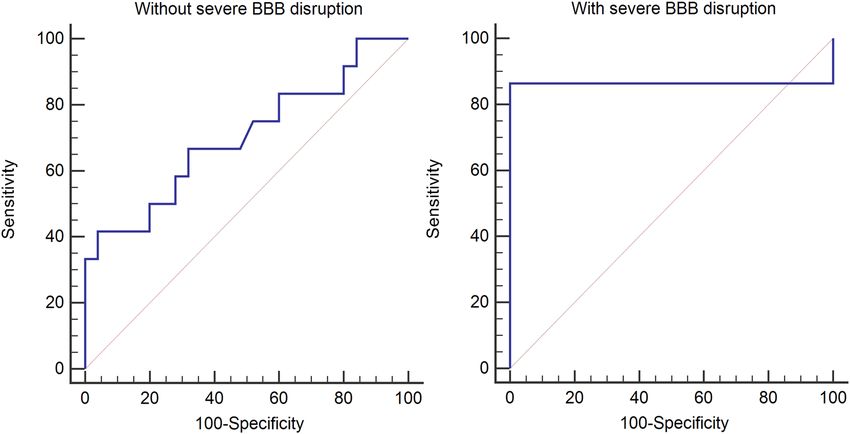
without severe BBB disruption. The AUROC of serum NSE in the group with severe BBB disruption
was 0.86, whereas that of serum NSE in the group without severe BBB disruption was 0.70. A serum NSE cut-
Scientific Reports | (2022) 12:2186 | https://doi.org/10.1038/s41598-022-06233-4 4
Vol:.(1234567890)www.nature.com/scientificreports/
Figure 2. Receiver operating characteristic curves for prediction of poor neurologic outcomes using serum
NSE. In the group with severe BBB disruption, the area under the receiver operating characteristic curve for
serum NSE showed a better performance than that in the group without severe BBB disruption. (NSE: neuron-
specific enolase; BBB: blood brain barrier).
off value of 40.4 μg/L in the group without severe BBB disruption had a sensitivity of 41.7% and a specificity of
96.0%, whereas a cut-off value of 34.6 μg/L in the group with severe BBB disruption had a sensitivity of 86.4%
and a specificity of 100.0% (Fig. 2).
Correlation of serum NSE, CSF NSE, and Qa in patients with and without severe BBB disrup‑
tion. Overall, there were medium or large positive correlations between Qa and serum NSE, Qa and CSF
NSE, serum and CSF NSE. In the group without severe BBB disruption, there were no statistically significant
correlations between serum and CSF NSE, and Qa and serum NSE; however, the correlation between Qa and
CSF NSE was significant. Meanwhile, in the group with severe BBB disruption, there were large positive correla-
tions between Qa and serum NSE, Qa and CSF NSE, serum and CSF NSE (Fig. 3).
Discussion
The major result of this study was the observation that the association of serum NSE with neurologic outcomes
differed significantly, depending on severe BBB disruption. In patients with poor neurologic outcomes, serum
NSE levels in the group with severe BBB disruption were higher than those in the group without severe BBB
disruption, regardless of CSF NSE levels. In patients with good neurologic outcomes, there was no difference in
serum NSE levels between groups with and without severe BBB disruption, as CSF NSE levels were low. Addition-
ally, the prognostic value of serum NSE in the group with severe BBB disruption was more useful than that in
the group without severe BBB disruption. Therefore, it is necessary to consider the heterogeneity of groups with
and without severe BBB disruption when using a cut-off value of serum NSE as a prognostic predictor, although
serum NSE would be useful, regardless of the occurrence of severe BBB disruption.
NSE is a cytoplasmic glycolytic enzyme with a serum half-life of approximately 24–72 h. The enzyme exists
as a dimer and has three subunits: α, β, and γ. NSE in the brain has two α and γ subunits, but no β subunits. The
dimeric αα form is specific for glial cells, whereas γ-enolase is found in neurons and other cells of neuroecto-
dermal origin. Both the γγ and αγ forms are also present in erythrocytes and platelets. Thus, haemolysis can
increase serum levels of NSE in proportion to the degree of haemolysis, even in the absence of brain i njury23. NSE
levels > 33 μg/L measured within 48 h in OHCA patients not treated with TTM had been used as a reliable marker
for predicting poor neurologic o utcomes24. High serum values of NSE at 48–72 h after CA support the prognosis
of poor neurologic outcomes, especially if repeated sampling results in consistently high v alues7,25. However,
some studies on NSE in CA patients treated with TTM have provided conflicting results for cut-off values for the
prediction of poor neurologic outcomes, with no false positives ranging from 28 to > 100 μg/L4,26–32. In this study,
the cut-off values of serum NSE at 53–57 h after ROSC between groups with and without severe BBB disrup-
tion was different, although serum NSE showed a good performance for predicting poor neurologic outcomes.
The BBB regulates the brain parenchymal movement of plasma components. In general, the transcellular path-
way of the BBB is migration by passive diffusion. However, only neutral lipophilic substances with a molecular
weight < 450 Da can travel through this p athway33–35. NSE with a molecular weight of 78 kDa is released into
the CSF from damaged neurons and then into the systemic circulation when severe BBB disruption occurs,
and is predictive of poor neurologic outcomes13–16,36. In this study, the group with severe BBB disruption had
significantly higher serum NSE levels and poor neurological outcomes compared to the group with severe BBB
Scientific Reports | (2022) 12:2186 | https://doi.org/10.1038/s41598-022-06233-4 5
Vol.:(0123456789)www.nature.com/scientificreports/
2YHUDOO &RUUHODWLRQ&RHIILFLHQW
&RUUHODWLRQ&RHIILFLHQW &RUUHODWLRQ&RHIILFLHQW
3 YDOXH 3 YDOXH 3 YDOXH
:LWKRXW &RUUHODWLRQ&RHIILFLHQW &RUUHODWLRQ&RHIILFLHQW &RUUHODWLRQ&RHIILFLHQW
VHYHUH%%% 3 YDOXH 3 YDOXH 3 YDOXH
GLVUXSWLRQ
:LWK &RUUHODWLRQ&RHIILFLHQW &RUUHODWLRQ&RHIILFLHQW &RUUHODWLRQ&RHIILFLHQW
VHYHUH%%% 3 YDOXH 3 YDOXH 3 YDOXH
GLVUXSWLRQ
Figure 3. Correlations between Qa, serum NSE, and CSF NSE. In the group without severe BBB disruption,
there were no statistically significant correlations between serum and CSF NSE. Meanwhile, in the group with
severe BBB disruption, there were large positive correlations between serum and CSF NSE. (NSE: neuron-
specific enolase; Qa: CSF serum albumin quotient; CSF: cerebrospinal fluid; BBB: blood brain barrier).
disruption. Additionally, in the group without severe BBB disruption, there were no statistically significant cor-
relations between serum and CSF NSE. Meanwhile, in the group with severe BBB disruption, there were large
positive correlations between serum and CSF NSE, although the actual correlation coefficient would be higher,
considering that the maximal measurement range of NSE was 300 μg/L in this study.
There are several limitations to this study. First, this was a single-centre study with a small sample size that
might limit the generalisability of our findings, although a total of 57 patients were required for the study. Second,
CSF albumin was obtained through a lumbar catheter. One study reported that albumin concentration in the
lumbar space was 2.2 times higher than that in the v entricle37. However, the heterogeneity of both groups with
and without severe BBB disruption was observed as the purpose of this study. Third, as the maximal measure-
ment range of NSE was 300 μg/L in this study, an accurate trend of serum NSE could not be predicted. Fourth,
we did not assess the histopathology, cellular findings, or neuroimaging findings in the brain cortex at 24 h after
ROSC. However, this study revealed that severe BBB disruption affects the prognostic value of serum NSE. Fifth,
NSE was measured on the third day of hospitalisation; therefore, it was impossible to determine the change in
NSE over the long term. Sixth, other biomarkers such as neurofilament light chain were not measured; hence,
we could not speculate on the changes in these parameters. Seventh, DCE-MRI or S 100b protein were not used
for evaluating severe BBB disruption. However, the Qa used in this study is known as the gold standard for the
functional assessment of BBB disruption16,38,39. Additionally, the purpose of this study was not to reveal BBB
disruption, but to reveal that severe BBB disruption is one of the reasons why the cut-off value of NSE, which is
known to be useful, has a wide range in predicting the neurological prognosis of OHCA patients treated with
TTM. Finally, the investigator was not blinded throughout the experiment. Future studies involving blinding
are needed to focus on this limitation.
Conclusions
In evaluating the cut-off and prognostic value of serum NSE as a predictor of poor neurologic outcomes in
OHCA patients treated with TTM, we demonstrated that patients with and without severe BBB disruption were
heterogeneous. However, as the method of using the CSF serum albumin quotient to determine the presence or
absence of severe BBB disruption is invasive, further studies on how to detect severe BBB disruption are needed
to present the cut-off value of serum NSE as a prognostic predictor in OHCA patients treated with TTM.
Received: 13 August 2021; Accepted: 25 January 2022
Scientific Reports | (2022) 12:2186 | https://doi.org/10.1038/s41598-022-06233-4 6
Vol:.(1234567890)www.nature.com/scientificreports/
References
1. van Alem, A. P., Waalewijn, R. A., Koster, R. W. & de Vos, R. Assessment of quality of life and cognitive function after out-of-
hospital cardiac arrest with successful resuscitation. Am. J. Cardiol. 93, 131–135. https://doi.org/10.1016/j.amjcard.2003.09.027
(2004).
2. Cronberg, T., Lilja, G., Rundgren, M., Friberg, H. & Widner, H. Long-term neurological outcome after cardiac arrest and therapeutic
hypothermia. Resuscitation 80, 1119–1123. https://doi.org/10.1016/j.resuscitation.2009.06.021 (2009).
3. Peberdy, M. A. et al. Part 9: post-cardiac arrest care: 2010 American Heart Association guidelines for cardiopulmonary resuscita-
tion and emergency cardiovascular care. Circulation 122, S768-786. https://doi.org/10.1161/circulationaha.110.971002 (2010).
4. Bouwes, A. et al. Prognosis of coma after therapeutic hypothermia: A prospective cohort study. Ann. Neurol. 71, 206–212. https://
doi.org/10.1002/ana.22632 (2012).
5. Bassetti, C., Bomio, F., Mathis, J. & Hess, C. W. Early prognosis in coma after cardiac arrest: A prospective clinical, electrophysi-
ological, and biochemical study of 60 patients. J. Neurol. Neurosurg. Psychiatry. 61, 610–615. https://doi.org/10.1136/jnnp.61.6.
610 (1996).
6. Levy, D. E. et al. Predicting outcome from hypoxic-ischemic coma. JAMA 253, 1420–1426 (1985).
7. Nolan, J. P. et al. European Resuscitation Council and European Society of Intensive Care Medicine guidelines for post-resuscitation
care 2015: Section 5 of the European Resuscitation Council guidelines for resuscitation 2015. Resuscitation 95, 202–222. https://
doi.org/10.1016/j.resuscitation.2015.07.018 (2015).
8. Rundgren, M., Cronberg, T., Friberg, H. & Isaksson, A. Serum neuron specific enolase—Impact of storage and measuring method.
BMC Res. Notes 7, 726. https://doi.org/10.1186/1756-0500-7-726 (2014).
9. Mlynash, M. et al. Serum neuron-specific enolase levels from the same patients differ between laboratories: Assessment of a
prospective post-cardiac arrest cohort. Neurocrit. Care 19, 161–166. https://doi.org/10.1007/s12028-013-9867-5 (2013).
10. Stern, P. et al. Performance characteristics of seven neuron-specific enolase assays. Tumour Biol. 28, 84–92. https://doi.org/10.
1159/000098441 (2007).
11. Park, J. H., Wee, J. H., Choi, S. P., Oh, J. H. & Cheol, S. Assessment of serum biomarkers and coagulation/fibrinolysis markers for
prediction of neurological outcomes of out of cardiac arrest patients treated with therapeutic hypothermia. Clin. Exp. Emerg. Med.
6, 9–18. https://doi.org/10.15441/ceem.17.273 (2019).
12. Undén, J. et al. Raised serum S100B levels after acute bone fractures without cerebral injury. J. Trauma 58, 59–61. https://doi.org/
10.1097/01.ta.0000130613.35877.75 (2005).
13. Correale, J. et al. Status epilepticus increases CSF levels of neuron-specific enolase and alters the blood-brain barrier. Neurology
50, 1388–1391. https://doi.org/10.1212/wnl.50.5.1388 (1998).
14. Kim, B. J. et al. The second elevation of neuron-specific enolase peak after ischemic stroke is associated with hemorrhagic trans-
formation. J. Stroke. Cerebrovasc. Dis. 23, 2437–2443. https://doi.org/10.1016/j.jstrokecerebrovasdis.2014.05.020 (2014).
15. Selakovic, V., Raicevic, R. & Radenovic, L. The increase of neuron-specific enolase in cerebrospinal fluid and plasma as a marker
of neuronal damage in patients with acute brain infarction. J. Clin. Neurosci. 12, 542–547. https://doi.org/10.1016/j.jocn.2004.07.
019 (2005).
16. Reiber, H. & Felgenhauer, K. Protein transfer at the blood cerebrospinal fluid barrier and the quantitation of the humoral immune
response within the central nervous system. Clin. Chim. Acta. 163, 319–328. https://d oi.o rg/1 0.1 016/0 009-8 981(87)9 0250-6 (1987).
17. Park, J. S. et al. Study on the timing of severe blood-brain barrier disruption using cerebrospinal fluid-serum albumin quotient in
post cardiac arrest patients treated with targeted temperature management. Resuscitation 135, 118–123. https://doi.org/10.1016/j.
resuscitation.2018.10.026 (2019).
18. You, Y. et al. The usefulness of neuron-specific enolase in cerebrospinal fluid to predict neurological prognosis in cardiac arrest
survivors who underwent target temperature management: A prospective observational study. Resuscitation 145, 185–191. https://
doi.org/10.1016/j.resuscitation.2019.09.027 (2019).
19. Engelborghs, S. et al. Consensus guidelines for lumbar puncture in patients with neurological diseases. Alzheimers Dement. 8,
111–126. https://doi.org/10.1016/j.dadm.2017.04.007 (2017).
20. Ameloot, K. et al. Mean arterial pressure of 65 mm Hg versus 85–100 mm Hg in comatose survivors after cardiac arrest: Rationale
and study design of the neuroprotect post-cardiac arrest trial. Am. Heart J. 191, 91–98. https://doi.org/10.1016/j.ahj.2017.06.010
(2017).
21. Kövesdi, E. et al. Update on protein biomarkers in traumatic brain injury with emphasis on clinical use in adults and pediatrics.
Acta Neurochir. 152, 1–17. https://doi.org/10.1007/s00701-009-0463-6 (2010).
22. Vondrakova, D. et al. Association of neuron-specific enolase values with outcomes in cardiac arrest survivors is dependent on the
time of sample collection. Crit. Care 21, 172. https://doi.org/10.1186/s13054-017-1766-2 (2017).
23. Thelin, E. P. et al. Serial sampling of serum protein biomarkers for monitoring human traumatic brain injury synamics: A systematic
review. Front. Neurol. 8, 300. https://doi.org/10.3389/fneur.2017.00300 (2017).
24. Zandbergen, E. G. et al. Prediction of poor outcome within the first 3 days of postanoxic coma. Neurology 66, 62–68. https://doi.
org/10.1212/01.wnl.0000191308.22233.88 (2006).
25. Callaway, C. W. et al. Part 8: Post-Cardiac Arrest Care: 2015 American Heart Association Guidelines update for cardiopulmonary
resuscitation and emergency cardiovascular care. Circulation 132, S465-482. https://d oi.o
rg/1 0.1 161/c ir.0 00000 00000 00262 (2015).
26. Steffen, I. G. et al. Mild therapeutic hypothermia alters neuron specific enolase as an outcome predictor after resuscitation: 97
prospective hypothermia patients compared to 133 historical non-hypothermia patients. Crit. Care 14, R69. https://doi.org/10.
1186/cc8975 (2010).
27. Daubin, C. et al. Serum neuron-specific enolase as predictor of outcome in comatose cardiac-arrest survivors: A prospective cohort
study. BMC Cardiovasc. Disord. 11, 48. https://doi.org/10.1186/1471-2261-11-48 (2011).
28. Zellner, T., Gärtner, R., Schopohl, J. & Angstwurm, M. NSE and S-100B are not sufficiently predictive of neurologic outcome after
therapeutic hypothermia for cardiac arrest. Resuscitation 84, 1382–1386. https://d oi.o rg/1 0.1 016/j.r esusc itati on.2 013.0 3.0 21 (2013).
29. Huntgeburth, M. et al. Changes in neuron-specific enolase are more suitable than its absolute serum levels for the prediction of
neurologic outcome in hypothermia-treated patients with out-of-hospital cardiac arrest. Neurocrit. Care 20, 358–366. https://doi.
org/10.1007/s12028-013-9848-8 (2014).
30. Oksanen, T., Pettilä, V., Hynynen, M. & Varpula, T. Therapeutic hypothermia after cardiac arrest: Implementation and outcome
in Finnish intensive care units. Acta. Anaesthesiol. Scand. 51, 866–871. https://doi.org/10.1111/j.1399-6576.2007.01365.x (2007).
31. Undgren, M. et al. Neuron specific enolase and S-100B as predictors of outcome after cardiac arrest and induced hypothermia.
Resuscitation 80, 784–789. https://doi.org/10.1016/j.resuscitation.2009.03.025 (2009).
32. Hasslacher, J. et al. Secretoneurin as a marker for hypoxic brain injury after cardiopulmonary resuscitation. Intensive Care Med.
40, 1518–1527. https://doi.org/10.1007/s00134-014-3423-4 (2014).
33. Cardoso, F. L., Brites, D. & Brito, M. A. Looking at the blood-brain barrier: Molecular anatomy and possible investigation
approaches. Brain Res. Rev. 64, 328–363. https://doi.org/10.1016/j.brainresrev.2010.05.003 (2010).
34. Obermeier, B., Daneman, R. & Ransohoff, R. M. Development, maintenance and disruption of the blood–brain barrier. Nat. Med.
19, 1584–1596. https://doi.org/10.1038/nm.3407 (2013).
35. Pardridge, W. M. Drug delivery to the brain. J. Cereb. Blood Flow Metab. 17, 713–731. https://doi.org/10.1097/00004647-19970
7000-00001 (1997).
Scientific Reports | (2022) 12:2186 | https://doi.org/10.1038/s41598-022-06233-4 7
Vol.:(0123456789)www.nature.com/scientificreports/
36. Sharma, H. S., Miclescu, A. & Wiklund, L. Cardiac arrest-induced regional blood-brain barrier breakdown, edema formation and
brain pathology: A light and electron microscopic study on a new model for neurodegeneration and neuroprotection in porcine
brain. J. Neural. Transm. 118, 87–114. https://doi.org/10.1007/s00702-010-0486-4 (2011).
37. Weisner, B. & Bernhardt, W. Protein fractions of lumbar, cisternal, and ventricular cerebrospinal fluid. Separate areas of reference.
J. Neurol. Sci. 37, 205–214. https://doi.org/10.1016/0022-510x(78)90204-6 (1978).
38. Kapural, M. et al. Serum S-100beta as a possible marker of blood-brain barrier disruption. Brain Res. 940, 102–104. https://doi.
org/10.1016/s0006-8993(02)02586-6 (2002).
39. Hjouj, M. et al. MRI study on reversible and irreversible electroporation induced blood brain barrier disruption. PLoS ONE 7,
e42817. https://doi.org/10.1371/journal.pone.0042817 (2012).
Acknowledgements
We would like to thank Editage (http://www.editage.co.kr) for English language editing. This project was funded
in whole by the National Research Foundation of Korea (NRF) grant funded by the Korea government (MSIT)
(No. 2019R1F1A1041024).
Author contributions
Conception and design of study: Y.Y., S.R. Analysis and/or interpretation of data: H.J.A., J.S.P., J.H.M. Drafting
the manuscript: C.K., S.W.K., W.J., J.L. Revising the manuscript critically for important intellectual content: I.Y.,
Y.C., Y.N.I. Approval of the version of the manuscript to be published: Y.Y., J.S.P., J.H.M., W.J., H.J.A., Y.N.I.,
C.K., I.Y., Y.C., S.R., J.L., S.W.K.
Competing interests
The authors declare no competing interests.
Additional information
Correspondence and requests for materials should be addressed to Y.Y.
Reprints and permissions information is available at www.nature.com/reprints.
Publisher’s note Springer Nature remains neutral with regard to jurisdictional claims in published maps and
institutional affiliations.
Open Access This article is licensed under a Creative Commons Attribution 4.0 International
License, which permits use, sharing, adaptation, distribution and reproduction in any medium or
format, as long as you give appropriate credit to the original author(s) and the source, provide a link to the
Creative Commons licence, and indicate if changes were made. The images or other third party material in this
article are included in the article’s Creative Commons licence, unless indicated otherwise in a credit line to the
material. If material is not included in the article’s Creative Commons licence and your intended use is not
permitted by statutory regulation or exceeds the permitted use, you will need to obtain permission directly from
the copyright holder. To view a copy of this licence, visit http://creativecommons.org/licenses/by/4.0/.
© The Author(s) 2022
Scientific Reports | (2022) 12:2186 | https://doi.org/10.1038/s41598-022-06233-4 8
Vol:.(1234567890)You can also read