Gene mapping and functional annotation of GWAS of oral ulcers using fUMA software - Nature
←
→
Page content transcription
If your browser does not render page correctly, please read the page content below
www.nature.com/scientificreports
OPEN Gene mapping and functional
annotation of GWAS of oral ulcers
using FUMA software
Xiaoye Jin1,2, Yijie Wang2, Xingru Zhang1,2, Wenqing Zhang2, Hongdan Wang3* &
Chuanliang Chen3*
Oral ulcers not only influence the physical health of patients, but they also interfere with their
quality of life. However, the exact etiology of oral ulcers is not clear. To explore the roles of genetic
factors in oral ulcers, a genome-wide association study of the condition in European individuals was
re-evaluated by the FUMA v1.3.5e online tool. A total of 380 independent significant single nucleotide
polymorphisms (SNPs) and 89 lead SNPs were identified in 34 genomic risk loci. Out of these identified
genomic risk loci, 280 possible causal genes were pinpointed by positional mapping and expression
quantitative trait locus mapping. Among these genes, 216 novel genes were identified. Furthermore,
some genomic loci were mapped to a single gene. Functional annotation of these prioritized genes
revealed that the immune response pathway was implicated in the onset of oral ulcers. Overall, our
findings revealed novel possible causal genes and demonstrated that the immune response has a
crucial role in the occurrence of oral ulcers.
The oral ulcer is an ulcer that occurs on the mucous membrane of the oral cavity. Nearly one-quarter of young
adults and many children are affected by this c ondition1,2. Recurrent aphthous stomatitis (RAS) refers to a chronic
inflammatory, ulcerative condition of the oral cavity. RAS is characterized by the recurrent outbreak of ulcers
and erosions1. It is one of the most common causes of oral ulcers, and its prevalence in populations is 5–20%3.
Even though several factors have been implicated in RAS (e.g., trauma, bacterial/viral infections, anaphylaxis,
autoimmune diseases), the exact etiology of this condition is not clear. Dudding and colleagues stated that
immune regulation exerts important influences on RAS onset4. Besides, family-based studies have revealed that
genetic factors also have pivotal roles in RAS etiopathogenesis5–7.
Genome-wide association studies can be used to assess associations between SNPs and traits/diseases by
detecting a multitude of genetic variants in individuals with different phenotypes. Also, it is beneficial to discern
possible causal variants and the genetic architecture of the disease of interest. Dudding et al. re-analyzed data of
GWAS of oral ulcers in the UK Biobank Project. They found some genetic variants associated with oral ulcers.
Then, they replicated these variants in another novel cohort and assessed the effects of these variants in other
populations4. Overall, they revealed that 97 variants were related to RAS risk, and that T cell regulation was
implicated in RAS4. Even though GWAS can provide many disease-associated genetic loci, it may be difficult to
determine possible causal mutations because identified genetic variants may be situated in non-coding r egions8,
or be in complete linkage disequilibrium (LD) with unknown causal variants9.
Recently, researchers have started to focus on roles of the non-coding regulatory regions in the etiopathogen-
esis of complex diseases. For example, by assessing mRNA expression data in zebrafish, Golzio et al. searched
potential causal genes at genomic risk loci10. Wu et al. conducted integration analyses of GWAS results and
expression quantitative trait locus (eQTL) data for schizophrenia. They found that some pathways could provide
novel insights into the genetic architecture of schizophrenia11. Accordingly, integration of GWAS data and gene
expression data can be used to identify the potential causal genes associated with complex disease or traits, which
are good for carrying out functional experimentation in further research. However, it can be difficult to mine
more valuable information from extant GWAS results by integrating functional annotation from Encyclope-
dia of DNA Elements (ENCODE)12, Genotype-Tissue Expression (GTEx) p rogram13 or chromatin interaction
1
College of Forensic Medicine, Xi’an Jiaotong University Health Science Center, Xi’an, China. 2Key Laboratory of
Shaanxi Province for Craniofacial Precision Medicine Research, College of Stomatology, Xi’an Jiaotong University,
Xi’an, China. 3Medical Genetics Institute of Henan Province, Henan Provincial People’s Hospital, Zhengzhou
University People’s Hospital, Zhengzhou, China. *email: wanghongdan5495@163.com; cclhenan@163.com
Scientific Reports | (2020) 10:12205 | https://doi.org/10.1038/s41598-020-68976-2 1
Vol.:(0123456789)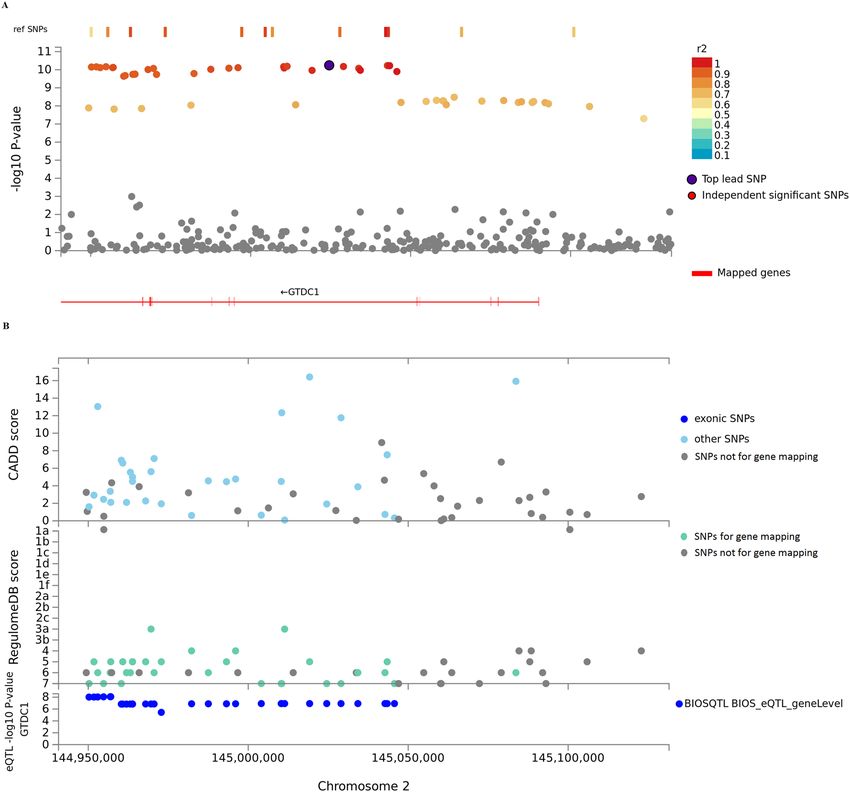
www.nature.com/scientificreports/
information14. Until now, some tools for bioinformatics analyses have been developed to aid identification of
the causal variants associated with traits/diseases15–17. Nonetheless, some packages also have some defects when
perform post-GWAS analysis. For example, DEPICT and INRICH tools do not take local LD into account, which
might induce false-positive enrichment analysis. To provide a highly efficient, concise, and easy-to-use tool,
Posthuma et al. developed an Internet-based program named FUMA v1.3.5e (https://fuma.ctglab.nl/) that can
further explore GWAS data by utilizing multiple biological d atabases18. Furthermore, FUMA can simultaneously
carry out functional annotation of candidate SNPs, gene mapping, tissue-expression analysis of prioritized genes,
gene set enrichment analysis (GSEA), and interactive visualization. Posthuma and colleagues re-analysed the
GWAS results for Crohn’s disease, schizophrenia and body mass index by FUMA. They found that FUMA not
only validated known candidate genes in these traits, it also identified some additional putative causal genes by
eQTL mapping and chromatin interaction mapping18. Taken together, FUMA could undertake robust and reli-
able post-GAWS analyses and provide valuable clues for understanding the genetic mechanism of traits/diseases.
We wished to further explore the genetic mechanism of oral ulcers. Previously reported GWAS summary
lcers19 were integrated with the published database by FUMA18. First, the most likely causal genes
data of oral u
associated with oral ulcers were identified by a combination of positional mapping and eQTL mapping. Next,
these prioritized genes were dissected to reveal their molecular function and implicated biological pathways in
oral ulcers.
Methods
Summary statistics of GWAS for oral ulcers. The GWAS summary data of oral ulcers used in the pre-
sent study were downloaded from the GWAS ATLAS database20. The detailed criteria of sample screening and
quality control of SNPs have been presented p reviously19. After quality control of data, 10,599,054 SNPs were
used to carry out post-GWAS analyses of oral ulcers. All participants provided their written informed consent.
Ethics approval involved in these participants was obtained from the North West Centre for Research Ethics
Committee (11/NW/0.382)19. All methods used in this study were carried out in accordance with the declaration
of Helsinki. The general information of oral ulcers GWAS used in this study was given in Supplementary Table 1.
Identification of genes and their roles in oral ulcers using FUMA. Definition of genomic risk loci
based on oral ulcers GWAS. Independent significant SNPs for which P < 5 × 10⁻⁸ and r2 < 0.6 were identified from
GWAS results. Lead SNPs were defined further from these independent significant SNPs if pairwise SNPs had
r2 < 0.1. Genomic risk loci in which SNPs were in LD (r2 > 0.6) with independent significant SNPs were identi-
fied. The maximum distance between LD blocks to merge into a genomic locus was 250 kb. The genetic data
of European populations in 1000G p hase321 were viewed as reference data to conduct LD analyses. Besides, 24
SNPs reported by Dudding and c olleagues4 which reached GWA significant P-values and displayed the same
effect directions in different independent populations were defined as lead SNPs, as shown in Supplementary
Table 2.
Gene mapping. We used two methods to map SNPs to genes. First, CADD scores are deleterious scores of
genetic variants obtained by 63 functional annotations. Kircher and colleagues proposed that 12.37 could be
viewed as the threshold for a deleterious s core22. Therefore, SNPs were filtered based on a CADD score > 12.37
when undertaking positional mapping. Then, genes in each genomic risk locus were determined by screened
SNPs if the physical distance between a SNP and gene was < 10 kb. Second, for eQTL mapping, SNPs were mapped
to a gene if these SNPs had significant effects on expression of the gene. eQTL data of 27 tissues (single-cell RNA
eQTL23, Database of Immune Cell Expression (DICE)24, Biobank-Based Integrative Omics Study (BIOS) QTL
browser25, and GTEx v8 Whole Blood and Minor Salivary G land26) were used for eQTL mapping. Only significant
eQTL values (false discovery rate (FDR) < 0.05) were employed to map SNPs to genes.
Expression (transcripts per million) of prioritized genes in different tissues was estimated from GTEx v 826
following winsorization at 50 and l og2 transformation with pseudocount 1.
GSEA by the GENE2FUN tool in FUMA. Using hypergeometric tests, the possible biological functions of
the genes identified by positional mapping and eQTL mapping were explored further by comparing them with
genes in the GWAS catalog27, as well as gene sets in WikiPathways28 and the Molecular Signatures Database
(MsigDB) v7.129. Overall, there were 20,260 background genes which were applied to GSEA. Gene sets were
reported if they met two criteria: (i) at least two prioritized genes belonged to the gene set; (ii) the adjusted P value
of the gene set was < 0.05. The Benjamini–Hochberg c orrection30 was used to assess the statistical significance
of inputted gene sets. Next, genetic correlation analyses between oral ulcers and other available traits/diseases
were undertaken by the LD h ub31.
Results
Summary results of GWAS of oral ulcers by FUMA. The summary statistics of GWAS for oral ulcers
were explored further by FUMA (Table 1). A total of 380 independent significant SNPs and 89 lead SNPs were
identified from GWAS of oral ulcers by FUMA (Supplementary Tables 3, 4). For these 89 lead SNPs, we found
one stop gained variant, one splice region variant, one non-coding transcript exon variant, three missense vari-
ants, five untranslated region variants, 14 regulatory region variants, 24 intergenic variants, and 40 intron vari-
ants (Supplementary Table 4). Dudding et al. conducted GWAS of oral ulcers based on the UK Biobank Project,
and found 97 independent lead variants4. There were 37 lead SNPs which we also found in comparison with the
97 variants discovered by Dudding et al. (Supplementary Table 4). Furthermore, these 89 lead SNPs could be
classified into 34 genomic risk loci (Table 2 and Supplementary Table 5). Compared with the 33 risk loci iden-
tified in the original study by Bycroft and colleagues19, two novel genomic loci (genomic loci 16 and 18) were
identified in the present study. We also plotted the results of these 34 genomic risk loci (Fig. 1). Results revealed
Scientific Reports | (2020) 10:12205 | https://doi.org/10.1038/s41598-020-68976-2 2
Vol:.(1234567890)www.nature.com/scientificreports/
Index Number
Independent significant SNPs 380
Lead SNPs 89
Risk loci 34
Positional mapping 143
eQTL mapping 262
Total# 280
Genes located outside the risk loci 81
Loci contain prioritized genes 183
Table 1. Summary results of genome-wide analysis of oral ulcers based on FUMA software v1.3.5e. # The
number of unique genes mapped by one of the positional and eQTL mappings.
Genomic Loci Start (hg19) End (hg19) Rs number Chromosome Position (hg19) P value
1 92,315,896 92,925,654 rs141094656 1 92,753,336 2.15E−09
2 150,534,368 150,960,350 rs11204668 1 150,543,686 1.34E−08
3 206,829,903 207,040,614 rs1800871 1 206,946,634 2.57E−66
4 247,561,515 247,572,169 rs72771985 1 247,570,566 4.92E−08
5 144,949,378 145,122,864 rs74966768 2 145,024,540 5.71E−11
6 192,009,455 192,030,391 rs7574070 2 192,010,488 4.91E−19
7 45,882,792 46,592,726 rs4683205 3 46,334,670 8.78E−52
8 158,547,026 160,401,080 rs76830965 3 159,637,678 1.21E−185
9 160,899,714 161,811,200 rs150383292 3 161,279,822 1.31E−11
10 59,506,581 59,569,008 rs9291686 5 59,558,313 1.73E−11
11 29,733,390 33,127,757 rs3135461 6 32,680,122 2.91E−22
12 106,321,688 106,322,875 rs9480610 6 106,321,844 4.42E−08
13 137,513,744 137,541,075 rs4896244 6 137,529,772 1.75E−14
14 137,959,235 138,006,504 rs17264332 6 138,005,515 3.69E−08
15 50,259,274 50,361,683 rs10263046 7 50,309,615 1.21E−18
16 92,061,364 92,218,899 rs112629741 7 92,076,793 2.68E−07
17 128,573,967 128,711,874 rs11761199 7 128,581,835 7.25E−10
18 150,208,971 150,355,449 rs62491812 7 150,327,424 8.14E−07
19 90,656,140 90,936,369 rs11989430 8 90,818,615 8.48E−15
20 126,274,338 126,398,091 rs2385100 8 126,391,143 1.00E−12
21 144,643,169 144,649,650 rs1545536 8 144,643,169 3.92E−09
22 117,547,772 117,654,990 rs10817678 9 117,579,457 1.89E−09
23 121,982,643 122,023,523 rs536991 11 122,008,872 8.26E−09
24 69,612,262 69,766,606 rs1800973 12 69,744,014 3.50E−16
25 50,456,996 50,790,158 rs2066844 16 50,745,926 1.06E−12
26 85,917,823 86,021,505 rs11649485 16 86,014,455 3.85E−18
27 37,902,887 38,089,717 rs12232497 17 38,040,119 4.59E−09
28 43,463,493 44,865,498 rs7210219 17 44,018,519 4.35E−13
29 4,813,663 4,821,612 rs10411970 19 4,814,648 7.03E−12
30 6,536,926 6,549,921 rs28552734 19 6,546,524 1.58E−08
31 18,170,384 18,204,200 rs2305742 19 18,191,441 2.15E−12
32 18,575,193 18,589,943 rs11670056 19 18,589,943 2.45E−09
33 46,847,901 46,907,186 rs3764613 19 46,896,217 2.04E−21
34 48,937,467 48,977,740 rs913678 20 48,955,424 2.69E−14
Table 2. Genomic risk loci of interest from oral ulcers GWAS.
that most SNPs and genes were mapped in chromosome 6, followed by chromosome 3 and chromosome 17. Fur-
thermore, 280 prioritized genes that may be involved in the biological mechanism of oral ulcers were recognized
by FUMA (Supplementary Table 6). Among these genes of interest, 183 genes and 81 genes were located inside
and outside genomic risk loci, respectively.
Scientific Reports | (2020) 10:12205 | https://doi.org/10.1038/s41598-020-68976-2 3
Vol.:(0123456789)www.nature.com/scientificreports/
Figure 1. Summary of genomic risk loci based on GWAS of oral ulcers. Genomic risk loci are displayed by
the ‘chromosome:start position-end position’ on the Y axis. Histograms from left to right depict the size of
the genomic locus, number of candidate SNPs in the genomic locus, number of mapped genes by positional
mapping and eQTL mapping in the genomic locus, and the number of genes known to be located within the
genomic loci, respectively.
Gene prioritization. We pinpointed 280 possible causal genes involved in the genetic etiology of oral ulcers
by positional mapping and eQTL mapping (Supplementary Table 6). Even though FUMA provides a chromatin-
interaction method to map SNPs to genes, chromatin-interaction data related to oral ulcers in FUMA are absent.
Therefore, we did not conduct chromatin interaction mapping. For positional mapping, there were 143 genes in
20 genomic risk loci identified by deleterious SNPs. Besides, 262 genes in 28 genomic regions were pinpointed by
eQTL mapping. Among these prioritized genes, 125 genes were identified by both deleterious SNPs and eQTL.
Out of 34 genomic loci, there were four loci in which no genes were identified; the remaining loci were mapped
to at least one candidate gene; nearly half of candidate genes were located in genomic locus 11 (Supplementary
Table 6). Compared with findings by Dudding and c olleagues4, we pinpointed 216 novel genes. Furthermore, we
found that six genomic loci were mapped to a single gene (GTDC1 in genomic locus 5, NDUFAF2 in genomic
locus 10, IFNGR1 in genomic locus 13, NSMCE2 in genomic locus 20, BLID in genomic locus 23, and CEBPB
in genomic locus 34), implying that associations between these loci and oral ulcers were likely attributed to
these genes. Furthermore, NDUFAF2, CEBPB and BLID were genes identified for the first time in the present
study. NDUFAF2 encodes a complex I assembly factor, which facilitates the translocation of protons from across
to inside the mitochondrial membrane. NDUFAF2 was pinpointed by eQTLs in naïve CD8 T cells, indicating
that an SNP may affect NDUFAF2 expression in CD8 T cells, which further alters the functions of CD8 T cells.
CEBPB, which was identified by eQTLs in whole blood cells, encodes transcription factors that include a basic
leucine zipper domain; CEBPB is involved mainly in the regulation of genes related to immune and inflam-
matory responses. Therefore, abnormal expression of CEBPB might lead to dysregulation of the immune and
inflammatory response, and then increase the risk of contracting an oral ulcer. BLID, which was identified by a
deleterious SNP, encodes the BH3-like motif acting on cell death. Therefore, BLID may affect the risk of contract-
ing an oral ulcer by regulating cell death. More importantly, we found that GTDC1 in genomic locus 5 was recog-
nized by both deleterious SNPs and eQTL mapping. Therefore, a regional plot of genomic locus 5 was carried out
(Fig. 2). Results revealed that GTDC1 was prioritized. In the study by Dudding and colleagues, GTDC1 was also
identified by DEPICT software, indicating that GTDC1 might be implicated in the genetic basis of oral u lcers4.
Scientific Reports | (2020) 10:12205 | https://doi.org/10.1038/s41598-020-68976-2 4
Vol:.(1234567890)www.nature.com/scientificreports/
Figure 2. Regional plot of locus 2q22.3 of GWASs of oral ulcers. A, GWAS P-values of SNPs in 2q22.3. Genes
identified by FUMA v1.3.5e are shown in red. Non-GWAS-tagged SNPs are shown as rectangles because they
do not have the P-value from GWAS of oral ulcers, but they are in LD with the lead SNP. B, CADD score,
RequlomeDB score, and eQTL P-value of SNPs in 2q22.3. eQTLs are plotted based on GTDC1.
We also estimated the expression patterns of identified genes in different tissues (Supplementary Table 7).
Most genes showed consistent expression in these 30 tissues. Moreover, 155 genes showed relatively high expres-
sion (> 2.84) in salivary-gland tissues.
GSEA. GSEA was undertaken to test the possible biological mechanisms of 280 candidate genes implicated
in oral ulcers (Supplementary Table 8). A total of 793 gene sets with an adjusted P < 0.05 were identified against
20,260 background genes. Among these gene sets, the most significant gene set was the gene set involved in
the autism spectrum disorder or schizophrenia (adjusted P value = 5.5392E-112), followed by other gene sets
involved in other diseases. Furthermore, we found that the pinpointed 280 genes showed strong enrichment sig-
nals in gene sets related to the immune response and cytokine regulation, for example: GO_POSITIVE_REGU-
LATION_OF_IMMUNE_RESPONSE (adjusted P values = 1.9320E-18), GO_INNATE_IMMUNE_RESPONSE
(adjusted P values = 6.3002E-18), GO_CYTOKINE_MEDIATED_SIGNALING_PATHWAY (adjusted P val-
ues = 6.4010E-18), GO_PEPTIDE_ANTIGEN_BINDING (adjusted P values = 2.1694E-20), and GO_ANTI-
GEN_BINDING (adjusted P values = 2.7157E-13). Dudding et al. conducted GSEA of identified genes against
14,461 pre-computed gene sets using DEPICT, and found 895 gene sets with a FDR < 0.014. Compared with those
895 gene sets, we identified 693 novel gene sets (Supplementary Table 8). Even so, strong enrichment signals in
some T-cell regulatory gene sets were observed in our study and in the study by Dudding and c olleagues4.
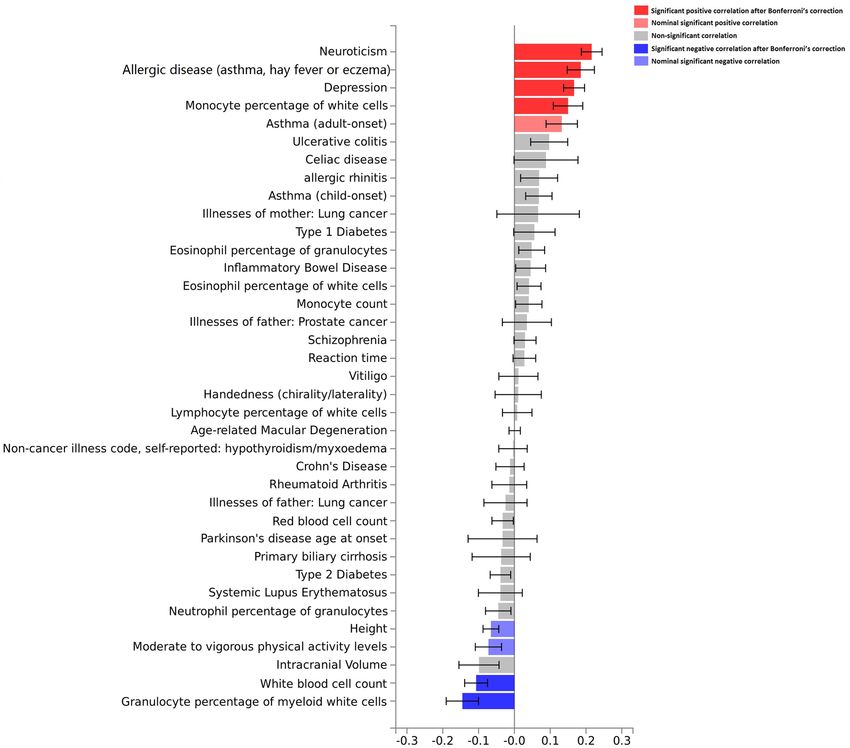
To assess further the genetic associations of oral ulcers and other traits, genetic correlation analyses between
oral ulcers and these traits were conducted (Fig. 3 and Supplementary Table 9). We found significant positive
correlations between oral ulcers and neuroticism, allergic disease (asthma, hay fever or eczema), depression,
monocyte percentage of white cells, and asthma (adult onset). We observed significant negative correlations
between oral ulcers and height, moderate to vigorous physical activity, white blood cell count, and granulocyte
Scientific Reports | (2020) 10:12205 | https://doi.org/10.1038/s41598-020-68976-2 5
Vol.:(0123456789)www.nature.com/scientificreports/
Figure 3. Genetic correlation analyses between oral ulcers and other traits by the LD Hub. Bar chart indicates
genetic correlation between two traits and the error bar represents the standard error of the genetic correlation.
percentage of myeloid cells (P < 0.05). However, there were no significant associations between oral ulcers and
asthma (adult onset), height or moderate to vigorous physical activity after using the Bonferroni correction.
Discussion
The factors implicated in RAS are incompletely understood. Possible risk factors are genetic susceptibility, stress,
immune-related diseases, as well as a lack of vitamins and minerals1. Lake and colleagues assessed the etiology
of RAS. They collected incidence information of RAS in twins and their parents. They found that genetic fac-
tors contributed to > 60% of variations in RAS onset32, implying that genetic factors had pivotal roles in RAS.
Using the UK Biobank Project, Bycroft and colleagues collected the phenotypic data of 500,000 individuals and
evaluated associations between genetic data and several phenotypes. For RAS, they found that many genetic
variations were involved in the risk of suffering from an oral u lcer19. In the present study, to further explore the
genetic architecture of oral ulcers, post-GWAS analyses of oral ulcers were carried out to pinpoint possible causal
variants and genes using FUMA.
Using FUMA, we pinpointed 34 genomic risk loci, including 89 lead SNPs and 380 independent significant
SNPs, from GWAS of oral ulcers. Next, these 280 prioritized genes were identified from these 34 genomic risk
loci by positional mapping and eQTL mapping. When comparing our results with those of other scholars4,19, we
not only validated some previous findings, we also obtained novel insights into the genetic architecture of oral
ulcers. For instance, 216 out of 280 prioritized genes were not reported in the study by Dudding and colleagues4.
For these novel identified genes, we found that most genes were located in the human leukocyte region (HLA)
region. Genes in the HLA regions might be in strong LD due to complicated LD structure of HLA regions.
Thus, most novel genes were found in the HLA region. Moreover, we identified 83 novel genes in other regions.
Among these novel prioritized genes, 121 had relatively high expression (> 2.84) in salivary gland tissues, which
implied that these genes might have important roles in the onset of oral ulcers. Furthermore, six single genes
were found in six genomic regions, respectively. Four genes (NDUFAF2, IFNGR1, NSMCE2 and CEBPB) showed
high expression in most tissues. GTDC1 showed intermediate expression in these tissues, whereas BLID showed
low expression in all tissues. Therefore, BLID might exert little influence on the onset of oral ulcers given its low
Scientific Reports | (2020) 10:12205 | https://doi.org/10.1038/s41598-020-68976-2 6
Vol:.(1234567890)www.nature.com/scientificreports/
expression in these tissues. Further functional validations of these novel genes must be conducted to unveil the
effect of these genes in oral ulcers.
GSEA of pinpointed genes revealed that most gene sets implicated in immune-related biological processes
had been identified (Supplementary Table 8). Scholars have pointed out that Th1 type immunologic response is
closely related to RAS development, and that RAS patients showed higher secretion of Th1 cytokines than that in
healthy controls33–35. Dudding et al. explored the enrichment patterns of genetic variants related to oral ulcers in
regulatory motifs using GARFIELD software. They found that these variants were enriched significantly in DNA-
sel hypersensitive sites in many T cells, and concluded that identified genes showed tissue-specific expression4.
We identified GO_T_CELL_ACTIVATION, GO_T_CELL_PROLIFERATION, GO_REGULATION_OF_T_
CELL_ACTIVATION and other T cell-related biological processes, implying that T cells have a crucial role in
RAS onset. Furthermore, changes in the microbiome community within the oral cavity have also been viewed as
lcers36,37. Dudding and colleagues pointed out that genetic loci associated with oral ulcers
risk factors for oral u
might induce oral ulcers by affecting host microbiome compositions; also, the susceptibility of non-infective fac-
tors for oral ulcers was influenced by these genetic loci4. Therefore, we inferred that genetic variants in genomic
risk loci might interfere with the function of immune-related genes, which increases the risk of contracting oral
ulcers by eliciting immune response disorders or affecting other risk factors.
Here, we noted genetic correlations between oral ulcers and other traits, especially oral ulcers and neuroticism
and depression. Dudding et al. also found significant positive associations between oral ulcers and neuroticism
and depression. Furthermore, they conducted local genetic-correlation analyses between oral ulcers and these
two traits by the rho-HESS method, and their results revealed that genetic correlations among these traits was
scattered evenly in the whole g enome4. We inferred that there might be a shared genetic architecture among
oral ulcers, neuroticism and depression that contributed to these diseases. Besides, the pleiotropy of complex
diseases/traits might also lead to their genetic correlations20.
In this study, we identified some novel causal genes and gene sets by conducting post-GWAS of oral ulcers
based on FUMA. Our data could provide novel insights into the genetic mechanisms of oral ulcers. Nevertheless,
our study had three main limitations. First, patients with an oral ulcer were selected by reviewing questionnaire
data. This method may have resulted in the misclassification of recruited individuals. Given the short duration
of oral ulcers, some affected individuals might not manifest visible symptoms. Therefore, the misclassification
of recruited individuals could not be avoided in our study. Besides, RAS and other types of oral ulcers could not
be distinguished from each other based on these investigation data. Even so, genetic factors might show slight
effects on other types of oral ulcers. More importantly, Dudding and colleagues proposed that the phenomena
mentioned-above could elicit small effects on the GWAS of oral ulcers4. Second, GWAS of oral ulcers were
undertaken in individuals with European ancestries, which revealed the genetic mechanism of the disease in
European populations. However, geographic, ethnic, and dietary differences also exert effects on the genetic
background of oral u lcers1. Consequently, further research on the genetic architecture of oral ulcers in East
Asian (especially Chinese) populations should be carried out. Third, the genetic mechanisms of oral ulcers were
explored by bioinformatics analysis only. Further validation by cell or tissue experiments for these identified
genes was not undertaken. Some genes may show false-positive correlations with oral ulcers if they are located
in a LD block which includes causal genes. Taken together, the gene sets presented in our study (especially those
for novel genes) require further functional analyses.
Conclusion
We re-processed the GWAS data of oral ulcers using FUMA, and pinpointed some novel genes associated with
oral ulcers. Further functional annotations of prioritized genes revealed that immune regulation pathways were
implicated in the risk of contracting oral ulcers. Our results can aid clarification of the genetic architecture of
oral ulcers.
Received: 18 February 2020; Accepted: 3 July 2020
References:
1. Slebioda, Z., Szponar, E. & Kowalska, A. Etiopathogenesis of recurrent aphthous stomatitis and the role of immunologic aspects:
literature review. Arch. Immunol. Ther. Exp. (Warsz) 62, 205–215. https://doi.org/10.1007/s00005-013-0261-y (2014).
2. Miller, M. F., Garfunkel, A. A., Ram, C. A. & Ship, I. I. The inheritance of recurrent aphthous stomatitis. Observations on suscep-
tibility. Oral Surg. Oral Med. Oral Pathol. 49, 409–412. https://doi.org/10.1016/0030-4220(80)90284-4 (1980).
3. Slebioda, Z., Szponar, E. & Kowalska, A. Recurrent aphthous stomatitis: genetic aspects of etiology. Postepy. Dermatol. Alergol. 30,
96–102. https://doi.org/10.5114/pdia.2013.34158 (2013).
4. Dudding, T. et al. Genome wide analysis for mouth ulcers identifies associations at immune regulatory loci. Nat. Commun. 10,
1052. https://doi.org/10.1038/s41467-019-08923-6 (2019).
5. Yilmaz, S. & Cimen, K. A. Familial Behcet’s disease. Rheumatol. Int. 30, 1107–1109. https://doi.org/10.1007/s00296-009-1036-y
(2010).
6. Scully, C. & Porter, S. Oral mucosal disease: recurrent aphthous stomatitis. Br. J. Oral Maxillofac. Surg. 46, 198–206. https://doi.
org/10.1016/j.bjoms.2007.07.201 (2008).
7. Safadi, R. A. Prevalence of recurrent aphthous ulceration in Jordanian dental patients. BMC Oral Health 9, 31. https://doi.
org/10.1186/1472-6831-9-31 (2009).
8. Zhao, Y. et al. A large-scale integrative analysis of GWAS and common meQTLs across whole life course identifies genes, pathways
and tissue/cell types for three major psychiatric disorders. Neurosci. Biobehav. Rev. 95, 347–352. https://doi.org/10.1016/j.neubi
orev.2018.10.005 (2018).
9. Zhu, Z. et al. Integration of summary data from GWAS and eQTL studies predicts complex trait gene targets. Nat. Genet. 48,
481–487. https://doi.org/10.1038/ng.3538 (2016).
Scientific Reports | (2020) 10:12205 | https://doi.org/10.1038/s41598-020-68976-2 7
Vol.:(0123456789)www.nature.com/scientificreports/
10. Golzio, C. et al. KCTD13 is a major driver of mirrored neuroanatomical phenotypes of the 16p11.2 copy number variant. Nature
485, 363–367. https://doi.org/10.1038/nature11091 (2012).
11. Wu, C. & Pan, W. Integrating eQTL data with GWAS summary statistics in pathway-based analysis with application to schizo-
phrenia. Genet. Epidemiol. 42, 303–316. https://doi.org/10.1002/gepi.22110 (2018).
12. Consortium, E. P. An integrated encyclopedia of DNA elements in the human genome. Nature 489, 57–74. https: //doi.org/10.1038/
nature11247 (2012).
13. GTEx Consortium. Human genomics. The genotype-tissue expression (GTEx) pilot analysis. Science 348, 648–660. https://doi.
org/10.1126/science.1262110 (2015).
14. Schmitt, A. D. et al. A compendium of chromatin contact maps reveals spatially active regions in the human genome. Cell Rep.
17, 2042–2059. https://doi.org/10.1016/j.celrep.2016.10.061 (2016).
15. Pers, T. H. et al. Biological interpretation of genome-wide association studies using predicted gene functions. Nat. Commun. 6,
5890. https://doi.org/10.1038/ncomms6890 (2015).
16. Iotchkova, V. et al. GARFIELD classifies disease-relevant genomic features through integration of functional annotations with
association signals. Nat. Genet. 51, 343–353. https://doi.org/10.1038/s41588-018-0322-6 (2019).
17. Lee, P. H., O’Dushlaine, C., Thomas, B. & Purcell, S. M. INRICH: interval-based enrichment analysis for genome-wide association
studies. Bioinformatics 28, 1797–1799. https://doi.org/10.1093/bioinformatics/bts191 (2012).
18. Watanabe, K., Taskesen, E., van Bochoven, A. & Posthuma, D. Functional mapping and annotation of genetic associations with
FUMA. Nat. Commun. 8, 1826. https://doi.org/10.1038/s41467-017-01261-5 (2017).
19. Bycroft, C. et al. The UK Biobank resource with deep phenotyping and genomic data. Nature 562, 203–209. https: //doi.org/10.1038/
s41586-018-0579-z (2018).
20. Watanabe, K. et al. A global overview of pleiotropy and genetic architecture in complex traits. Nat. Genet. 51, 1339–1348. https://
doi.org/10.1038/s41588-019-0481-0 (2019).
21. Consortium, G. P. et al. A global reference for human genetic variation. Nature 526, 68–74. https://doi.org/10.1038/nature15393
(2015).
22. Kircher, M. et al. A general framework for estimating the relative pathogenicity of human genetic variants. Nat. Genet. 46, 310–315.
https://doi.org/10.1038/ng.2892 (2014).
23. van der Wijst, M. G. P. et al. Single-cell RNA sequencing identifies celltype-specific cis-eQTLs and co-expression QTLs. Nat. Genet.
50, 493–497. https://doi.org/10.1038/s41588-018-0089-9 (2018).
24. Schmiedel, B. J. et al. Impact of genetic polymorphisms on human immune cell gene expression. Cell 175, 1701–1715. https://doi.
org/10.1016/j.cell.2018.10.022 (2018).
25. Zhernakova, D. V. et al. Identification of context-dependent expression quantitative trait loci in whole blood. Nat. Genet. 49,
139–145. https://doi.org/10.1038/ng.3737 (2017).
26. Aguet, F. et al. The GTEx Consortium atlas of genetic regulatory effects across human tissues. bioRxiv https: //doi.org/10.1101/78790
3 (2019).
27. MacArthur, J. et al. The new NHGRI-EBI Catalog of published genome-wide association studies (GWAS Catalog). Nucleic Acids
Res. 45, D896–D901. https://doi.org/10.1093/nar/gkw1133 (2017).
28. Kutmon, M. et al. WikiPathways: capturing the full diversity of pathway knowledge. Nucleic Acids Res. 44, D488-494. https://doi.
org/10.1093/nar/gkv1024 (2016).
29. Liberzon, A. et al. Molecular signatures database (MSigDB) 3.0. Bioinformatics 27, 1739–1740. https: //doi.org/10.1093/bioinf orma
tics/btr260 (2011).
30. Haynes, W. In Encyclopedia of Systems Biology (eds Dubitzky, W., Wolkenhauer, O., Cho, K. H. & Yokota, H.) 78 (Springer, New
York, 2013).
31. Zheng, J. et al. LD Hub: a centralized database and web interface to perform LD score regression that maximizes the poten-
tial of summary level GWAS data for SNP heritability and genetic correlation analysis. Bioinformatics 33, 272–279. https://doi.
org/10.1093/bioinformatics/btw613 (2017).
32. Lake, R. I., Thomas, S. J. & Martin, N. G. Genetic factors in the aetiology of mouth ulcers. Genet. Epidemiol. 14, 17–33. https://doi.
org/10.1002/(SICI)1098-2272(1997)14:13.0.CO;2-2 (1997).
33. Albanidou-Farmaki, E., Markopoulos, A. K., Kalogerakou, F. & Antoniades, D. Z. Detection, enumeration and characterization
of T helper cells secreting type 1 and type 2 cytokines in patients with recurrent aphthous stomatitis. Tohoku J. Exp. Med. 212,
101–105. https://doi.org/10.1620/tjem.212.101 (2007).
34. Lewkowicz, N., Lewkowicz, P., Banasik, M., Kurnatowska, A. & Tchorzewski, H. Predominance of Type 1 cytokines and decreased
number of CD4(+)CD25(+high) T regulatory cells in peripheral blood of patients with recurrent aphthous ulcerations. Immunol.
Lett. 99, 57–62. https://doi.org/10.1016/j.imlet.2005.01.002 (2005).
35. Lewkowicz, N., Kur, B., Kurnatowska, A., Tchorzewski, H. & Lewkowicz, P. Expression of Th1/Th2/Th3/Th17-related genes in
recurrent aphthous ulcers. Arch. Immunol. Ther. Exp. (Warsz) 59, 399–406. https://doi.org/10.1007/s00005-011-0134-1 (2011).
36. Gomes, C. C., Gomez, R. S., Zina, L. G. & Amaral, F. R. Recurrent aphthous stomatitis and Helicobacter pylori. Med. Oral Patol.
Oral Cir. Bucal 21, e187-191. https://doi.org/10.4317/medoral.20872 (2016).
37. Stehlikova, Z. et al. Oral microbiota composition and antimicrobial antibody response in patients with recurrent aphthous sto-
matitis. Microorganisms https://doi.org/10.3390/microorganisms7120636 (2019).
Acknowledgements
This study was supported by the National Natural Science Foundation of China (81501336), the Science and
Technology Research Project of Henan Province (172102310295) and Henan Medical Science and technology
Project (2018020389).
Author contributions
H.W. designed the study. C.C. provided valuable suggestions for our manuscript and revised this article. X.J.
wrote the manuscript. Y.W. and X.Z. collected the data. W.Z. conducted statistical analysis.
Competing interest
The authors declare no competing interests.
Additional information
Supplementary information is available for this paper at https://doi.org/10.1038/s41598-020-68976-2.
Correspondence and requests for materials should be addressed to H.W. or C.C.
Reprints and permissions information is available at www.nature.com/reprints.
Scientific Reports | (2020) 10:12205 | https://doi.org/10.1038/s41598-020-68976-2 8
Vol:.(1234567890)www.nature.com/scientificreports/
Publisher’s note Springer Nature remains neutral with regard to jurisdictional claims in published maps and
institutional affiliations.
Open Access This article is licensed under a Creative Commons Attribution 4.0 International
License, which permits use, sharing, adaptation, distribution and reproduction in any medium or
format, as long as you give appropriate credit to the original author(s) and the source, provide a link to the
Creative Commons license, and indicate if changes were made. The images or other third party material in this
article are included in the article’s Creative Commons license, unless indicated otherwise in a credit line to the
material. If material is not included in the article’s Creative Commons license and your intended use is not
permitted by statutory regulation or exceeds the permitted use, you will need to obtain permission directly from
the copyright holder. To view a copy of this license, visit http://creativecommons.org/licenses/by/4.0/.
© The Author(s) 2020
Scientific Reports | (2020) 10:12205 | https://doi.org/10.1038/s41598-020-68976-2 9
Vol.:(0123456789)You can also read