Identification of novel cell glycolysis related gene signature predicting survival in patients with breast cancer
←
→
Page content transcription
If your browser does not render page correctly, please read the page content below
www.nature.com/scientificreports
OPEN Identification of novel cell
glycolysis related gene signature
predicting survival in patients
with breast cancer
Feng Jiang1,5, Chuyan Wu2,5, Ming Wang3, Ke Wei4 & Jimei Wang1*
One of the most frequently identified tumors and a contributing cause of death in women is breast
cancer (BC). Many biomarkers associated with survival and prognosis were identified in previous
studies through database mining. Nevertheless, the predictive capabilities of single-gene biomarkers
are not accurate enough. Genetic signatures can be an enhanced prediction method. This research
analyzed data from The Cancer Genome Atlas (TCGA) for the detection of a new genetic signature
to predict BC prognosis. Profiling of mRNA expression was carried out in samples of patients with
TCGA BC (n = 1222). Gene set enrichment research has been undertaken to classify gene sets that
vary greatly between BC tissues and normal tissues. Cox models for additive hazards regression were
used to classify genes that were strongly linked to overall survival. A subsequent Cox regression
multivariate analysis was used to construct a predictive risk parameter model. Kaplan–Meier survival
predictions and log-rank validation have been used to verify the value of risk prediction parameters.
Seven genes (PGK1, CACNA1H, IL13RA1, SDC1, AK3, NUP43, SDC3) correlated with glycolysis were
shown to be strongly linked to overall survival. Depending on the 7-gene-signature, 1222 BC patients
were classified into subgroups of high/low-risk. Certain variables have not impaired the prognostic
potential of the seven-gene signature. A seven-gene signature correlated with cellular glycolysis was
developed to predict the survival of BC patients. The results include insight into cellular glycolysis
mechanisms and the detection of patients with poor BC prognosis.
Abbreviations
BC Breast cancer
TCGA The cancer Genome Atlas
GSEA Gene set enrichment analysis
OS Overall survival
MsigDB Molecular Signatures Database
GLUT1 Glucose transporter type 1
GLUT3 Glucose transporter type 3
ER Estrogen receptor
HER2 Human epidermal growth factor receptor 2
HPSE Heparanase
MAP3K1 Mitogen-activated protein kinase kinase kinase 1
Breast cancer is the world’s most prevalent form of cancer with high morbidity1,2. According to Global Cancer
Statistics 2018, there will be nearly 2.1 million new cases diagnosed globally and approximately 62,000 deaths.
1
Department of Neonatology, Obstetrics and Gynecology Hospital of Fudan University, No. 419, Fangxie Road,
Shanghai 200011, China. 2Department of Rehabilitation Medicine, The First Affiliated Hospital of Nanjing
Medical University, Nanjing 210029, China. 3Plastic Surgery Department, The First Affiliated Hospital of Nanjing
Medical University, Nanjing 210029, China. 4Medical Department, The First Affiliated Hospital of Nanjing Medical
University, Nanjing 210029, China. 5These authors contributed equally: Feng Jiang and Chuyan Wu. *email:
wjm821920@163.com
Scientific Reports | (2021) 11:3986 | https://doi.org/10.1038/s41598-021-83628-9 1
Vol.:(0123456789)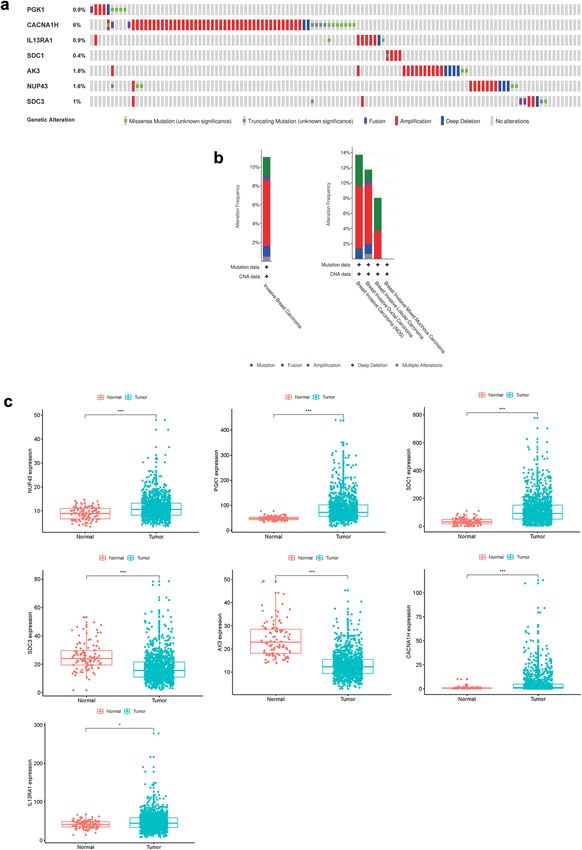
www.nature.com/scientificreports/
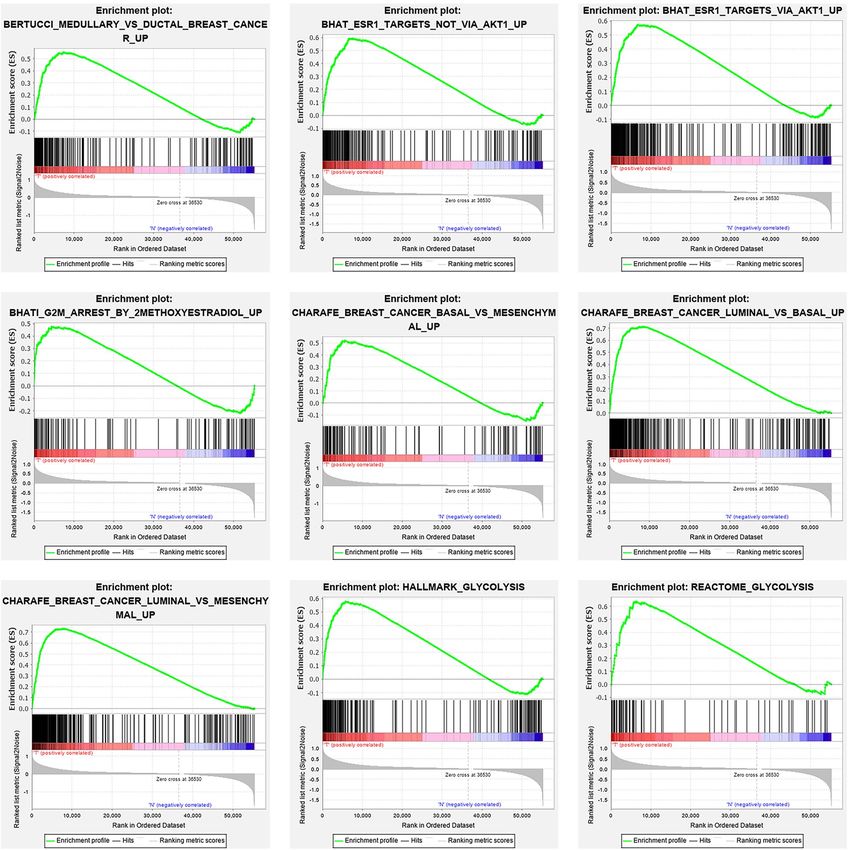
GS follow link to MSigDB Size ES NOM p value Rank at MAX
Medullary ductal 202 0.56 0.035 7425
ESR1 targets not via AKT1 211 0.59 < 0.001 7548
ESR1 targets via AKT1 279 0.57 0.002 6697
G2M arrest 117 0.47 0.01 4359
BC basal 123 0.52 0.011 5593
BC luminal basal 379 0.71 < 0.001 8605
BC luminal mesenchymal 447 0.73 < 0.001 7859
HA glycolysis 199 0.58 < 0.001 5817
RE glycolysis 71 0.64 < 0.001 6296
Table 1. Gene sets enriched in Breast cancer.
Patients with the same development will therefore have varying prognoses and treatment r eactions3,4. Efficient
BC biomarkers must also be discovered to assess prognoses and classify potential patients with elevated BC risk.
Many biomarkers for BC, such as ER and HER2, have been established5,6. Scientists have built various patient
genome repositories through developments in high-performance sequencing to help them recognize genetic
shifts more s ystematically7,8. Through database mining, we have identified thousands of biomarkers that could
interact with the prognosis of tumor patients. Consequently, the predictive power of single-gene biomarkers
is also inadequate. Work has also shown that determining the genetic properties of many genes will improve
prediction9,10. More precise treatment approaches may be driven by multigenic prognostic characteristics from
primary tumor biopsy. The latest studies also analyzed the role of multiple-gene signatures on BC for prognosis
evaluation and for the detection of potentially high BC risk p atients11,12.
In this research, genes were identified by doing gene set enrichment analysis (GSEA). In order to classify
biomarkers, differential analytics usually include analyzing variations in expression between groups with a focus
on genes with substantially controlled rates of e xpression13. However, this approach can effectively remove genes
that do not display significant variations in expression, which do provide essential biological knowledge or
demonstrate biological value. In order to check cumulative expression of multiple genes, GSEA as an upcoming
computational tool will not involve a specific distinct gene threshold or comprehensive expertise. This shows
general data patterns. This method thus strengthens the comparative study of biological expression and biologi-
cal relevance14.
Accordingly, in this research, we have been analyzing details from the Cancer Genome Atlas (TCGA) in order
to establish a specific genetic signature for BC forecasting. In order to map the marker genome of 1222 patients
with BC, we used mRNA expression results from TCGA. In order to accurately predict patient results, we find
251 mRNAs that are substantially linked to glycolysis and established a seven-gene risk profile. Interestingly,
glycolysis risk factors may be used to accurately determine the prognosis of high-risk patients. The gene signature
linked to a novel cell glycolysis was identified and validated.
Methods
Patient clinical and mRNA expression data collection. We collected clinical evidence and profiles of
mRNA expression for TCGA (https://cancergenome.nih.gov/) breast cancer patients. The research included clin-
ical details from 1222 patients and the age, sex, step, T-classification, N-classification, M-classification (Table 1).
Gene set enrichment analysis. We carried out GSEA (http://www.broadinstitute.org/gsea/index.jsp) to
decide if the gene sets found varied greatly between the BC and normal groups. Then the expression levels of
56,753 mRNAs in BC and neighboring noncancerous tissues were examined. Ultimately, we marked the func-
tions for further study with normalized p values (p < 0.05).
Data analysis and estimation of risk parameters. RNA expression were downloaded from the TCGA
data portal. Univariate Cox regression study was used to classify genes that were then exposed to multivariate
Cox regression to validate prognostic genes and obtain the coefficient. The identified mRNAs were subsequently
divided into risky form and protective (0 < HR < 1) sort (hazards ratio, HR > 1). We built a risk-parameter func-
tion as follows by a linear combination of expression values of filtered genes weighted by their coefficients: Risk
Parameter = (βn * expression of gene n). The 1222 patients were classified by the median risk criterion into high-
risk and low-risk subgroups.
Statistical analysis. We used the survival curves of Kaplan–Meier and the log-rank test to approximate the
significance of the risk parameter. We performed multivariate analyzes of the Cox and data stratification to check
if age, stage, T-classification, N-classification, or M-classification of the risk parameter is independent of clinical
features used as covariates. Statistically significant was a p < 0.05. Statistical research was carried out using the
program SPSS 19.0 (SPSS, Inc., Chicago, IL, USA).
Scientific Reports | (2021) 11:3986 | https://doi.org/10.1038/s41598-021-83628-9 2
Vol:.(1234567890)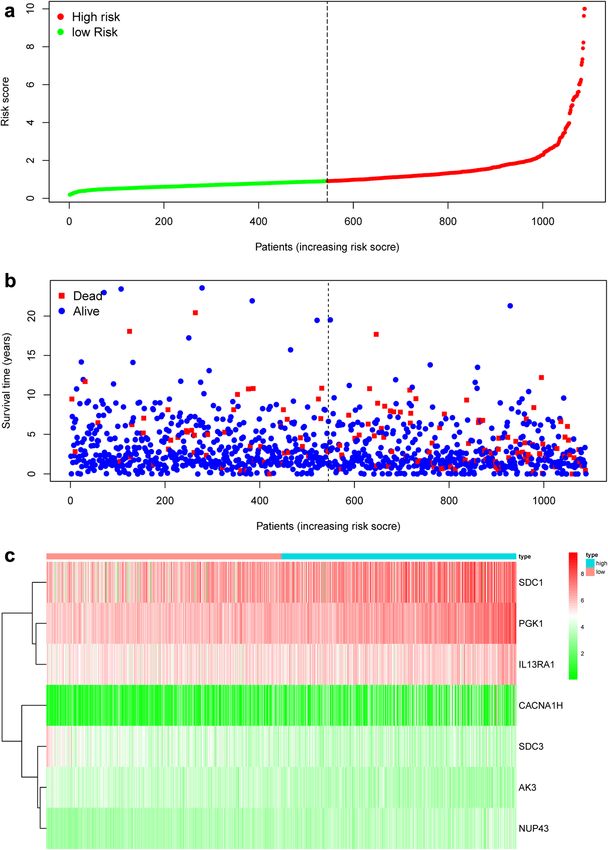
www.nature.com/scientificreports/

                                  Figure 1.  enrichment of nine gene sets with major variations between BC tissues and noncancerous tissues by
                                  GSEA.

                                  Consent for publication. All listed authors took part actively in the research and read and approved the
                                  manuscript submitted.

                                  Results
                                  Primary GSEA gene screening. We collected clinical features of 1222 BC patients along with expression
                                  details from a TCGA sample of 56,753 mRNAs. We conducted GSEA to decide if the genes found varied sub-
                                  stantially between BC tissues and normal tissues. We validated 25 gene sets that were upregulated in BC. 9 gene
                                  sets, Medullary ductal, ESR1 targets not via AKT1, ESR2 targets via AKT1, G2M arrest, BC basal, BC luminal
                                  basal, BC luminal mesenchymal, HA glycolysis, RE glycolysis were significantly enriched (Table 1; Fig. 1). We
                                  then filtered the top-ranking function, glycolysis (p < 0.001), among 276 genes for further study.

                                  Identification of survival linked mRNAs related to glycolysis. First, the univariate Cox regression
                                  study of 276 genes was performed for preliminary screening, and 251 genes were generated (p < 0.05). Then, a
                                  multivariate Cox Regression analysis was conducted to further analyze the relationship between the 251 mRNA
                                  expression and patient survival profiles and to classify the most important mRNA combinations using the step-
                                  wise elimination process. 251 mRNAs were verified and 7 ((PGK1, CACNA1H, IL13RA1, SDC1, AK3, NUP43,

Scientific Reports |   (2021) 11:3986 |               https://doi.org/10.1038/s41598-021-83628-9                                                 3

                                                                                                                                          Vol.:(0123456789)
www.nature.com/scientificreports/
mRNA Ensemble ID Location B(Cox) HR p
PGK1 ENSG00000102144 chr X: 78104248–78129295 0.006297 1.006317 < 0.0001
CACNA1H ENSG00000196557 chr 16: 1153106–1221772 0.013659 1.013753 0.0154
IL13RA1 ENSG00000131724 chr X: 118726954–118794533 0.006425 1.006446 0.0102
SDC1 ENSG00000115884 chr 2: 20200797–20225433 0.002093 1.002095 0.0024
AK3 ENSG00000147853 chr 9: 4709556–4742043 − 0.02549 0.974832 0.0422
NUP43 ENSG00000120253 chr 6: 149724315–149746529 0.043829 1.044804 0.0011
SDC3 ENSG00000162512 chr 1: 30869466–30909735 − 0.0225 0.977754 0.0247
Table 2. The detailed information of seven prognostic mRNAs significantly associated with overall survival in
patients with breast cancer.
SDC3)) of the 251 mRNAs were validated as independent BC prediction markers. The filtering mRNA is divided
into risky type (PGK1, CACNA1H, IL13RA1, SDC1, NUP43), with poorer survival associated HR > 1 as well as
the protective type (AK3, SDC3) with better survival associated HR < 1 (Table 2).
The differences in 7 filtered genes were then analyzed with the study of 996 BC samples from cBioPortal
(http://cbioportal.org). The findings found that 110 (11.04%) of the sequenced cases changed the queried genes.
The PGK1 gene included 3 amplification samples, 1 deep deletion samples, 4 mutation samples, and 1 sample
with fusion. The CACNA1H gene was altered in 5.72% of cases, showing various changes. The IL13RA1 gene
was altered in 0.9% of cases. The SDC1 gene was altered in 0.4% of cases. The AK3 gene was altered in 1.81% of
cases, and the NUP43 and SDC3 genes were altered in 1.61% and 1% of cases, respectively (Fig. 2a).
Relevant variations in the selected genes is important in some forms of cancer. 4.11% of variations in invasive
breast carcinoma (NOS) were mutations, 8.22% were amplifications, and 1.37% were deep deletions. In breast
invasive ductal carcinoma, 1.48% of changes were mutations, 0.54% were fusions, 7.69% were amplifications,
1.35% were deep deletions and 0.67% were multiple alterations. In breast invasive lobular carcinoma, Mutation
was the most eminent alteration (Fig. 2b).
The expression variations of seven genes were also related across adjacent normal tissues (n = 113) (wilcoxon
test was used to test the differential gene expression). We find that the expression rates of the 7 genes in BC tis-
sues were substantially enhanced or decreased (Fig. 2c).
Creating a seven‑mRNA signature to forecast patient results. We have developed the fol-
lowing prognostic risk-parameter formula by linearly combining the expression values of selected genes
weighed by their coefficients from the multivariate Cox regression analysis. Risk parameter = 0.8585 * expres-
sion of PGK1 + 2.4005 * expression of CACNA1H + 0.1947 * expression of IL13RA1 + 1.8067 * expression of
SDC1 + 0.3409 * expression of NUP43 − 0.8953 * expression of AK3 − 0.5676 * expression of SDC3. We calcu-
lated parameters and assigned one risk parameter to each patient. We measured parameters and allocated each
patient one risk parameter. We then separated patients into high-risk and low-risk subgroups with the median in
an upwards order (Fig. 3a). In estimating survival in BC cases, Time-dependent ROC curve analysis according
to the 5-year survival of the area under the AUC value was 0.735 (Fig. 4), showing good prognostic performance
in predicting survival. Each patient’s survival time as shown in Fig. 3b. The high-risk parameter participants
reported fewer survival, while the low-risk parameter cases recorded fewer mortality. In comparison, a heat map
shows 7 mRNAs expression profiles (Fig. 3c). Compared to the low-risk group, the expression level of risky-type
mRNA (PGK1, CACNA1H, IL13RA1, SDC1, NUP43) was higher in the high-risk group. In contrast, the expres-
sion level of high-risk group (AK3, SDC3) was lower than that in the low-risk group.
Seven‑mRNA signature risk parameter is an independent prognostic predictor. Through uni-
variate and multivariate regression we were contrasting the prognostic significance of the risk factors with the
factors in clinical pathology (Table 3). Samples have been chosen with well established clinical data. Among the
914 patients, 98.8% were female. Among the 914 patients, 75.9% had stage I–II disease, and the remaining 24.1%
patients had stage III–IV disease. Among 914 patients, 85.1% patients had I–II T classification, 49.3% had N0
classification and 98.1% had M0 classification. Based on the data given above, we have defined risk parameters,
age, stage, T-classification, N-classification and M-classification as independent prediction indicators, as these
variables indicated significant differences in univariate analysis and age, the stage showed significant differences
in multivariable analysis (Table 4; Fig. 5). In fact, there were important prognostic values of p < 0.05 (HR = 1.333)
in risk parameters.
Verification of seven‑mRNA signature by K‑M survival predictions for prognosis. K-M survival
estimates and a log-rank study showed a poor prognosis for patients in the high-risk group (Fig. 6a). Univari-
ate Cox OS regression analysis reported several clinicopathologic parameters that predict BC survival, such as
age, stage, T classification, N classification and M classification. In order to validate the above conclusions, we
then used Kaplan–Meier survival estimates, which gave clear findings. Patients older than 66 years with disease
stage III–IV were associated with poor prognosis (Fig. 6b). These results further confirmed the reliability of the
analysis.
Scientific Reports | (2021) 11:3986 | https://doi.org/10.1038/s41598-021-83628-9 4
Vol:.(1234567890)www.nature.com/scientificreports/
Figure 2. Identification of patient survival mRNAs. (a) Alteration of the selected genes in clinical samples.
(b) Modification of chosen genes in various pathological forms of BC. (c) Multiple expression of seven genes
selected.
Further stratified analysis was performed for data mining. As shown from the K–M curve, regardless of stage,
T classification, N classification and M classification, the 7-mRNA signature was a stable prognostic marker for
breast cancer patients who were in the high-risk group and had a poor prognosis (Fig. 7a–c). However, When
Scientific Reports | (2021) 11:3986 | https://doi.org/10.1038/s41598-021-83628-9 5
Vol.:(0123456789)www.nature.com/scientificreports/
Figure 3. The risk parameter-associated seven-mRNA signature predicts OS in patients with breast cancer. (a)
The distribution of risk parameter of mRNA in each patient. (b) Survival days of BC patients with increasing
risk parameters. (c) A heatmap of the expression profile of seven genes. Red indicates upregulated genes and
light green indicates downregulated genes.
patients with BC are divided into two subgroups by age (> 65 or ≤ 65 years) and M classification, however, the
risk parameter could no longer be used separately as the prognostic predictor for the age of ≤ 66 years (Fig. 7e)
subgroup and M1 subgroup (Fig. 7d). We also download GSE25066 datasets from the GEO database, for each
gene included in our research, we divided the dataset into high level group and low level group, we observed
that high level of AK3, CACNA1H, IL13RA1, SDC3 had better prognosis, but low level of PGK1 and SDC1 had
poor prognosis. There was no significant difference between high and low lever group of NUP43 (Fig. S1). More
analysis is needed here.
Discussion
The latest findings have found that clinical anatomy, including age and metastatic diagnosis, is not adequate
to accurately determine the outcome of cancer p atients15. An increasing number of mRNAs were shown to be
tumor development biomarkers or prognosis, and the therapeutic significance of the biomarkers was a ssessed16,17.
For e.g., Shao et al. confirmed that low expression of DKK2 is an independent prognostic biomarker of shorter
Scientific Reports | (2021) 11:3986 | https://doi.org/10.1038/s41598-021-83628-9 6
Vol:.(1234567890)www.nature.com/scientificreports/
Figure 4. Time-dependence ROC curve according to the 5-year survival of the area under the AUC value.
Clinical pathological parameters N % Dead number
Age
≥ 66 243 26.6 193
< 66 671 73.4 597
Gender
Female 903 98.8 780
Male 11 1.2 10
Stage
I–II 694 75.9 622
III–IV 220 24.1 168
T classification
I–II 778 85.1 688
III–IV 136 14.9 102
N classification
N0 451 49.3 410
N1–3 463 50.7 380
M classification
M0 897 98.1 786
M1 17 1.9 4
Table 3. Clinical pathological parameters of patients with Breast cancer in this study.
Univariate analysis Multivariate analysis
Clinical feature Number HR 95%CI of HR p value HR 95%CI of HR p value
Risk parameter (high-risk/low-risk) 544/545 1.395 1.253–1.553 < 0.001 1.333 1.183–1.503 < 0.001
Age (≥ 66/< 66) 319/769 1.035 1.02–1.05 < 0.001 1.035 1.02–1.051 < 0.001
Stage (I–II/III–IV) 799/266 2.166 1.713–2.738 < 0.001 1.808 1.095–2.984 0.021
T (I–II/III–IV) 909/176 1.544 1.245–1.915 < 0.001 0.918 0.688–1.225 0.561
N (0/1–3) 512/556 1.7 1.412–2.047 < 0.001 1.14 1.183–1.503 0.369
M (0/1) 900/22 6.419 3.6–11.446 < 0.001 1.367 0.595–3.137 0.461
Table 4. Univariable and multivariable analyses for each clinical feature.
Scientific Reports | (2021) 11:3986 | https://doi.org/10.1038/s41598-021-83628-9 7
Vol.:(0123456789)www.nature.com/scientificreports/
Figure 5. Forest plot of multivariate COX regression analysis.
progression-free survival in breast cancer p atients18. Cox multivariate study of the proportional frequency
regression model was often used to check that elevated tumor protein HPSE expression patients had improved
outcomes, and this protein was also deemed a prognostic predictor for gastric cancer p atients19. Nevertheless,
these biomarkers were also not adequate to assess patient prognoses independently20. In particular, several
variables may influence the rates of single gene expression that preclude the use of such measures as accurate
and independent prognostic measures. A mathematical model consisting of genetic markers for several associ-
ated genes was therefore used in tandem with the predictive effects of each variable gene in order to enhance
prediction21. When determining the prognosis of tumor patients, the model is significantly more reliable than
utilizing standard biomarkers, which results when extensive usage of the model.
The accelerated advancement of high-performance genetic sequencing technologies established the founda-
tion for large-scale biological data analysis. Huge amounts of genomics were collected to classify novel diag-
nostic, prognostic and pharmacological biomarkers by human specimens. A modern prognostic signature has
been developed in recent research utilizing microarray and RNA sequence evidence for rates of gene expression
or mutations. For detection and testing, a Cox proportional hazards regression model was used. In the current
analysis, 9 roles with substantial variations in GSEA were established. As mentioned above, we have chosen the
top-ranking feature to filter genes relating to patient survival prediction instead of large-scale discovery. The study
of Cox Regression Univariate and Multivariate was conducted to assess the prognostic significance of the seven
gene combination for BC patients. This selected risk profile can be more specific and powerful for predicting posi-
tive clinical results and can be a tool for classifying BC patients than other known prognostic evaluation markers.
In this research, bioinformatics approaches were used to examine the features and clinical significance of the
mRNA risk factors and to test a new way of identifying possible prognostic markers. This work complements
BC’s earlier interpretation and offers a framework for potential BC studies. In TCGA, we used the BC data col-
lection to gather genes linked to glycolysis and to compare the standard and BC tissue results. Kaplan–Meier
survival estimates revealed that patients with low-risk parameters had a better prognosis. For BC cases, risk
parameter identification and estimation have important clinical consequences. Nevertheless, we could only use
OS to determine patient prognosis due to lack of patient metastasis and recurrence details in the TCGA database,
which is one drawback of our work. In addition, the risk parameter may forecast the prognosis of BC patients
in all subgroups, except in subgroups of < 66 years of age, in stratified studies. There is no obvious explanation
why this disparity needs further analysis.
Uncontrolled cell proliferation characterizes the tumor and not only lacks cell cycle regulation, but facilitates
the metabolism of cell-energy and eventually contributes to tumor cell growth and differentiation. Cellular energy
is extracted primarily from the oxidation of sugar, and ATP provides much electricity. In the 1920s, the German
scientist Otto Warburg noticed defects in hepatoma cell energy metabolism22. When oxygen is available, tumor
cells mainly depend on metabolism for glycolysis and use vast amounts of glucose followed by the develop-
ment of lactic acid23,24. This condition was called an aerobic glycolysis or a Warburg effect of irregular glucose
metabolism. Studies have shown that tumor cells may control ATP synthesis precisely by controlling the uptake
of substrate and glycolysis-related enzymes to allow them to respond rapidly to the nutrient microenvironment,
fulfill the energy and nutrients requirements for malignant p roliferation25. Therefore, cancer metabolism, which
is directly linked to the Warburg effect, plays a significant role in the conservation of the relationship between
the oxygen sensor and the signal system of the nutrient sensor26. This indicates that aerobic glycolysis requires
a complex action system. The proliferation of tumor cells continues at a pace beyond cellular capacity, and thus
excessive cell intake of oxygen or nutrients will contribute to a hypoxic and low-sugar and acidic tumor micro-
environment which is more prominent in large tumors. While not all tumors have the Warburg effect, cellular
energy defects are well-known to be a characteristic of tumor cells27. The Warburg influence has emerged in
multiple malignant cancers, such as lung cancer, prostate cancer, pancreatic cancer and colon cancer, following
more than 90 years of continuing study and testing. Recent findings have shown that aerobic glycolysis plays a
significant function in the growth of BC28. Metabolism in BC cells showed a higher glycolysis rate and a lower
glucose oxidation rate. The GLUT6 transportation and glycolytic-lipogenic metabolism will depend on tumor
cells in order to function. Highly segregated BC showed substantially fewer expression of GLUT1 and GLUT3
Scientific Reports | (2021) 11:3986 | https://doi.org/10.1038/s41598-021-83628-9 8
Vol:.(1234567890)www.nature.com/scientificreports/
Figure 6. Kaplan–Meier survival study in TCGA data set for BC patients. (a) K–M survival curve for high/low
risk BC patients. (b) Age, Stage, T-classification, N-classification and M-classification features involve patients
survival in clinical features.
than poorly segregated t umors29. Several experiments also estimated the longevity of BC patients utilizing cel-
lular glycolysis-associated genes. MAP3K1 elimination, for example, essentially stops the growth and creation
of BC30. The presentation of HPSE is a closely correlated independent prognostic predictor of weak prognosis
in BC. However, gene markers associated with glycolysis have not been established to predict BC prognosis.
Using bioinformatics techniques, we calculated and demonstrated its prognostic significance in BC for the
genetic characteristics linked to cellular glycolysis (PGK1, CACNA1H, IL13RA1, SDC1, AK3, NUP43, SDC3).
The PGK1 gene provides suggestions for the formation of an enzyme kinase phosphoglycerate. This enzyme is
Scientific Reports | (2021) 11:3986 | https://doi.org/10.1038/s41598-021-83628-9 9
Vol.:(0123456789)www.nature.com/scientificreports/
Figure 7. Kaplan–Meier curves for the prognostic value of the signature of risk parameter in each clinical
feature for the patients. (a) Age, (b) stage, (c) T classification, (d) N classification, (e) M classification.
present in the human body in cells and tissues, and is involved in a vital energy processing mechanism called
glycolysis. Papandreou et al. demonstrated hypoxic adaptation, which reduced mitochondrial oxygen intake by
downstream HIF activation of PDK1 in addition to an improved production of glycolytic e nzymes31. CACNA1H
modulates Ca2+ levels and the synaptic vesicle cycle but the mechanism related to glycolysis is still unknown.
Other genes IL13RA1, SDC1, AK3, NUP43, SDC3 were all enriched in glycolysis, but the mechanisms need to
be further investigated.
Scientific Reports | (2021) 11:3986 | https://doi.org/10.1038/s41598-021-83628-9 10
Vol:.(1234567890)www.nature.com/scientificreports/
Conclusion
We established a seven-gene risk profile linked to cell glycolysis that predicts the prognosis for BC patients with
an elevated risk parameter that suggests a poorer statement. In clinical practice, the signature can be used as a
tool. Such studies give insight into the processes of cellular glycolysis and classify poor BC prognosis patients..
Data availability
The generated and analyzed datasets of the current research are available in TCGA (http://cancergenome.nih.
gov/abouttcga) and cBioPortal.
Received: 11 May 2020; Accepted: 5 February 2021
References
1. Siegel, R. L., Miller, K. D. & Jemal, A. Cancer statistics, 2020. CA Cancer J. Clin. 70, 7 (2020).
2. Miller, K. D. et al. Cancer treatment and survivorship statistics, 2016. CA Cancer J. Clin. 66, 271 (2016).
3. Rakha, E. A. et al. Breast cancer prognostic classification in the molecular era: the role of histological grade. Breast Cancer Res. 12,
207 (2010).
4. Schwartz, A. M., Henson, D. E., Chen, D. & Rajamarthandan, S. Histologic grade remains a prognostic factor for breast cancer
regardless of the number of positive lymph nodes and tumor size: a study of 161 708 cases of breast cancer from the SEER Program.
Arch. Pathol. Lab. Med. 138, 1048 (2014).
5. Rochefort, H., Glondu, M., Sahla, M. E., Platet, N. & Garcia, M. How to target estrogen receptor-negative breast cancer?. Endocr.
Relat. Cancer 10, 261 (2003).
6. Hayes, E. L. & Lewis-Wambi, J. S. Mechanisms of endocrine resistance in breast cancer: an overview of the proposed roles of
noncoding RNA. Breast Cancer Res. 17, 40 (2015).
7. Manni, A., Arafah, B. & Pearson, O. H. Estrogen and progesterone receptors in the prediction of response of breast cancer to
endocrine therapy. Cancer Am. Cancer Soc. 46, 2838 (1980).
8. Dowsett, M. et al. Meta-analysis of breast cancer outcomes in adjuvant trials of aromatase inhibitors versus tamoxifen. J. Clin.
Oncol. 28, 509 (2010).
9. Rouzier, R. et al. Multigene assays and molecular markers in breast cancer: systematic review of health economic analyses. Breast
Cancer Res. Treat. 139, 621 (2013).
10. Romero, A. et al. Assessment of Topoisomerase II alpha status in breast cancer by quantitative PCR, gene expression microarrays,
immunohistochemistry, and fluorescence in situ hybridization. Am. J. Pathol. 178, 1453 (2011).
11. Kronenwett, R. et al. Decentral gene expression analysis: analytical validation of the endopredict genomic multianalyte breast
cancer prognosis test. BMC Cancer 12, 456 (2012).
12. Stephens, P. J. et al. The landscape of cancer genes and mutational processes in breast cancer. Nature 486, 400 (2012).
13. Thomas, M. A., Yang, L., Carter, B. J. & Klaper, R. D. Gene set enrichment analysis of microarray data from Pimephales promelas
(Rafinesque), a non-mammalian model organism. BMC Genom. 12, 66 (2011).
14. Subramanian, A. et al. Gene set enrichment analysis: a knowledge-based approach for interpreting genome-wide expression
profiles. Proc. Natl. Acad. Sci. U S A 102, 15545 (2005).
15. Polley, M. Y. et al. Statistical and practical considerations for clinical evaluation of predictive biomarkers. J. Natl. Cancer Inst. 105,
1677 (2013).
16. Garzon, R., Calin, G. A. & Croce, C. M. MicroRNAs in cancer. Annu. Rev. Med. 60, 167 (2009).
17. Morris, K. V. & Mattick, J. S. The rise of regulatory RNA. Nat. Rev. Genet. 15, 423 (2014).
18. Shao, Y. C. et al. Prognostic value of DKK2 from the Dickkopf family in human breast cancer. Int. J. Oncol. 53, 2555 (2018).
19. Soares, M. A. et al. Heparan sulfate proteoglycans may promote or inhibit cancer progression by interacting with integrins and
affecting cell migration. Biomed. Res. Int. 2015, 453801 (2015).
20. Wu, Y., Sarkissyan, M. & Vadgama, J. V. Epithelial–mesenchymal transition and breast cancer. J. Clin. Med. 5, 2 (2016).
21. Ilan, N., Elkin, M. & Vlodavsky, I. Regulation, function and clinical significance of heparanase in cancer metastasis and angiogen-
esis. Int. J. Biochem. Cell. Biol. 38, 2018 (2006).
22. Koppenol, W. H., Bounds, P. L. & Dang, C. V. Otto Warburg’s contributions to current concepts of cancer metabolism. Nat. Rev.
Cancer 11, 325 (2011).
23. Altenberg, B. & Greulich, K. O. Genes of glycolysis are ubiquitously overexpressed in 24 cancer classes. Genomics 84, 1014 (2004).
24. Farah, I. O., Lewis, V. L., Ayensu, W. K. & Cameron, J. A. Therapeutic implications of the Warburg effect assessing the survival of
MRC5 and a549 cell lines upon exposure to honey and d glucose—biomed 2013. Biomed. Sci. Instrum. 49, 101 (2013).
25. Lu, J. The Warburg metabolism fuels tumor metastasis. Cancer Metastasis Rev. 38, 157 (2019).
26. Das, T. P., Suman, S. & Damodaran, C. Induction of reactive oxygen species generation inhibits epithelial–mesenchymal transition
and promotes growth arrest in prostate cancer cells. Mol. Carcinog. 53, 537 (2014).
27. Ye, G. et al. Lamc1 promotes the Warburg effect in hepatocellular carcinoma cells by regulating PKM2 expression through AKT
pathway. Cancer Biol. Ther. 20, 711 (2019).
28. Wu, C. et al. Integrative analysis of disease land omics database for disease signatures and treatments: a bipolar case study. Front.
Genet. 10, 396 (2019).
29. Poeta, M. L. et al. Aberrant promoter methylation of beta-1,4 galactosyltransferase 1 as potential cancer-specific biomarker of
colorectal tumors. Genes Chromosom. Cancer 51, 1133 (2012).
30. Parnell, K. M. et al. Pharmacologic activation of PKM2 slows lung tumor xenograft growth. Mol. Cancer Ther. 12, 1453 (2013).
31. Papandreou, I., Cairns, R. A., Fontana, L., Lim, A. L. & Denko, N. C. HIF-1 mediates adaptation to hypoxia by actively downregu-
lating mitochondrial oxygen consumption. Cell. Metab. 3, 187 (2006).
Author contributions
F.J. and C.W.: Data curation; K.W.: Methodology; F.J.: Software; M.W.: Verification; C.W.: Visualization; F.J. and
C.W.: Writing-original draft; J.W.: Writing-review and editing.
Competing interests
The authors declare no competing interests.
Scientific Reports | (2021) 11:3986 | https://doi.org/10.1038/s41598-021-83628-9 11
Vol.:(0123456789)www.nature.com/scientificreports/
Additional information
Supplementary Information The online version contains supplementary material available at https://doi.
org/10.1038/s41598-021-83628-9.
Correspondence and requests for materials should be addressed to J.W.
Reprints and permissions information is available at www.nature.com/reprints.
Publisher’s note Springer Nature remains neutral with regard to jurisdictional claims in published maps and
institutional affiliations.
Open Access This article is licensed under a Creative Commons Attribution 4.0 International
License, which permits use, sharing, adaptation, distribution and reproduction in any medium or
format, as long as you give appropriate credit to the original author(s) and the source, provide a link to the
Creative Commons licence, and indicate if changes were made. The images or other third party material in this
article are included in the article’s Creative Commons licence, unless indicated otherwise in a credit line to the
material. If material is not included in the article’s Creative Commons licence and your intended use is not
permitted by statutory regulation or exceeds the permitted use, you will need to obtain permission directly from
the copyright holder. To view a copy of this licence, visit http://creativecommons.org/licenses/by/4.0/.
© The Author(s) 2021
Scientific Reports | (2021) 11:3986 | https://doi.org/10.1038/s41598-021-83628-9 12
Vol:.(1234567890)You can also read