Blood Supply - Productivity & - Click to edit Master subtitle style NHSBT Board Jan 2020

Page created by Bernice Powers
 
CONTINUE READING
Blood Supply - Productivity & - Click to edit Master subtitle style NHSBT Board Jan 2020
Blood to
Click         edit Master
          Supply                 title style
                     – Productivity      &
Continuity      of Supply
Click to edit Master subtitle style

NHSBT Board Jan 2020

                                               1
Blood Supply - Productivity & - Click to edit Master subtitle style NHSBT Board Jan 2020
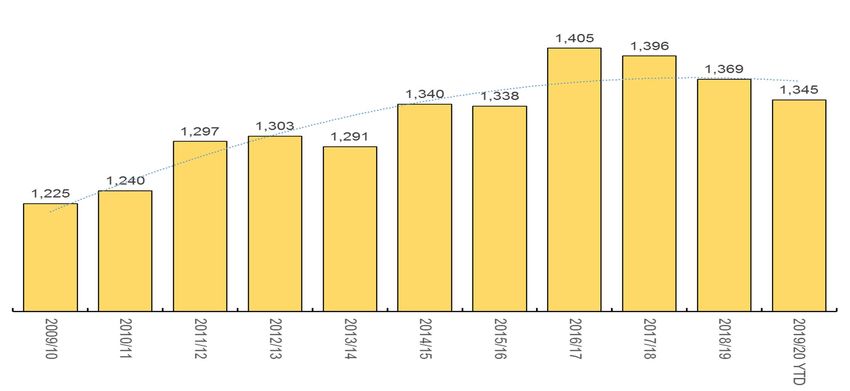
Rationale of Blood Productivity & Capacity Review

  After the request at the November Board to initiate a deep dive into Blood Supply Productivity and Costs at the December Finance Committee, the

  following has been prepared in order to gain alignment at the Executive Team and Board on the way forward and to ensure continuity of supply,

  give context to the current position and propose some potential strategic options going forward.

  The main insights from the December Finance Committee were:

         The central question was whether NHSBT had sufficient blood collection capacity or not.

         Capacity overall has not been an issue with some centres and sessions under-utilised, over collection through Summer / Autumn, high

           stock and declining productivity.

         But with significant under-collection over the last few weeks coming into Winter.

         The capacity question can therefore only be answered through clarity of the operating model and how it flexes to changing donor / staff

           attendance.

         This is anticipated to emerge from the McKinsey work.

  Meanwhile we will also engage with McKinsey around re-imagining the Donor Experience and look to truly invest in process improvement to

  fundamentally change our Blood Supply Operating Model in order to supply the right blood, at the right time in the right place in a safe and

  sustainable way.
Blood Supply - Productivity & - Click to edit Master subtitle style NHSBT Board Jan 2020
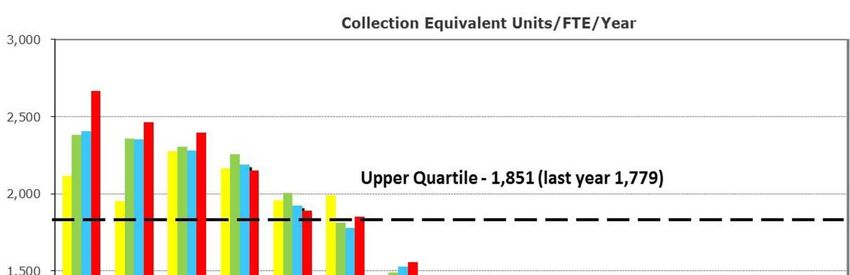
Context: Blood Donation Risks

               “There is a risk that NHSBT fails to collect to demand for blood or
  Strategic
    Risk
               blood components, caused by failure in collections, lack of
               resources, or misalignment of the donor base (current and future)”

    Main          BD-03 Collection of WB is inadequate to meet CPT requirements.
  Collection      BD-07 Impact on Deferrals.
    Risks         BD-09 Collection of Platelets is inadequate to meet CPT requirements.

               Divisional Risk                   Strategic Link
   Main
 Associated    IT and Technology                 IT systems will fail - Brian Henry
 Divisional    Loss of Estate / Venues           Loss of a key facility - Ian Bateman
   Risks
               Staffing Levels                   Insufficient skilled staff - Katherine Robinson

   Horizon        Insufficient (black) Ro donors, meaning more capacity required in London.
  Scanning:       Impact on Ferritin testing, meaning loss of (mainly) female donors.
 Growing and      Continuing rising demand for universal components (O neg red cells, A neg/AB neg platelets).
  Emerging        NHSBT financial horizon coupled with continued forecast demand reduction.
    Risks         Delivery of necessary change, e.g. organisational redesign and Session Solution.
                                                                                                                  3
Blood Supply - Productivity & - Click to edit Master subtitle style NHSBT Board Jan 2020
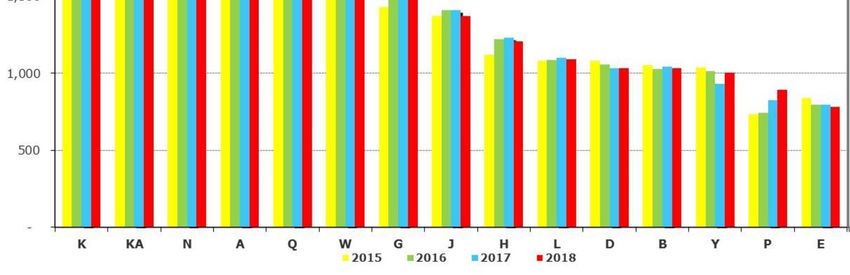
Planned Collection Capacity was raised to help us sail
above the rocks of variation…

                                                                                                                  Planned
                     Change                                                                                      Collection
                     Delivery                                                                                    Capacity
                  (e.g. Session                                                    Late donor
       Nurse /                     Volume of                                      cancellations
    Donor Carer     Solution)         new
                                                                                                    Unfilled
    training time                   donors
                                                              Staffing                            Appointments
                                                 Vehicle     Reductions
            Wastage                                                        Donor        Donor
                                               Breakdowns
  Nurse     (mainly    Equipment                                          Deferrals     DNAs
                                     Venue       & Travel
   break     under-      Issues      Issues     Disruption
  issues    weights)

           … removing and reducing these rocks could help to lower planned
           capacity as we have done successfully in the past.
                                                                                                                              4
Blood Supply - Productivity & - Click to edit Master subtitle style NHSBT Board Jan 2020
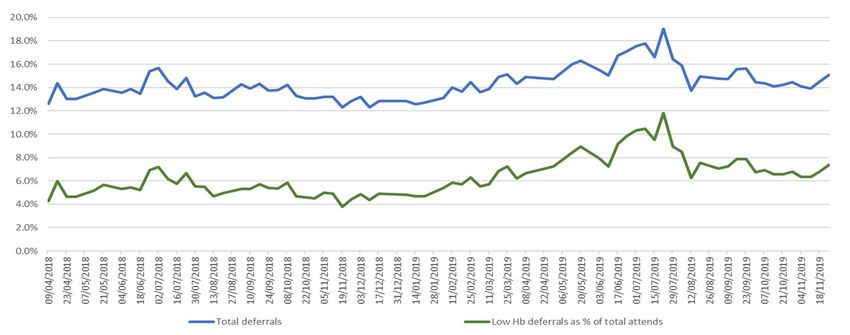
An increase in low Hb deferrals meant that we collected
41.8k units less, requiring an extra c.32 FTE
          Whole Blood Deferrals as a % of Donors Attending (exc. BH and snow weeks)
                                  2018-19                                      2019-20 YTD

     Low Hb deferrals have been c.50% higher over the last 12 months as compared with the previous 12
      months following introduction of capillary Hemocue testing (7.0% of total donor attends vs. 4.6%).
     This meant that over the last 12 months we “lost” c.42k units and required an extra c.32 FTE to deploy
      extra capacity to make-up this loss.                                                                     5
Blood Supply - Productivity & - Click to edit Master subtitle style NHSBT Board Jan 2020
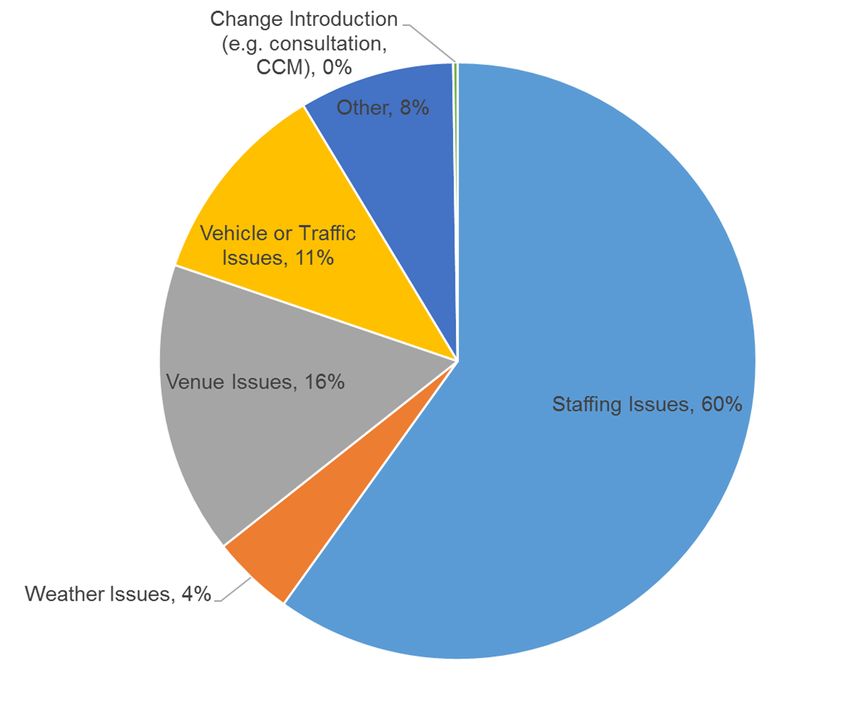
NHSBT-initiated donor cancellations remained a
challenge in 2019
             Appts. cancelled / month 2018 vs. 2019                      Appts. cancelled / month 2018 vs. 2019 (exc. weather related)

                                                                          I left the end November Board with the
                      2018 “Beast from            2018 rise in
                                                                          distinct impression that we were well
                         the East”             “Staffing Issues”
                                                                          stocked and if there was a worry (O
                                                                          Neg apart) then it was that we might
                                                                          have too much blood and so using the
                                                                          oldest first was an important task. NED

   In 2018, we cancelled an average of c.4.9k donors per month as       Excluding weather-related cancellations, in 2018 we cancelled an
    compared with c.3.3k in 2019.                                         average of c.4.1k donors per month, as compared with 3.1k in
   There were two spikes in cancellations during 2018 caused by          2019.
    weather and staffing challenges.
   2019 cancellations have been steadily increasing since April.
Blood Supply - Productivity & - Click to edit Master subtitle style NHSBT Board Jan 2020
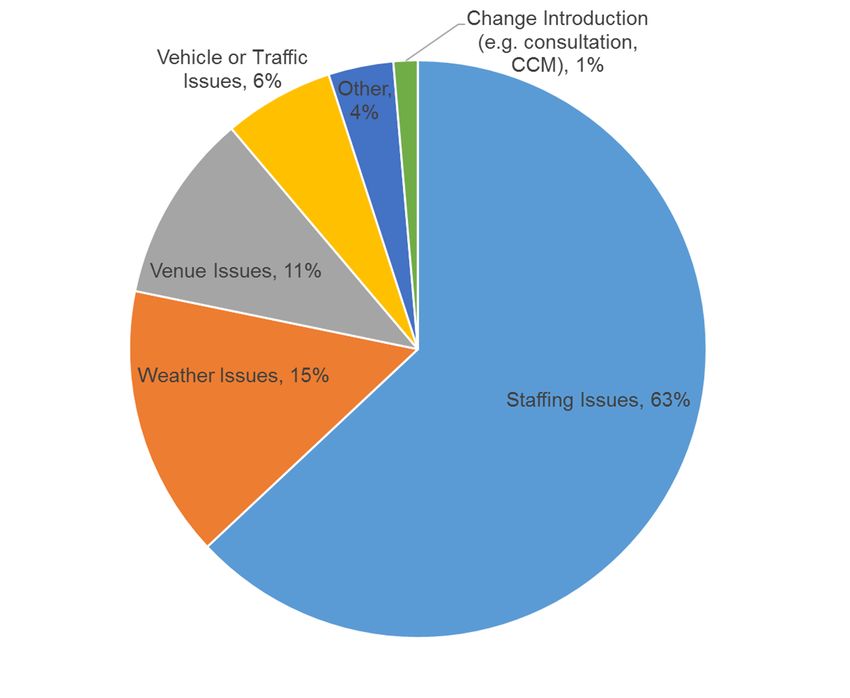
“Staffing Issues” continue to make up the main
reason for donor cancellations at c.60%

   2018 Appointment Cancellations (Jan-Nov)   2019 Appointment Cancellations (Jan-Nov)
Blood Supply - Productivity & - Click to edit Master subtitle style NHSBT Board Jan 2020
After 5-years of decline, Blood Donation Operations
   costs are increasing as compared with last year
                                                                                                                                                      YoY change            Non pay   Pay
                        £70.7m
                                                      £63.6m
                                                                                    £58.6m
                                                                                                                   £56.2m                                                       £55.6m
                                                                                                                                                £54.2m

                         £53.4m
                                                       £48.9m
                                                                                     £45.4m                        £43.7m                                                       £44.2m
                                                                                                                                                 £42.7m

                         £17.4m                        £14.7m                        £13.2m                        £12.5m                        £11.5m                         £11.4m

                         2014-15                       2015-16                       2016-17                       2017-18                       2018-19                    Forecast 2019-20

                                                      -10.1%                          -7.9%                         -4.1%                         -3.5%                          +2.5%

           Up until 2018-19, Blood Donation Operations costs improved year-on-year.
           However, we are forecasting to end 2019-20 with a 2.5% cost increase, driven by an increase in pay
            costs (+£1.5m), despite a continued decline in non-pay costs (-£0.1m).
Note: Excludes hire of halls and equipment budgets transferred to Strategy team in 2016-17. Includes donor records moved from manufacturing to Blood donation in 2017-18.
                                                                                                                                                                                               8
Blood Supply - Productivity & - Click to edit Master subtitle style NHSBT Board Jan 2020
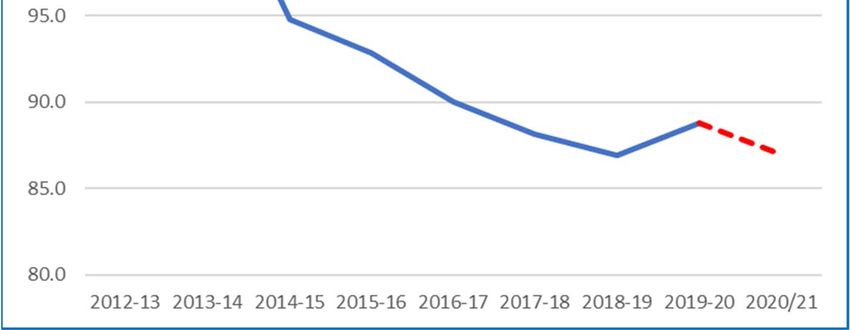
Blood Donation Operations Costs 2018-19
Breakdown by Quarter
Blood Donation Total Costs 2018-19, by Quarter

                                                          Blood Donation
                                                           Operations costs
                                                           increased in 2018-19
                                                           as the year progressed
                                                           and continued to
                                                           increase into 2019-20.

                        +7.0%            +0.7%   +1.4%
Blood Supply - Productivity & - Click to edit Master subtitle style NHSBT Board Jan 2020
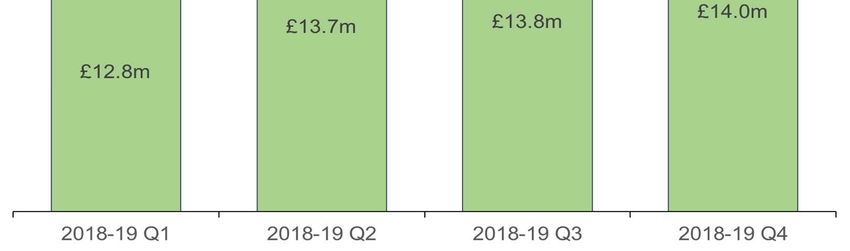
BD operations pay costs reduced year on year, up to
2018-19 when additional staff was put in place
    Number of FTE in BD Operations actual (all staff including management and donor records)
                                                                                       Increase of +150 FTE
                                                                                       against actual budget
                           -3.5%                                                           (1,165 FTEs)
                                          -11.8%                            4.7%
          1,541                                            -4.2%                           -4.3%
                           1,486
                                           1,311                           1,315
                                                           1,256                           1,259

         2014-15         2015-16          2016-17         2017-18         2018-19      Forecast 19-20

     Implementation of several initiatives (detailed in the next slides) enabled year-on-year reductions of
      staffing levels up to 2017-18
     In 2018-19, staffing increased to address the stock challenges (actual 1,315 vs. budget of 1,165 FTE)    10
Initiatives leading to improved Blood Donation
productivity up to 2017-18
Blood Donation productivity. Equivalent units/FTE/year           Consolidated more donations into donor
                                                                 centres and 9 chair sessions with longer   No consolidation and BD
                                                                bleed times and removed a supernumerary        response to stock
          Standardised session operations (OTP model) - 2-3
                                                                    role from session (part of BDOD).        challenge (+£8m into
             years to plan and fully implement (to manage
                                                                                                                    budget)
             collections risk) and another 2 years to realise
          productivity gains due to the commitment to reduce
                  staffing via attrition (no redundancy).

                                                                                                                                      11
BD budget increased by c.£8m in 2019-20, of which
half was in front line operations
Budget to budget change 2019-20 vs. 2018-19. Total Blood Donation. £m
                                                                      +£3.6m      +£0.4m          -£2.2m

                          +£4.0m      +£0.2m      +£0.1m   +£0.2m

                +£1.5m
                                                                Black donor recruitment
                                                                Increase marketing activity to
                   £4m of the c.£8m increase in the
                                                                 support recovery of stocks
                  Blood Donation budget was in front                                                       £78.2m
                                                                Investment in retention/bring
                            line operations
       £70.5m                                                    back lapsed donor

                                                                                                                    12
The increase of £4m in BD budget in 2019-20 was
from an increase of 133 FTE added to front-line Ops
Budget to budget change 2019-20 vs. 2018-19. Total Blood Donation. Number of FTE

                                                                  +10           +1   -3.91
                                     +2            +5

                     +133

                   133 FTE of the 147 FTE added back into the Blood                         1,487
                    Donation budget came from front line operations.
          1,340    Reasons: increase capacity to support stock recovery,
                    increase in HB deferrals (after introduction of Capillary
                    Hemocue), added London capacity and enabling
                    response to nursing break.

                                                                                                     13
Top Quartile EBA Collection Productivity
c.1,850 units/FTE/year

                                            Current top quartile
                                             EBA productivity is
                                             c.1,850
                                             units/FTE/year

                                            NHSBT performance
                           NHSBT
                                             in 2018 was in the
                                             middle of the scale.
                                             Current performance
                                             would need to
                                             improve by more
                                             than 25% to achieve
                                             top quartile
                                             performance.
                                            Note: No signs of “over leaning”

                                                                               14
New Operating Model: short-term areas of focus
for 2020-21
       Following the completion of the new Operating Model for the new
        Blood Supply Directorate, review opportunities in areas where there
        may be synergies or duplication:
          Planning
          Performance and Reporting
          Management structures

       Develop a plan to Strengthen the Capacity to develop and deliver
        strategies and change in Blood Supply (in particular in Blood
        Donation).

       Develop a short-term plan to Reduce Variability in collections by
        team by better aligning capacity with their collections.

                                                                              15
Delivering a step-change in BD productivity requires
significant investment in our collection model!
                     Reduce non donor       Increase our collection in successful/busy donor centres; no
                      facing time (e.g.,     travel time (current average 1.5 hours) and shorter set up
                    travel, set and pack     and pack down than on mobiles (15-20 minutes shorter).           All activity listed
                             up)            Review working day travel time allocation to mobile sessions.     would require
                                                                                                               substantial
                                          Use technology in session to remove the need to undertake           investment and
 Looking at top     Remove activities in   some activities (e.g. donors self check-in, reconciliation).        lead times for
 quartile blood        session and        Move Hb testing out of session as part of the post donation         planning and
                     eventually roles      testing strategy (fewer screening roles).
   operators –                                                                                                 delivery
     how our                                                                                                  In the short term,
    collection                              Increase the conversion rate of booked appointment to             the ambition is to
  model would          Increase the          actual collection by enhancing tools for donors to self-defer     revert to
need to change                               before the session (e.g. DHC online).                             previous levels
                      throughput per
to deliver a step                           Explore a more flexible staffing model to align better with       of BD
                      session without
                                                                                                               productivity
    change in         changing roles         expected collection for the session.
                                                                                                               before the stock
  productivity?                             Run continuous sessions (avoid inefficient ramp up/down).         challenges (i.e.
                                                                                                               c1,400
                        Collect more      Start collecting plasmaphaeresis for fractionation (if risk         units/FTE/year
                      components with      assessment indicates UK plasma is safe to re-renter the
                    higher weight in EBA   supply chains of PDMP).
                       benchmarking
                                                                                                                                16
Short-term vs. Long-term Capacity Considerations

                Short-term                                Longer-term

     We have enough capacity planned       As part of the Blood Strategy, we will
      to collect enough to fulfil the        consider options to:
      current demand forecast.                 Modernise the session environment and
     We have some flexibility to vary           our offer to donors (e.g. session
      the number of appointments                 solution, online DHC, automated check-
      throughout the year, e.g. to               in).
      compensate for anticipated higher        Review our session footprint to attract
      low Hb deferrals over summer.              more of the donors we need (e.g. more
     While overall appointment                  London sessions in Black community
      numbers will be sufficient, our            venues).
      biggest challenge will be to             Improve our operating model with a
      mobilise donors by the right blood         view to reducing deferrals (e.g. post
      groups (e.g. to meet rising O neg          donation testing).
      demand).                                 Enhance the flexibility of our staffing
                                                 model to reduce donor cancellations.
                                                                                          17
Blood Donation Key Messages

            We should be cautious about removing too much cost and chasing
   1.                   productivity too aggressively, too soon.

        It will take a while to properly plan for and address some of the current and
   2.      future issues on session preventing us from achieving step-changes in
                     performance, e.g. low Hbs and modernising sessions.

        In the meantime, there are some things we can do to improve incrementally,
   3.         like getting productivity back to 1,400 and removing duplication.

                                                                                        18
Manufacturing & Logistics Productivity in EBA Top Quartile

   M&L are proposing productivity target increases
    in Manufacturing and Hospital Services while                          19/20      Current          EBA Upper     Proposed
    keeping the target flat in Testing.               PRODUCTIVITY        Target     Performance M7 Quartile        20/21 Target
                                                      Manufacturing           10,700           11,227        11,528       11,250
   Medium term productivity trends are shown in      Testing                 33,700           34,939        30,352       33,700
    the charts below.                                 Hospital Services       36,000           36,642      n/a            36,500

                                                        Income
                  LRP
                                                       Generation
                 £1.2M
                                                            £0.3M
Manufacturing & Logistics Budget Trending Downwards

                                                M&L Budget has been reduced from
                                                 £106.3m in 12/13 to a proposed
                                                 £87.2m in 2021 a fall of 18%.

                                                High level estimated movements from
                                                 19/20-20/21:

                                              Income
                                                BAU Savings                    1.415M
                                             Generation
                                                LRP Savings                    1.025M
                                                Cessation of Plasma Imports
                                               £0.3M                           3.460M
                        Consumables
             LRP                                Cost Pressures                 0.400M
                          & WTE                 6 Day Graulocytes              0.192M
            £1.2M
                           £1.2M                Volume Increase (inc Plasma)   0.136M
                                                Automatic Pay Cost Increases   3.513M

                                                Net Budget Reduction           1.659M
Contribution of Functional Costs to the Red Cell
Price
                  Standard Red Cell £/unit – 2018/19 budget
         45                                                                                          Blood donation (collection
                                                                                         Fixed
                        Collection             £26/unit                                               and marketing) is around
         40             Source donors          £11/unit                                  Variable     40% of the red cell cost /
                        Management, planning   £4/unit
         35                                                                                           price.
         30   Direct supply chain costs
                                                                                                     Other areas of the Blood
                                                          DCs, team bases      £3/unit
                                                          Processing/Testing   £2/unit                Supply Chain have
£/unit

         25                                               SHUs                 £3/unit                achieved productivity
                                                          Other                £2/unit
         20                                                                                           gains (e.g. manufacturing
         15
                                                                                                      and testing). In general,
                                                                                                      consumables are also
         10
                                                                                                      low.
         5                                                                                           As demand continues to
         0
                                                                                                      decline, falling
                                                                                                      productivity in collection
                                                                                                      means pressure on
                                                                                                      prices, with limited
                                                                                                      mitigation.
You can also read