BON SECOURS HAMPTON ROADS DEPAUL MEDICAL CENTER
←
→
Page content transcription
If your browser does not render page correctly, please read the page content below
Bon Secours Hampton Roads
  DePaul Medical Center
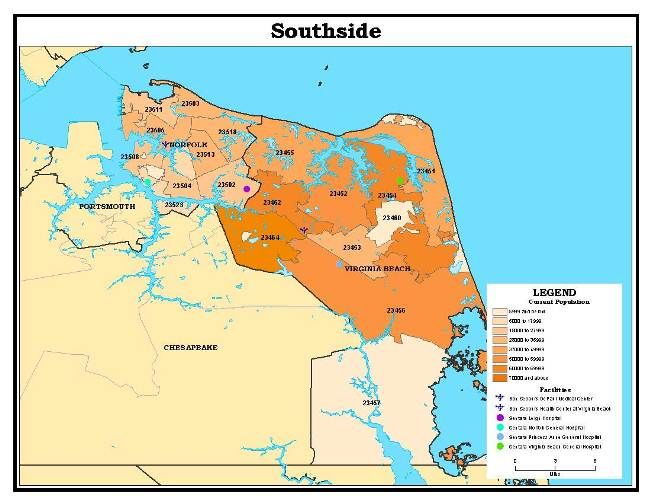
Table of Contents
Executive Summary .................................................................................................................................... 3

Facility Description and Vision .................................................................................................................. 9

Access to Health Care Profile .................................................................................................................. 10
   Provider to Residents Ratios
   Health Professional Shortage Area/Medically Underserved Area

Demographics Data Profile ...................................................................................................................... 11
   Population
   Unemployment/Median Income
   High School Graduation
   Uninsured Population
   Healthy Lifestyles
   Social Indicators of Health Related to Children

Health Conditions and Disease Data Profile .......................................................................................... 16
   Overall Mortality Data

Key Findings .............................................................................................................................................. 18
   Behavioral/Mental Health
   Adult Obesity
   Heart Conditions
   Diabetes
   Cancer
   Violence in the Community
   Smoking/Tobacco Use
   Alzheimer’s Disease/Dementia
   Chronic Pain

Other Key Findings ................................................................................................................................... 30
   Services that Need Strengthening - Adults
   Services that Need Strengthening – Children (ages 0-17)
   Health Concerns for Children and Teens (ages 0-17)
   Access to Health Services
   Community Assets that Need Strengthening

Identifying Needs ...................................................................................................................................... 35
    Community Dialogues

Prioritization Process ............................................................................................................................... 36
    Method for Prioritization

Progress on 2016-2019 CHNA Priorities ................................................................................................. 37

Services and Resources Available to Meet Identified Needs ............................................................... 40

Appendix .................................................................................................................................................... 42
Executive Summary

Bon Secours DePaul Medical Center (DePaul) is a 198-bed not-for-profit, acute care
facility licensed in the Commonwealth of Virginia serving approximately 698,000
residents in Norfolk and Virginia Beach. The Community Health Needs Assessment
(CHNA) examines qualitative input provided by community members coupled with
quantitative data on health conditions in the area. Together the information forms a
snapshot of important areas of health concern. A survey to gather information from the
community was conducted in November and December 2018. Five (5) community focus
groups were held January through April 2019. This executive summary provides an
overview of the initiative and the findings.

The Mission of Bon Secours Health System is to bring compassion to health care and to
be Good Help to Those in Need®, especially those who are poor and dying. As a
System of caregivers, we commit ourselves to help bring people and communities to
health and wholeness as part of the healing ministry of Jesus Christ and the Catholic
Church.

The survey and this assessment focus on the DePaul service area of 26 zip codes. The
study region is shown in the map below.

   Bon Secours DePaul Medical Center Service Area & Population Density Map
A collaborative team from Bon Secours DePaul Medical Center, Children’s Hospital of
The King’s Daughters, Sentara Healthcare, and the Virginia Department of Health –
Norfolk and Virginia Beach (Collaborative) began meeting in May 2018 to begin the
work on the 2020 – 2022 Community Health Needs Assessment. In order to obtain input
from the community, an online and hard-copy survey was disseminated in English and
Spanish, and four community focus groups were held in Norfolk and Virginia Beach.

The Community Health Survey was disseminated October 23 through December 12,
2018, to the DePaul community in Norfolk and Virginia Beach. It was available online
and could be completed on paper in both English and Spanish. The survey was
distributed widely via Bon Secours networks, as well as meetings, clinics and programs
supported by DePaul, such as the Care-A-Van, a mobile medical unit that provides care
to the uninsured population, in the East Ocean View site of the Bon Secours Hampton
Roads Health Communities initiative, Bon Secours DePaul Medical Center SeniorHealth
members, and a Norfolk LGBTQ community resource site. The Community Health
Needs Assessment Survey can be reviewed in Appendix V.

The survey was taken by 330 residents and key stakeholders who indicated Norfolk and
Virginia Beach as their primary service area. Individuals were asked to choose the top
five health issues and services they thought should be addressed in their community.
Overall, Community Health Needs Assessment Survey participants represent a blend of
perspectives across age, race and income.

Epidemiological data was provided by the Virginia Department of Health - Portsmouth.
Based on secondary data analysis, the following table highlights the major health issues
where the DePaul community has worse rates or percentages when compared to
Virginia or Healthy People 2020 targets. It is important to note, that for the most part,
Norfolk also has worse health outcomes than Virginia Beach.

            Health Concerns                             Social / Economic Factors
 •   Mental Health                                •   Crime
 •   Obesity                                      •   Food Insecurity
 •   Alcohol / Substance Abuse                    •   Unemployment
 •   Heart Conditions                             •   Children in Single-Parent Households
 •   Diabetes Hospitalizations                    •   Severe Housing Problems
 •   Breast Cancer
 •   Respiratory Disease
The charts below illustrate the top ten health issues and services that need
strengthening identified by participants in the Community and Key Stakeholder surveys.
Top Ten Health Issues Identified by Community Survey Participants
Top Ten Health Issues Identified by Key Stakeholder Survey ParticipantsTop Ten Services that Need Strengthening Identified by Community Survey Participants Top Ten Services that Need Strengthening Identified by Key Stakeholder Survey Participants
For the most part, the community health needs selected by survey participants focus on
health issues in the top ten concerns. Violence in the Community was the only social
issue identified. It is interesting to note that eight of the top ten health concerns were the
same in both the Community and Key Stakeholder responses.

DePaul Medical Center’s senior leadership team met to review primary and secondary
data gathered through the CHNA process (community meetings, community and key
stakeholder surveys, and meetings with regional health systems and health
departments). Recognizing the importance of each of the health concerns identified, the
team evaluated them, the hospital’s strategic goals, services currently provided, and the
current CHNA Implementation Plan’s progress. Based on these criteria, the team
narrowed their focus to the top five health concerns selected by both the community and
key stakeholders. The team then determined the areas in which they could have the
greatest impact. Based on the above information and processes, DePaul will focus the
Community Health Needs Assessment implementation strategy on the following.

Alcohol and Substance Abuse
Opioid addiction is characterized by a powerful, compulsive urge to use opioid drugs,
even when they are no longer required medically. Opioids have a high potential for
causing addiction in some people, even when the medications are prescribed
appropriately and taken as directed. Many prescription opioids are misused or diverted
to others. The opioid crisis is more deadly than drunk drivers or gun violence and is one
of the most devastating threats to the community.

With opioid addiction at epidemic status, DePaul will focus their efforts around reducing
opioid dependency and addiction in the community by monitoring opiate prescribing
patterns and reducing the opiate prescription rate within the hospital. In addition,
DePaul will increase awareness of substance abuse risks through school and
community partnerships. In addition, monthly educational programs for aging adults will
address substance abuse, as well as all ten top health concerns.

Heart Conditions
Heart disease remains the leading cause of death in the U.S. and stroke continues to
rank fifth, according to the National Center for Health Statistics Mortality Data Report for
2017. Research shows people living with diabetes are at least two times more likely to
develop and die from cardiovascular disease. Cardiovascular diseases are a group of
disorders of the heart and blood vessels which include: coronary heart disease,
cerebrovascular disease, peripheral arterial disease, rheumatic heart disease,
congenital heart disease, and deep vein thrombosis and pulmonary embolism.

DePaul will improve address cardiovascular disease through improvement of
readmission rates of ST-elevation myocardial infarction (STEMI) heart attacks and
chronic heart failure (CHF) patients by developing strategic interventions. Education and
awareness of heart conditions will be accomplished through community education
programs.

Chronic Health in Aging Adults
One in four Americans suffers from multiple chronic conditions, those that last a year or
more and require ongoing medical attention or that limit activities of daily living. That
number rises to three in four Americans aged 65 and older. As a person’s number of
chronic conditions increases, his or her risk for dying prematurely, being hospitalized,
and even receiving conflicting advice from health care providers increases. People with
multiple chronic conditions also are at greater risk of poor day-to-day functioning.
Chronic conditions can lower quality of life for older adults and contribute to the leading
causes of death among this population.

Using the CHNA priorities as a guide, DePaul will partner with medical providers and
community groups to increase awareness of chronic health conditions in older adults
through educational programming focused on the aging population.

Overweight/Obesity/Diabetes
DePaul will address obesity and diabetes through community education classes held at
the hospital. The Bon Secours Hampton Roads Passport to Health program in the East
Ocean View community of Norfolk will continue to provide education on healthy eating
and lifestyles. School partnerships will continue to provide nutritional and physical
health education. DePaul will also partner with medical providers and community groups
to increase awareness of obesity and diabetes in older adults through educational
programming focused on the aging population.

Behavioral/Mental Health
DePaul will continue the mental health initiatives identified in the previous CHNA
through offering support groups and community education. Referrals to local community
service boards by the emergency department Life Coaches and the Bon Secours Care-
A-Van will also continue. In addition, DePaul will active participate in coalitions
addressing behavioral/mental health, especially in the areas of opioid abuse and
chronic health conditions.
.
Facility Description and Vision

Bon Secours DePaul Medical Center
(DePaul) has served the Hampton Roads
region for 163 years. The Hospital of St.
Vincent de Paul, Norfolk’s first public
hospital, was incorporated by the Virginia
Legislature on March 3, 1856. The eight-
room hospital served 100 patients in its
first year. By the 1970's, DePaul Hospital
had established itself as a state-of-the-
art 366-bed full-service hospital,
providing a comprehensive array of
inpatient and ambulatory diagnostic and treatment services. In 1996, DePaul Hospital
was transferred from the Daughters of Charity National Health System-Southeast to
Bon Secours Health System, Inc. With the transfer, the facility was renamed Bon
Secours DePaul Medical Center.

DePaul is now a 198-bed not-for-profit, acute care facility licensed in the state of
Virginia and serving approximately 698,000 residents mostly originating from the cities
of Norfolk, Virginia Beach. DePaul provides a comprehensive array of inpatient and
outpatient services. In addition, DePaul works with sister facilities Bon Secours
Maryview Medical Center, in Portsmouth, and Bon Secours Mary Immaculate Hospital,
in Newport News, to support highly complex surgical specialties.

Bon Secours DePaul Medical Center Mission
The Mission of Bon Secours DePaul Medical Center mirrors that of its parent Bon
Secours Health System, Inc. – “Inspired by the healing ministry of Jesus Christ and the
Charism of Bon Secours, as a prophetic Catholic health ministry, Bon Secours DePaul
will partner with our community to create a more humane world, build social justice for
all, and provide exceptional value for those we serve.”

To help activate its vision, DePaul is transforming how it approaches care. A top priority
is to ensure that we commit to liberate the potential of our people to serve. In order to
provide exceptional value for those we serve, DePaul is continuously providing new
services and treatments to area residents.

Access to Health Care Profile

This Access to Health Profile provides health service data gathered from multiple
publicly available data resources.

Provider to Residents Ratios
Access to health care services is a key factor in the health of a community. A major
contributing factor in health care accessibility is the burden of care placed on a provider.
The following table depicts the ratio of provider/residents in Norfolk and Virginia Beach.
The ratios for the state are also given for comparison. This data table highlights a
disparity in provider to resident ratios between the two cities and across provider types.

                               Ratio of Provider to Residents (2016)1
                                     Norfolk         Virginia Beach         Virginia
    Primary Care                      1,030:1            1,340:1            1,310:1
    Dental Care                       1,220:1            1,320:1            1,470:1
    Mental Health                      530:1              640:1              630:1

Health Professional Shortage Area/Medically Underserved Area
The U.S. Health Resources and Services Administration (HRSA) defines a Health
Professional Shortage Area (HPSA) designation as one that identifies a geographic
area, population group or facility as having a shortage of primary care physicians. As of
2016, Norfolk has been designated a Primary Care HPSA. As of 2017, Norfolk has been
designated as a Mental Health HPSA. HRSA designates geographic areas or defined
populations as “medically underserved” based on the presence of particular health and
socioeconomic risks in addition to provider shortages. The criteria for designation
include too few primary care providers, high infant mortality, high poverty, and/or high
elderly population rates. At least one subsection of Norfolk had a Medically
Underserved Area (MUA) designation. 2

1
    www.CountyHealthRankings.org
2
    http:// hrsa.gov/shortage/index.html
Demographics Data Profile
The health of a community is largely connected to the demographics and social aspects
of its residents, which can be a useful indicator of health concerns. Demographic
studies of a population are based on factors such as age, race, sex, economic status,
education levels, and employment rates, among others. The physical environment in
which individuals live, learn, work, play, and grow old also has a great impact on their
health and quality of life. These cultural and environmental conditions are also known as
“Social Determinants of Health”.
Some key findings in the DePaul community’s demographics data 3 include:
Population
It has been well established that race and ethnicity are key factors in health disparities.
For example, life expectancy, death rates and infant mortality rates are all less favorable
among African American populations as compared to other ethnic populations. In 2009,
African Americans in the United States had the highest mortality rates from heart
disease and stroke as compared to any other ethnic group. Additionally, infants born to
African Americans have the highest infant mortality rates, more than twice the rate for
Whites in 2008. While certain health indicators such as life expectancy and infant
mortality have been slowly improving, many minority race groups still experience a
disproportionately greater burden of preventable disease, death, and disability. 4
• Norfolk’s population is
predominantly White and African
American. Compared with Virginia
as a whole, Norfolk has a lower
percentage of White population
with and a significantly higher
percentage of African American
population.
• Virginia Beach population is
predominantly White. Virginia
Beach is equivalent to Virginia’s
percentage of White and African
American.
3 www.countyhealthrankings.com
4 MinorityHealth.hhs.gov, HHS Disparities Action Plan• There is a slightly lower percentage of Hispanics in Norfolk and Virginia Beach
compared to Virginia. Norfolk has a lower percentage of Other populations than
Virginia Beach and Virginia. Virginia Beach has a slightly higher percentage of Other
populations than Virginia.
Older adults are at higher risk for developing chronic illnesses such as Diabetes
Mellitus, Arthritis, Congestive Heart Failure and Dementia, and this proves to be a
burden on the health care system. The first of the “baby boomer generation” (adults
born between 1946 and 1964) turned 65 in 2011 and has resulted in an aging
population nationwide. It is estimated that by the year 2030, 37 million older adults
nationwide will be managing at least one chronic condition. Chronic conditions
contribute to the leading causes of death among older adults. Additionally, older adults
often experience higher rates of hospitalizations and low-quality care. 5
• Norfolk is comprised of fewer
children under the age of 18 than
Virginia Beach and Virginia, which
are statistically equal.
• Norfolk has fewer older adults
(65+) than Virginia Beach and
Virginia. Virginia Beach has fewer
older adults than Virginia.
The Weldon Cooper Center for Public
Service estimates that the
community’s older population will steadily increase through 2040 to over 76,000 people,
while the population growth rate of• Unemployment rates in the Norfolk are higher than those in Virginia Beach and
Virginia, with Virginia Beach slightly lower than Virginia.
• Norfolk’s median income is significantly lower than Virginia Beach and Virginia,
which are almost equal.
High School Graduation
A direct correlation exists between low levels of education and high poverty rates. High
poverty rates in turn have an adverse effect on a community’s health outcomes. The
Healthy People 2020 goal for Education Level/Graduation Rates aims for at least 97.9%
of students attending public schools graduate with a regular diploma four years after
starting 9th grade 8. Graduation rates for Norfolk and Virginia Beach have increased
since 2014-2015. At that time, Norfolk and Virginia Beach graduation rates (78.9% and
88.5%, respectively) were lower than the Healthy People 2020 goal (82.4%) and
Virginia’s (89.9%) rate. 9
• High school graduation rates in
Norfolk are lower than those in
Virginia Beach and Virginia.
Virginia Beach rates are higher
than Virginia.
• The same is true of those with
some college.
8 www.healthypeople.gov, Educational-and-Community-Based-Programs
9 www.CountyHealthRankings.orgUninsured Population
Research shows that high rates of health insurance coverage positively impact a
community’s overall health status. Access to health care services improves quality of
life, school and work productivity and overall rates. 10 The Healthy People 2020 goal for
Health Insurance aims for 100% of the population having some form of health insurance
coverage 11.
• Norfolk has a higher percentage of
uninsured adults than Virginia and
the Virginia Beach percentage is
lower than Virginia.
• The percentage of uninsured
children in Norfolk, Virginia Beach,
and Virginia are statistically equal.
Healthy Lifestyles
Consumption of unhealthy foods, lack of exercise opportunities and other negative
healthy cultures, has an adverse impact on a community. Increased access to exercise
opportunities and healthy foods is a critical prevention strategy to alleviate this
economic burden. 12 Low levels of physical activity are correlated with several disease
conditions such as obesity, Type 2 Diabetes, cancer, stroke, hypertension,
cardiovascular disease, and premature mortality. The physical activity goal set by
Healthy People 2020 states that no more than 32.6% of the adult population (age 20+)
report that they engages in no leisure-time physical activity 13. The following table
provides food and physical activity data for the Mary Immaculate community. 14
• In Norfolk, the Food Environment Index and percentages for Food Insecurity and
Access to Exercise are worse than the data reported for Virginia Beach and Virginia.
The percentage for Physical Activity is statistically the same as Virginia Beach and
Virginia.
• In Virginia Beach, the Food Environment Index is slightly higher (better) than
Virginia’s. Percentages for Food Insecurity and Physical Activity are statistically
equal. The Access to Exercise percentage in Virginia Beach is also significantly
higher (better) compared to Norfolk and Virginia.
10 www.healthypeople.gov, Access to Health Services
11 www.healthypeople.gov, Foundation Health Measures; General Health Status
12 www.stateofobesity.org/healthcare-costs-obesity
13 www.healthypeople.gov, Physical Activity
14 www.CountyHealthRankings.orgVirginia
Measure and Definition of Measure Norfolk Virginia
Beach
Food Environment Index
Factors that contribute to a health food 6.5 8.7 8.9
environment, 0 (worst) to 10 (best)
Food Insecurity
Percentage of population who lack 19% 10% 11%
adequate access to food
Physical Inactivity
Percentage of adults aged 20 and over
23% 22% 22%
reporting no leisure-time physical
activity HP2020 Goal – 32.6%
Access to Exercise
Percentage of population with adequate 89% 97% 82%
access to locations for physical activity
Social Indicators of Health Related to Children
To understand the health needs and attitudes towards health in a community it is
imperative to study the social indicators of health related to children. The table provides
risk factor data specific to children (Health Conditions and Disease Data Profile
The Health Conditions and Disease Data Profile for DePaul community of Norfolk and
Virginia Beach can be found in this section of the CHNA. This data provides a
quantitative profile of the community based on a wide array of community health
indicators, compiling and analyzing data from multiple sources. This CHNA focuses on
health indicators for which data sources were readily available and whenever possible
provides comparison to the Commonwealth of Virginia overall and the Health People
2020 goals. Additional health behaviors and social determinants of health have been
identified as key contributors to the overall health of a community. Adult Smoking, Adult
Obesity and Excessive Drinking are indicators with national goals from the Center of
Disease Control’s (CDC) Healthy People 2020 initiative as indicated in the following
table.
Overall Mortality Data
Healthy People 2020 objectives define mortality rate goals per 100,000 populations for
a number of health problems. 16 A selection of the Healthy People 2020 mortality targets
is as follows:
Healthy People 2020 Mortality Targets
Overall Cancer 161.4 deaths per 100,000 population
Breast (female) Cancer 20.7 deaths per 100,000 females
Lung Cancer 45.5 deaths per 100,000 population
Prostate Cancer 21.8 deaths per 100,000 males
Colon (colorectal) Cancer 14.5 deaths per 100,000 population
Heart Disease 103.4 deaths per 100,000 population
Stroke 34.8 deaths per 100,000 population
Diabetes 66.6 deaths per 100,000 population
Infant 6.0 infant deaths per 1,000 live births
Neonatal Deaths (28 days) 4.1 neonatal deaths per 1,000 live births
Drug Related 11.3 drug-induced deaths per 100,000
Violence 5.5 homicides per 100,000 population
Injuries 36.4 deaths per 100,000 injuries
16 www.healthypeople.gov/2020/topics-objectivesIn 2013, the DePaul community had a total of 3,645 deaths attributable to the leading 10
causes of mortality in the region as listed in the following tables. The three leading
causes of death in Norfolk and Virginia Beach are: 1) Heart Disease, 2) Cancer, and 3)
Stroke.
The table on the following page provides the number of deaths attributable to each of
the top 10 causes of death for Norfolk and Virginia Beach. 17
Leading 10 Causes of Mortality by Total Number of Deaths (2013)
Norfolk Virginia Beach
Diseases of the Heart 451 586
Cancer 383 728
Cerebrovascular Diseases (Stroke) 103 149
Unintentional Injury 103 142
Chronic Lower Respiratory Diseases 99 128
Nephritis & Nephrosis (Kidney Disease) 65 69
Septicemia 50 66
Diabetes 49 81
Alzheimer’s Disease 42 69
Chronic Liver Disease 31 39
17 www.vdh.virginia.gov/healthstats/Norfolk13Key Findings In this section, we highlight the top ten health concerns raised by health indicators as well as by the Community Health Survey. This analysis is listed in order of priority based on the Community Health Needs Assessment Survey (Survey) to highlight how these concerns or the services addressing these concerns are perceived by the community and key stakeholders. Behavioral/ Mental Health Behavorial/Mental health disorders are health conditions characterized by alterations in thinking, mood, and/or behavior that are associated with distress and/or impaired functioning. Behavioral/Mental health disorders contribute to a number of health problems, including disability, pain and death. Behavioral/Mental health and physical health are closely connected. Mental illesses, such as depression and anxiety, affect people’s ability to participate in health-promoting behaviors. According to the National Institute of Mental Health (NIMH), an estimated 46.6 million American adults (approximately 1 in 5) were diagnosed with any mental illness (AMI) in 2017. The prevalence of AMI was higher among women than men. The prevalence of AMI was also highest among adults reporting two or more races, followed by White adults. Additionally, suicide is the 10th leading cause of death (40,000 deaths) in the United States, moving from 11th leading cause (30,000 deaths) as reported in the 2016 CHNA. According to Healthy People 2020, the baseline suicide rate nationwide is 11.3 per 100,000. Healthy People 2020’s goal is to reduce this by 10% to a rate of 10.2 per 100.000. 18 The hospitalization rate due to mental health was significantly higher in Norfolk than Virginia Beach and Virginia. Virginia Beach was slightly higher. 19 18 www.nimh.mih.gov/health 19 www.ghrconnects.org
Virginia              HP2020
               Health Issue             Norfolk              Virginia
                                                   Beach                Target
               Suicide Mortality Rate
                                         10.9       9.7        11.8      10.2
               (per 100,000) 2017
               Hospitalization Rate
               due to Mental Health      70.8       58.8       52.4       --
               (per 10,000) 2014-2106

A higher percentage of Norfolk reported poor mental health days compared to Virginia
Beach and Virginia. Norfolk also has a higher percentage of those reporting frequent
mental destress than Virginia. Virginia Beach had a lower percentage than Virginia. 20

                                                  Virginia              HP2020
               Health Issue             Norfolk              Virginia
                                                   Beach                Target
               Average Number of
               Poor mental health         3.8       3.4        3.4        --
               days (2016)
               Frequent Mental
                                         12.3%     10.2%      11.0%       --
               Distress (2016)

Norfolk and Virginia Beach survey respondents prioritized Behavioral/Mental Health in
the top ten health concerns. Behavioral/Mental Health Services were rated as the
second most important for the Services that Needs Strengthening question by key
stakeholders and the community.

Adult Obesity
Obesity is a measure defined as the percentage of adults aged 20 and older who have
a body mass index (BMI) equal to or greater than 30. The obesity target set by Healthy
People 2020 is that no more than 30.5% of the population is obese. 21

The table on the next page illustrates that 32% of Norfolk residents are obese, which is
a decrease of 3% since 2011. Virginia Beach’s obesity rate is equal to Virginia and
lower than HP2020 goals; however, it is an increase of 1% over 2011. Physical inactivity

20   www.ghrconnects.org
21   www.healthypeople2020.gov
in Norfolk, Virginia Beach and Virginia is significantly lower than HP2020 goals,
although Virginia Beach has a 1% increase over 2011. 22
Virginia HP2020
Health Issue Norfolk Virginia
Beach Target *
Obesity (% ) 2015 32.0% 29.0% 29.0% 30.5%
Physical Inactivity (%) 2015 23.0% 22.0% 22.0% 32.6%
Key stakeholder and community survey respondents identified Overweight/Obesity as
second in the top ten health concerns. It was not identified in the top ten Services that
Need Strengthening.
Alcohol/Substance Abuse
In November 2016, Virginia State Health Commissioner, Dr. Marissa Levine, declared a
Public Health Emergency for Virginia as a result of the opioid addiction epidemic in an
effort to lower the death rate and prevent deaths from opioid addiction.
Opioid deaths have have significantly increased in Norfolk and Virginia Beach since
2013. In 2013, the death rate due to Fentanyl/Heroin in Norfolk was 6.9 per 100,000
and Virginia Beach was 6.7. Narcan adminstration by emergency medical services was
2.4 per 100,000 in Norfolk. Narcan use was significantly higher in Virginia Beach at 21.6
per 100,000. 23
The table on the next page shows the death rates for drug overdose, Fentanyl/Heroin
overdose, and prescription drug overdose death rate for Norfolk and Virginia Beach.. 24
The drug overdose death rate for Norfolk (24 per 100,000) is significantly higher than
the Virginia rate of 16 per 100,000. Virginia Beach is slightly higher at 17 deaths per
100,000. The death rate due to Fentanyl/Heroin is significantly higher than Virginia
Beach and Virginia. The death rate for Virginia Beach is slightly lower than that of
Virginia. The death rate due to prescription opioid overdose is higher in Norfolk and
Virginia Beach than Virginia. Virginia Beach is slightly higher than Norfolk. Narcan
administration for emergency medical services has significantly increased in Norfolk
(47.3 per 100,000) and Viginia Beach (45.5 per 100,000) since 2013 (2.4 and 21.6
respectively).
22 www.CountyHealthRankings.org
23 www.ghrconnects.org
24 www.ghrconnects.orgVirginia HP2020
Health Issue Norfolk Virginia
Beach Target
Drug Overdose Deaths (per
24.0 17.0 16.0 --
100,000) 2015-2017
Death Rate due to
Fentanyl/Heroin Overdose 18.8 10.4 11.0 --
(per 100,000) 2017
Death Rate due to
Prescription Opioid 6.5 7.5 5.9 --
Overdose (per 100,000) 2017
EMS Narcan Administration
47.3 45.5 53.9 --
Rate (per 100,000) 2017
The following table illustrates the percentage for excessive drinking is higher Norfolk
(21.1%) and Virginia Beach (22.0%) than Virginia (17.4%), with Virginia Beach slightly
higher than Norfolk. While the percentages for adults who binge drink are statistically
equivalent for Norfolk and Virginia Beach, they are higher than the HP2020 Target of
24.2%. Deaths due to alcohol-impaired driving are higher in Norfolk and Virginia Beach
compared to Virginia. 25
Virginia HP2020
Health Issue Norfolk Virginia
Beach Target
Excessive Drinking (2016) 21.1% 22.0% 17.4% 25.4%
Adults who Binge Drink
18.4% 18.9% -- 24.2%
(2015)
Alcohol-impaired Driving
36.0% 39.0% 31.0% --
Deaths (2013-2017)
Community and key stakeholder survey responses placed Substance/Alcohol Abuse as
the number three health concern. It was also in the top ten Services that Need
Strengthening for both respondent groups.
Heart Conditions
Heart Disease is the leading cause of death in the United States and globally. In 2013,
nearly 801,000 deaths in the United States resulted in heart disease, stroke and other
cardiovascular diseases. One out of every three deaths in the United States in 2013
25 www.ghrconnects.orgcould be attributed to these causes. 26 Stroke is the second leading cause of death
globally, and the fifth leading cause of death in the United States. In 2010 alone, the
United States incurred more than $500 billion in health care expenditures and related
expenses as a result of heart disease and stroke. Stroke is also a leading cause of
disability in the United States.
Healthy People 2020 mortality goals for Heart Disease and Stroke include the following:
Healthy People 2020
Heart Disease & Stroke Mortality Goals
Heart Disease 103.4 deaths per 100,000 population
Stroke 34.8 deaths per 100,000 population
The leading modifiable (controllable) risk factors for heart disease and stroke are high
blood pressure, high cholesterol, cigarette smoking, diabetes, poor diet, physical
inactivity, and overweight/obesity.
The following table displays Stroke and Heart Disease Mortality for Norfolk and Virginia
Beach 27 Since 2013, Norfolk’s rate of heart disease mortality declined by 37.8. The rate
of heart disease mortality in Virginia Beach declined 11.9 since 2013. Norfolk’s heart
disease mortality rate is significantly higher than Virginia Beach and Virginia. The rate of
heart disease mortality in Virginia Beach is lower than that of Virginia.
\
High blood pressure is the number one risk factor for stroke that can be corrected. High
blood pressure can also lead to heart attack, heart failure, and atherosclerosis. One in
26 www.heart.org/idc/groups/ahamah-public
27 www.ghrconnects.orgthree adults has high blood pressure in the United States. The prevalence of high blood
pressure in Norfolk and Virginia Beach is below that of the United States; however, it is
above the Healthy People 2020 goal. One in six adults has high blood cholesterol, one
of the major risk factors for heart disease. The prevalence of high cholesterol in Norfolk
and Virginia Beach is below that of the United States 28
Virginia United
Health Issue Norfolk HP2020
Beach States
High Blood
Pressure 30.3% 29.5% 31.9% 26.9%
Prevalence (2015)
High Cholesterol
Prevalence: Adults 30.9% 33.8% 37.1% --
(2015)
Key stakeholders and the community identified Heart Conditions as the fourth top
concern. Heart Conditions was not listed in the top ten Services that Need
Strengthening by either Survey group.
Diabetes
Diabetes is a leading cause of death in the United States. Diabetes can have a harmful
effect on most of the organs in the human body and can cause renal failure, lower-
extremity amputation, and blindness among adults. It can also cause stroke and
neuropathy. 29
Since 2013, Norfolk’s diabetes mortality rate decreased 3.8%; however, it remains
higher than that of Virginia Beach and Virginia, which decreased 3.9% and 0.7%
respectively in the same period. 30
28 www.ghrconnects.org
29 www.ghrconnects.org
30 www.ghrconnects.orgSince 2014, the percentage of adults with diabetes has increased; however, both cities
are below the percentage of adults with diabetes in the United States.
The table below shows data around diabetes rates and hospitalization. 31 The rate of
hospital discharges in Norfolk for diabetes without complication is higher than Virginia’s,
while Virginia Beach’s rate is lower. The rates for Norfolk and Virginia have increased
2% and 1.4% respectively since 2013.
Virginia United
Health Issue Norfolk
Beach States
Adults with Diabetes (2016) 9.9% 8.8% 10.8%
Hospitalization Rate due to
Diabetes: Adults (per 28.1 14.4 17.1
10,000) 2014-2016
Diabetes was rated as the number five health concern by key stakeholders and
community Survey respondents. It was also in the top five as a Services that needs
Strengthening (Chronic Disease Services subcategory).
Cancer
Cancer has been identified as the second greatest cause of death nationwide, with
Heart Disease being number one. According to data from the National Cancer Institute
cancer rates (2011 – 2015)32 in Norfolk fell and remained steady in Virginia Beach.
However, cancer remains a leading cause of death in the DePaul Medical Center
service area. Cancer mortality rates advanced by Healthy People 2020 include the
following: 33
Healthy People 2020 Cancer Mortality Rate Goals
Overall Cancer 161.4 deaths per 100,000
Breast Cancer 20.7 deaths per 100,000 females
Lung Cancer 45.5 deaths per 100,000
Prostate Cancer 21.8 deaths per 100,000 males
Colon (Colorectal) Cancer 14.5 deaths per 100,000
31 www.ghrconnects.org
32 www.statecancerprofiles.cancer.gov/incidencerates
33 www.healthypeople.gov, CancerThe following table provides the five-year total mortality/rates by cancer type for Norfolk
and Virginia Beach compared to Virginia. 34 Since 2000, mortality rates for breast, colon,
lung and prostate cancer have been dropping steadily in both Norfolk and Virginia
Beach. With the exception of the lung cancer rate in Norfolk, these rates are all within a
couple of points of the Healthy People 2020 (HP2020) target. Rates for colon and
prostate cancer in Virginia Beach have already been met and dropped below the
HP2020.
Cancer Mortality Rates 2011 -2015 (per 100,000)
Virginia
Norfolk Virginia HP2020
Beach
Colon Cancer 14.6 12.8 14.0 14.5
Lung Cancer 50.0 45.0 44.0 45.5
Prostate Cancer 27.9 18.8 20.2 21.2
Breast Cancer 28.5 23.1 21.8 20.7
The following tables provide total mortality/rates per 100,000 by cancer type for Norfolk
and Virginia Beach (2011 – 2015) compared to Virginia 35.
• Colon Cancer
Since 2007, Norfolk Colon Cancer Mortality rates have steadily decreased; however,
remain higher than Virginia and the Healthy People 2020 target. Virginia Beach rates
slightly increased from 2008-2012. Virginia Beach mortality rates are lower than
Virginia and the HP2020 target.
Colon Cancer Mortality (rate per 100,000)
2007-2011 2008-2012 2011-2015
Norfolk 17.4 15.0 14.6
Virginia Beach 12.6 12.5 12.8
Virginia 15.4 14.9 14
HP2020 14.5 14.5 14.5
34 www.ghrconnects.org
35 www.ghrconnects.org• Lung Cancer
Since 2007, Lung cancer mortality rates in Norfolk and Virginia Beach have steadily
decreased. Lung cancer is the second most commonly diagnosed cancer (excluding
non-melanoma skin cancer) and a leading cause of cancer death among both men
and women in the United States. Cigarette smoking is the strongest risk factor for
lung cancer. Other risk factors include exposure to second-hand smoke, radon, and
asbestos. 36
Lung Cancer Mortality (rate per 100,000)
2007-2011 2008-2012 2011-2015
Norfolk 55.9 53.4 50.0
Virginia Beach 47.5 47.1 44.0
Virginia 49.5 48.2 44
HP2020 45.5 45.5 45.5
Prostate Cancer
• Prostate cancer mortality rates in Norfolk decreased between 2007 and 2012;
however, the rates increased by 2015. Norfolk rates are above Virginia rates and the
Healthy People 2020 target. Virginia Beach rates have steadily decreased and are
below HP2020 goals. The strongest risk factors for developing Prostate cancer are
age, race/ethnicity, and family history. 37 Prostate cancer is the most commonly
diagnosed cancer (excluding non-melanoma skin cancer) and the second leading
cause of cancer death among men in the United States.
Prostate Cancer Mortality (rate per 100,000)
2007-2011 2008-2012 2011-2015
Norfolk 26.2 24.7 27.9
Virginia Beach 21.0 20.7 18.8
Virginia 23.5 22.4 20.2
HP2020 21.2 21.2 21.2
36 www.cancercoalitionofvirginia.org/VirginiaCancerData
37 www.cancercoalitionofvirginia.orgBreast Cancer
• Breast cancer is the most commonly diagnosed cancer (excluding non-melanoma
skin cancer) and a leading cause of cancer death among women in the United
States. Between 2007 and 2012, Breast cancer mortality rates in Norfolk steadily
decreased; however, they increased by 2015. Virginia Beach mortality rates
remained steady since 2007. Both cities are above Virginia rates and the HP2020
target.
Breast Cancer Mortality (rate per 100,000)
2007-2011 2008-2012 2011-2015
Norfolk 24.1 23.8 28.5
Virginia Beach 23.1 23.3 23.1
Virginia 23.4 22.7 21.8
HP2020 20.7 20.7 20.7
Both key stakeholders and the community survey respondents rated Cancer in the top
10 health concerns. They did not include Cancer in the top ten Services that need
strengthening.
Violence in the Community
Violent crimes are defined as physical offenses and confrontations between individuals,
including homicide, forcible rape, robbery, and aggravated assault. High levels of violent
crime result in feelings of being unsafe and may deter people from engaging in healthy
behaviors such as exercising outdoors.
The table on the following page shows the violent crime rates in Norfolk and Virginia
Beach. 38 Since the last reporting period (2012-2014), the general violent crime rate in
Norfolk and Virginia Beach has increased.
Norfolk’s violent crime rate is significantly higher than Virginia and Virginia. Norfolk
homicides are also significantly higher than Virginia; Virginia Beach homicides are slightly
lower. Firearm fatalities in Norfolk are also much higher than Virginia Beach and Virginia.
38 www.countyhealthrankings.comVirginia
Health Issue Norfolk Virginia
Beach
Violent Crime Rate
(per 100,000) 2014- 603.0 152.0 207.0
2016
Homicides (2011-
13.0 4.0 5.0
2017)
Firearm Fatalities
19.0 10.0 11.0
(2011-2017)
Community Survey respondents listed Violence in the Community in the top five health
concerns; it was in the top ten concerns for key stakeholders. It was not in the top ten
Services that Need Strengthening.
Smoking/Tobacco Use
Tobacco use is the agent most responsible for avoidable illness and death in America.
Almost half a million Americans die prematurely due to tobacco use. Exposure to
secondhand smoke for non-smokers can cause a wide range of adverse health effects
such as cancer, respiratory infections, and asthma. The percentage of adult smokers in
Norfolk (20.0%) and Virginia Beach (17.1%) is higher than Virginia (15.0) and the
Healthy People 2020 goal of 12.0%. However, the percentages have decreased since
2014 from 22.5% in Norfolk and 19.0% in Virginia Beach. 39
With a rate of 38.3 (per 100,000), Norfolk has some of the highest rates of chronic lower
respiratory mortality across the Hampton Roads region; however, the rates have
decreased by 14.4 (per 100,000) since 2014. The rates in Virginia Beach have been
declining since 2010, with a 3.3 (per 100,000) decrease since 2014. Norfolk’s rate is
significantly higher than Virginia, while Virginia Beach is slightly lower than Virginia. In
addition, the percentage of Norfolk residents and Virginia Beach who reported they had
asthma has remained statistically steady since 2014.
Chronic obstructive pulmonary disease (COPD) refers to a group of diseases that cause
breathing problems. The primary cause of COPD is tobacco use.The percentages of
adults with COPD in Norfolk and Virginia Beach are statistically steady since 2014.
Hospital utilization rates due to COPD and community acquired pneumonia in Norfolk
are higher than Virginia, whiles Virginia Beach rates are lower. (See table on following
page.)
39 www.ghrconnects.orgVirginia
Norfolk Virginia HP2020
Beach
Lung Cancer Mortality Rates
50.0 44.0 44.0 45.5
(per 100,000) 2011-2015
Lung & Bronchus Cancer
Incidence Rate (per 100,000) 74.7 69.9 58.9 --
2011-2015
• Asthma is a result of inflamed air passages which cause difficulty with breathing. It is
one of the most common diseases of children and millions of adults in America.
Exposure to cigarette smoke, among other allergens, can cause asthma. The
percentage of people with asthma in 2016 in higher than Virginia Beach. While the
Norfolk percentage increase slightly (.1%) since 2016, Virginia Beach remained the
same. Since 2014, hospitalization rates due to asthma decreased in Norfolk by
10.1% and Virginia Beach 12.1%. 40
• Lung cancer was addressed in a previous section; however, it is included in this
section because tobacco use is the greatest risk factor for lung cancer.
Smoking/Tobacco Use was listed in the Survey top ten health concerns by key
stakeholders and the community. It was not included in the top ten Services that Need
Strengthening.
Alzheimer’s Disease/Dementia
Dementia is not a specific disease, but is an umbrella term for a group of symptoms
describing a decline in mental abilities. Alzheimer’s disease is a brain disease that
increases over time and is the most common form of dementia. According to the
Alzheimer’s Association, Alzheimer’s is the 6th leading cause of death in the United
States and every 65 seconds someone develops the disease. 41 In 2017, 2,549 people
died from Alzheimer’s disease
in Virginia. In Norfolk, the
percentage of those
diagnosed with Alzheimer’s
disease or dementia is 11.5%.
The percentage for Virginia
Beach is slightly better at 10.5%. 42
40 www.ghrconnects.org
41 www.alz.org
42 www.ghrconnects.orgAlzheimer’s disease was selected in the top ten top concerns by key stakeholders on the survey. A related category of Aging Services was selected by both key stakeholders and the community for Services that Needs Strengthening. Chronic Pain Chronic pain is pain that persists for weeks, months and years. There may have been an injury or illness, but the pain continues hurting after the initial condition heals. Some other causes of chronic pain are arthritis, osteoporosis, osteoarthritis, and rheumatoid arthritis, among others. Arthritis is the number one cause of disability in the United States. More than 50 million adults have diabetes, a disorder of the joints, bones, muscles, and cartilage. Two of the most common types of arthritis are osteoarthritis and rheumatoid arthritis. Osteoarthritis is a degenerative joint disease. With osteoarthritis, a joint’s cartilage breaks down and can cause bony overgrowth. Rheumatoid arthritis is an autoimmune disease that usually affects the small joints in the hands and feet. It can also affect other organs in the body. 43 Since 2014, the percentage of adults with arthritis has decrease in Norfolk by 1.3%. it has increased in Virginia Beach by 1.5% in the same time period. Since 2017, the percentage of older adults diagnosed with rheumatoid arthritis or osteoarthritis has decreased in both Norfolk and Virginia Beach by 3.8% amd 3.4% respectively. Although the percentages are decreasing in both cities, they are still higher than Virginia. Other Key Findings This section provides an overview of other key findings and perceptions of health within the DePaul Medical Center community, which includes the cities of Norfolk and Virginia Beach. It combines and compares data from the Community Health Needs Assessment with an analysis of secondary data. In addition to the top ten health concerns, the Survey asked participants to select the top five most important options from a list of approximately 25 choices. The questions asked about health concerns for children and teens (ages 0-17), healthcare services that need strengthening, access to healthcare barriers, and community assets that need strengthening in their community. 43 www.ghrconnects.org
Services that Need Strengthening - Adults
The top ten Services that Need Strengthening based on key stakeholder and
community participants are listed below. It is interesting to note that eight of the top ten
services were selected on both surveys. Access to Care and Primary Care Services
were included in the key stakeholder top ten Services that Need Strengthening.

Dental/Oral Health and Public Health Services were among the top ten for community
participants.
        Behavioral/Mental Health              Chronic Disease Services
        Heath Insurance Coverage              Dental/Oral Health Services
        Access to Care                        Care Coordination & Transitions of Care
        Aging Services                        Health Promotion & Prevention Services
        Alcohol/Substance Abuse Services      Public Health Services

Services that Need Strengthening – Children and Teens (ages 0-17)
As with the top ten Services that Need Strengthening – Adults, Behavioral/Mental
Health Services is listed as the most important service by both key stakeholder and
community participants. In addition, eight of the top ten Services that Need
Strengthening for children were selected on both Survey participants. Self Management
Services and Social Services were included in the key stakeholder top ten selections.
Primary Care, Public Health Services and Social Services were in the top ten for
community participants. Community Survey participants rated Child Abuse Treatment
Services and Alcohol/Substance Abuse Disorders equally.Key Stakeholders rated
Dental/Oral health Services and Self-Managemant Services equally. Much of the
quantitative data around children and teens is limited due to confidiality; therefore, much
of the information in this section and the next are primarily qualitative based on
comments included on the Surveys and the Community Dialogues.

The list of the top eleven Services that Needs Strengthening – Children and Teens is
below.
       Behavioral/Mental Health                     Self-Management Services
       Health Insurance Coverage                    Public Health Services
       Parent Education & Prevention Programs Dental/Oral Health Services
       Child Abuse Prevention & Treatment           Care Coordination & Transitions of Care
       Foster Care                                  Primary Care
       Alcohol/Substance Abuse Disorders
Health Concerns for Children and Teens (ages 0-17)
When asked about health concerns related to children and teens, eight of the top ten
health concerns were included on both the key stakeholder and community Survey
responses. Key Stakeholders included Dental/Oral Care and Sexually Transmitted
Infections in their top ten health concerns for children. The community included
Smoking/Tobacco Use and Teen Pregnancy in the top ten.
Behavioral/Mental Health Violence in the Community
Overweight/Obesity Hunger
Bullying Smoking/Tobacco Use
Alcohol/Substance Abuse Sexually Transmitted Infections
Violence in the Home – Child Abuse Teen Pregnancy
Behavioral/Mental Health
Emotions as children reach their teen years may be difficult to understand and manage.
Teens may experience depression or volatile emotions leading to problems at home
and school, eating disorders, drug abuse, among others. The percentage of teen who
feel sad or hopeless is the same in Norfolk, Virginia Beach, and Virginia at 25%. The
hospitalization rate due to pediatric
Virginia
mental health has increased in Health Issue Norfolk Virginia
Beach
Norfolk and Virginia Beach since
Teens who Felt Sad or
2012. Norfolk has experienced an 25.0% 25.0% 25.0%
Hopeless (2013)
increase of 26.6 hospitalizations and
Virginia Beach has seen an increase Hospitalization Rate due to
Pediatric Mental Health (per 55.9 47.0 29.9
of 20.3 hospitalizations. Both cities 10,000) 2014-2016
are significantly higher than Virginia
with 29.9 hospitalizations. 44
Overweight/Obesity
Obesity in children and adults often leads to adult obesity. Health issues faced by obese
or overweight youth often lead to more severe health problems when they become
adults. There are many factors that contribute to childhood obesity such as lack of
access to healthy foods, inactivity, medication, and their physical/social environment. In
2013, the latest measurement period, 33% of Norfolk’s children and teens were
overweight or obese, which is higher than Virginia Beach (28%) and Virginia (28%). 45
44 www.ghrconnects.org
45 www.ghrconnects.orgBullying
Bullying can be physical or emotional. It can affect a child for life through lower self-
esteem, depression, and suicide. The latest data around bullying is from 2013.The
percentage of teens who reported being bullied in Norfolk (19%) is lower than Virginia
Beach (20%) and Virginia (20%).
Alcohol/Substance Abuse
Research shows that teens who begin drinking alcohol at a young age tend to develop
an alcohol dependency as they become adults more frequently than those who do not
drink before age 21. In 2013, the most recent measurement year, Norfolk had the
lowest percentage (26%) of teens who reported using alcohol. Twenty-nine percent
(29%) of Virginia Beach teens reported using alcohol, which is 1% lower than Virginia.
Violence in the Home – Child Abuse
Child Abuse takes many forms – neglect, physical, sexual, and emotional – and can
have long-term effects damaging self esteem, the abiity to form healthy relationships,
and to function in a healthy manner. Norfolk saw a steady decrease in child abuse rates
from 2011 to 2014 from 7.6 per 1,000 children to 5.5. Since 2014, the rate in Norfolk
has significantly increased to 11. The rate in Virginia Beach has steadily decreased
from 4.1 per 1,000 children to 2.8.
Hunger
Hunger can affect people from all walks of life and many Americans are one job loss or
medical crisis from experiencing food insecurity. In the United States, one in six hildren
may not know where there next meal will come from or when. 46 ood Insecurity results
from a limited or uncertain availability of healthy foods. Scarce food resources can lead
to health problems and arrested development. Children with food insecurity are at a
greater risk of developing chronic diseases such as obesity, asthma, and anemia. Other
risks may include hyperactivity, anxiety, and bullying.
• The percentage of children
Virginia
with food insecurity in Norfolk Virginia
Beach
Norfolk is higher than
Child Food Insecurity Rate (2016) 18.5% 12.7% 13.3%
Virginia Beach and Virginia.
Children who are SNAP Participants
Norfolk’s percentage has 45.4% 46.5% 44.8%
(2017)
slightly decreased (0.9%)
since 2013, while Virginia Beach’s percentage has decreased 3.5%. The
percentage in Virginia Beach is lower than Virginia. SNAP (Supplemental Nutrition
46 www.feedingamerica.orgAssistance Program) is a federal program that assists low-income families with
purchasing healthy food. The percentage of children who are SNAP participants in
Norfolk, Virginia Beach, and Virginia are close to being equivalent with Virgnia
Beach being slightly higher than Norfolk and Virginia. The 2017 rates for both cities
have steadily increased since 2013. 47
Smoking/Tobacco Use
Teens who start smoking are more likely to develop a long-term addition to tobacco
than those who do not smoke. According to the Centers for Disease Control and
Prevention, it is estimated that 5 million people under the age of 18 will die from
smoking-related diseases, which have been reviewed in a previous section. As of 2013,
the most recent data available, 18% of Norfolk teens reported using tobacco products.
This is lower that the percentages for Virginia Beach (20%) and Virginia (20%).
Sexually Transmitted Infections
Since 2013, diagnoses for Sexually Transmitted Infections (STIs) continue to increase.
As seen in the table, the rate of STIs in Norfolk is significantly higher than Virginia
Beach and Virginia. 48
Teen Pregnancy
Since 2011, the teen pregnancy rate per 1,000 females ages 15 – 17 significantly
decreased in Norfolk, Virginia Beach, and Virginia. Norfolk remains higher than Virginia
Beach and Virginia. 49
47 www.ghrconnects.org
48 www.ghrconnects.org
49 www.countyhealthrankings.orgAccess to Health Services
Survey participants were asked to select the top five barriers to accessing health
services from a list eleven options. The number one barrier identified by key
stakeholders and the community was Costs. The list of barriers to in order of priority is
below.
Costs Location of Health Services
Health Insurance No/Limited Home Support Network
Transportation Lack of Medical Providers
Time Off from Work Discrimination
Understanding the Use of Health Svcs No/Limited Phone Access
Childcare
Community Assets that Need Strengthening
There are many things that impact health outstide of the direct provision of healthcare.
Survey participants were ask to select the top five community assets they felt need to
be strengthened in their community. The list of the top ten selected by key stakeholders
and community participants in order of priority is below.
Transportation Homeless Services
Healthy Food Access Senior Services
Safe, Affordable Housing Employment Opportunity
Affordable Childcare Safe Play & Recreation Spaces
Social Services Neighborhood Safety
Identifying Needs
This report has highlighted health issues and services that are being effectively
addressed by the DePaul community, as well as health issues that may need additional
focus in the future.
Both the Survey and secondary data analysis identify important areas to consider
prioritizing in the community health improvement planning process. The community and
environmental factors highlighted by the community as concerns are important issues
that should be considered when planning initiatives or programs to address any of the
key health issues.You can also read