Breaking Down Barriers to Student Success - Expanding a High-Performance Workforce - PSE Update
←
→
Page content transcription
If your browser does not render page correctly, please read the page content below
Breaking Down Barriers
            to Student Success
            Expanding a High-Performance
            Workforce

July 2012

Table of contents
List of abbreviations ................................................................................................................................................................................ ii
List of figures .......................................................................................................................................................................................... iii
1.0 Executive summary ................................................................................................................................................................ 1
2.0 Introduction ............................................................................................................................................................................. 4
2.1. Background.....................................................................................................................................................................4
2.2. Scope of the analysis......................................................................................................................................................5
2.3. Purpose and objective ....................................................................................................................................................5
2.4. Overview of approach .....................................................................................................................................................6
3.0 Overview findings ................................................................................................................................................................... 8
4.0 Costs and benefits of at risk programming ........................................................................................................................... 13
4.1. Costs of programs and services for students at risk .....................................................................................................14
4.2. Cost-benefit analysis approach ....................................................................................................................................15
4.3. Cost-benefit analysis results .........................................................................................................................................18
4.4. Additional evidence of benefits .....................................................................................................................................19
5.0 Students at risk and government priorities ........................................................................................................................... 24
5.1. Post-secondary education and Ontario’s economy ......................................................................................................25
5.2. Supporting students at risk to graduate from college ...................................................................................................26
5.3. The costs of expanding post-secondary education ......................................................................................................27
6.0 College programs and services for students at risk .............................................................................................................. 28
6.1. Post-secondary educational attainment among students at risk ..................................................................................29
6.2. The role of colleges in educating students at risk .........................................................................................................32
6.3. Programming for students at risk ..................................................................................................................................33
6.4. The impact of supports for students at risk ...................................................................................................................42
6.5. Areas of opportunity......................................................................................................................................................44
Appendix A – Interview guides .............................................................................................................................................................. 50
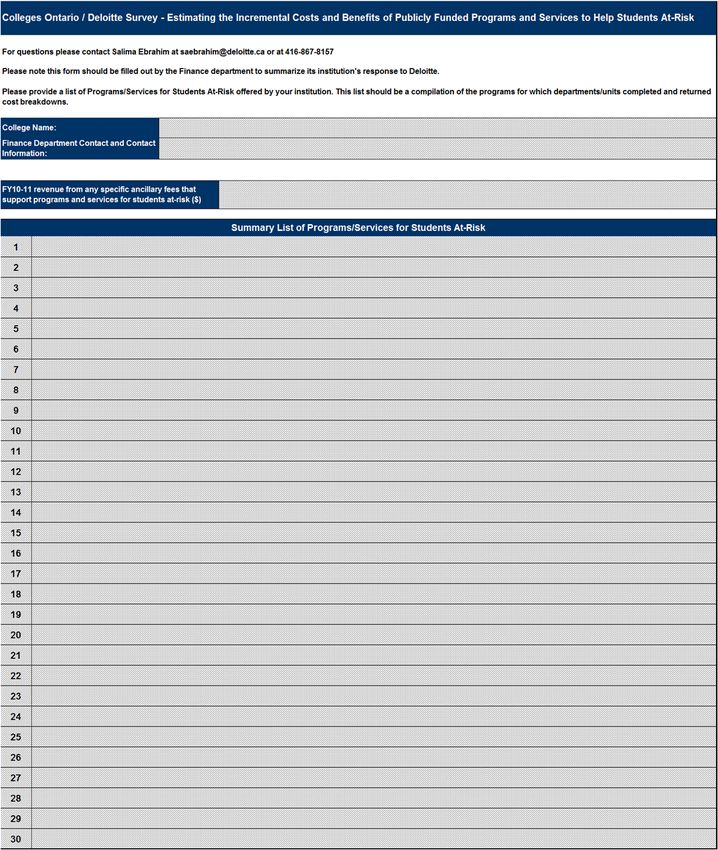
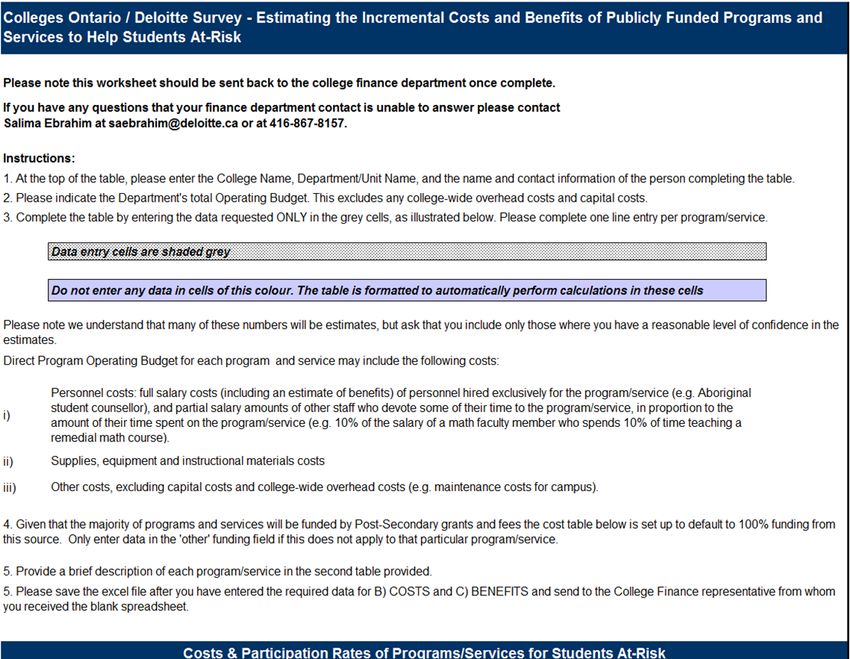
Appendix B – College financial survey.................................................................................................................................................. 58
Appendix C – Summary of financial survey methodology and results .................................................................................................. 65
Appendix D – Cost-benefit analysis assumptions and approach .......................................................................................................... 68
Appendix E – Project scope and approach ........................................................................................................................................... 72
Appendix F – Sources ........................................................................................................................................................................... 77
Breaking Down Barriers to Student Success: Expanding a High-Performance Workforce i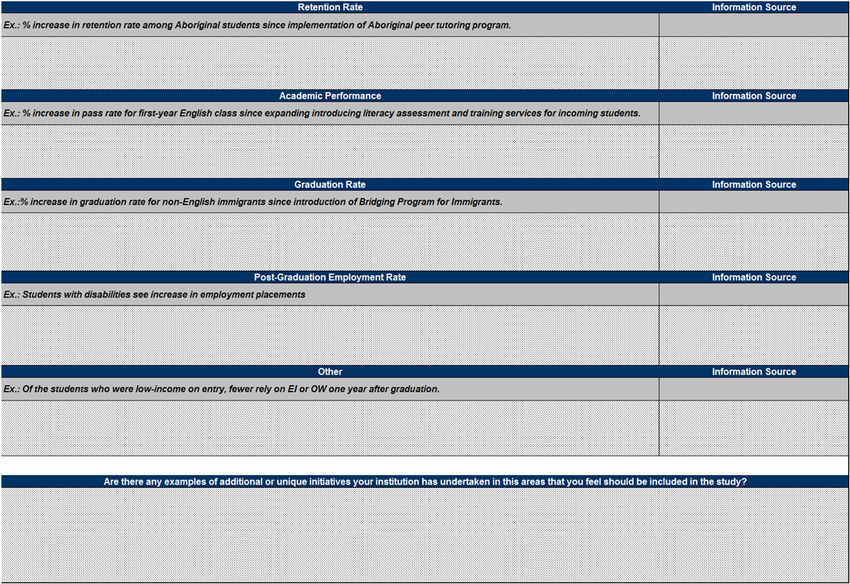
List of abbreviations

Below is a list of abbreviations used in the report.

ADHD                    Attention Deficit Hyperactivity Disorder
AODA                    Accessibility for Ontarians with Disabilities Act
CICE                    Community Integration Through Cooperative Education
EI                      Employment Insurance
ESL                     English as a Second Language
FTE                     Full-time equivalent
LINC                    Language Instruction for Newcomers to Canada Program

MTCU                    Ontario Ministry of Training, Colleges, and Universities

ODSP                    Ontario Disability Support Program

OECD                    Organization for Economic Cooperation and Development

OSAP                    Ontario Student Assistance Program

OSSD                    Ontario Secondary School Diploma

OW                      Ontario Works
PSE                     Post-secondary education
UK                      United Kingdom
US                      United States of America

Breaking Down Barriers to Student Success: Expanding a High-Performance Workforce   ii
List of figures

Below is a list of figures provided throughout the report.

Figure 1 – Breakdown Of Costs & Funding For Students At Risk ........................................................................................................15

Figure 2 – Cost-Benefit Analysis Framework........................................................................................................................................16

Figure 3 –Summary Of Government Cost-Benefit Analysis Calculations .............................................................................................18

Figure 4 – Summary Of Private Individual Cost-Benefit Analysis Calculations ....................................................................................18

Figure 5 – Ontario Job Gains/Losses By Highest Level Of Educational Attainment, January To June 2011 .......................................20

Figure 6 – Earnings Benefits Of Graduating From College Compared To Secondary School-Level Education: Summary Of Research

       Findings .......................................................................................................................................................................................20

Figure 7 – Mean Health Utilities Index Scores For Canadians Aged 25 To 34, By Highest Level Of Educational Attainment, 2000-2001

        .....................................................................................................................................................................................................22

Figure 8 – University And College Access Rates Of Various Underrepresented Groups In Ontario ....................................................33

Figure 9 – Beatty-Guenter Typology Of Interventions For Students .....................................................................................................34

Figure 10 – Perceived Level Of Benefit From Extra Support Among First-Year College Students .....................................................38

Figure 11 – Percentage Of Ontario College Students Who Self-Rate Their Ability As ‘Fair’ Or ‘Poor’ In Skill Areas ...........................38

Figure 12 – Summary Of Research Into Benefits Of Support Programs And Services ........................................................................44

Breaking Down Barriers to Student Success: Expanding a High-Performance Workforce                                                                                                                   iii
1.0 Executive summary
Post-secondary education is a cornerstone of Ontario’s continued prosperity. The Ontario government
realizes this and confirmed its commitment to expanding post-secondary education in the 2010, 2011 and
2012 provincial budgets. The government announced funding allocations in all three budgets to support
enrolment growth in the post-secondary sector. The 2011 budget committed the province to creating
60,000 more spaces in colleges and universities.
Colleges have a strong role to play in this equation, ensuring that students are not only attracted to post-
secondary education, but also retained until graduation. However, Ontario colleges play an even more
vital role in that they tend to attract students who do not usually pursue post-secondary education due to
real or perceived barriers and challenges in accessing and succeeding in higher education. These
students often come from underrepresented groups and, due to their unique circumstances, face a
number of risks to completing their credential, unless they receive additional support through services and
programs.
It is increasingly becoming the case that these students at risk are a part of the core population of Ontario
colleges. As a result, Ontario colleges spend a growing amount of funding to support students at risk of
not attending or graduating from college, through various programs and services. These programs and
services are important to students’ success, but they come at a significant cost to colleges’ operating
budgets.
In response to this situation, Colleges Ontario engaged Deloitte to conduct a cost-benefit analysis of the
programs that colleges provide to support students at risk. As part of this analysis, Deloitte also
conducted a number of interviews with various stakeholders, including current students and graduates
who had either accessed or were accessing support programs; senior college officials; and employers
who hire these students once they graduate from college.
Based on this analysis, Deloitte identified five over-arching findings:
Colleges are diverting funding from other purposes to provide support services to
students at risk. Financial data received from colleges illustrates that a sizeable portion of
funding is used to serve students at risk across various support programs and services. The total
value of this spending significantly exceeds the value of targeted grants from government
specifically geared toward at risk populations. As a result, colleges spend an additional 8% of
their total grant funding, some $107 million, to deliver these supports to students at risk.
Breaking Down Barriers to Student Success: Expanding a High-Performance Workforce 1
Colleges produce a skilled labour supply that will ensure Ontario’s economy remains
robust, by providing support services to students at risk and increasing graduation rates.
By supporting students to stay in college and succeed, programs and services for students at risk
increase graduation rates by an estimated 35 percentage points among students at risk.
Graduates in turn contribute to a labour force that is shrinking and requires an increasing number
of skilled workers to meet labour demand. These graduates generate returns to government in
terms of increased income tax revenue and reduced payments for social assistance and EI. The
return on investment to government is estimated at 14%, including a significant reduction in social
assistance costs. From a private perspective, these graduates benefit from a lifetime of higher
earnings due to graduating from college with the support of various programs and services, and
enjoy an internal rate of return of 11% on the investment of time and money to attend college.
Individuals and society experience additional benefits not captured in these calculated returns,
such as improved health, intergenerational benefits, and increased civic participation.
Providing support services for students at risk has become part of the core business of
colleges. The mandate of colleges is to be institutions of access. As such, colleges are seen to
be much more inclusive and open to the profile of students at risk. Colleges have increasingly
sought to increase enrolment among underrepresented populations in order to increase the
educational attainment of the population. As a result, colleges have undergone a fundamental
shift as the profile of students entering college today is very different compared to five to ten
years ago. Students increasingly require not only more types of support services, but also more
intensive and personalized assistance to ensure that they remain in the system until they
graduate.
Government and colleges should support all individuals in accessing a post-secondary
education. Post-secondary education is considered by many to be “the best investment you can
make” given that it increases one’s employment opportunities, lowers the duration and likelihood
of unemployment, and increases earnings.1 However, various studies show that not all students
consider post-secondary education upon graduating from high school, and many sub-populations
are underrepresented in the post-secondary educated population.
Given this, a more concerted effort should be made to reach these populations so that all
Ontarians may benefit from post-secondary education. An efficient way of doing so is to support
colleges in attracting and retaining these populations. For many underrepresented groups,
colleges are a much more popular route to post-secondary education than universities.
1
TD Economics, 2011.
Breaking Down Barriers to Student Success: Expanding a High-Performance Workforce 2
To meet the stated goal of an additional 60,000 spaces in Ontario’s post-secondary
education institutions , a concerted effort will need to be made to support colleges in
recruiting and retaining students at risk. Assuming that colleges expand their enrolments by
30,000, the institutions will have to invest over $20 million annually on support programs and
services for students-at risk. Support services for students at risk have demonstrated a capacity
for working with diverse groups of students, supporting different learning and career pathways,
retaining students in the system, and ultimately ensuring students transition from ‘at risk’ to
contributing members of society with meaningful employment. By continuing to strengthen these
programs, colleges and government can be confident that they are taking the right steps to
ensure that individuals from all walks of life have the ability to attend and graduate from post-
secondary education. This joint commitment will ultimately help to secure the future prosperity of
Ontario and advance equality among its citizens.
Each of these findings is explored in more detail throughout the body of this report.
Breaking Down Barriers to Student Success: Expanding a High-Performance Workforce 3
2.0                 Introduction

2.1.      Background

In 2010 the Ontario government committed to raising Ontario’s post-secondary education rate to 70%,
and to creating 20,000 additional spaces in Ontario’s colleges and universities.2 The Ontario government
continued its commitment to expanding post-secondary education in the 2011 budget, announcing over
$64 million in 2011-2012, and $309 million in 2013-2014, in additional operating grants to colleges and
universities in order to create 60,000 more spaces .3

Raising post-secondary education attainment rates in Ontario is a sound strategy to maintain a strong
and growing economy. With the retirement of the Baby Boomer generation and an increasing proportion
of jobs requiring skilled workers, Ontario will face a skilled worker shortage without concerted action. As
well, a more educated population is associated with higher personal incomes, higher income tax revenue,
lower transfer payments, improved health, and stronger civic engagement— benefits for individuals,
government, and society as a whole.

Many Ontarians who do not pursue post-secondary education have done so because they face barriers
and challenges to accessing and succeeding in college or university. To increase the province’s
education levels, some, if not all, of the gains will have to come from these underrepresented groups.
This requires institutions to support students in overcoming the challenges that would otherwise prevent
them from completing post-secondary education.

Ontario’s colleges have made concerted efforts already to support students at risk of not attending or
graduating from programs, through various programs and services. Support is offered to students through
all phases of the college experience, including: informing prospective students about college programs
and helping them decide whether to apply; helping students navigate the application and enrolment
process; orienting students to college; ensuring they are prepared for success; and helping students
overcome any personal and academic challenges they face while in college. These programs and
services are important to students’ success, but they come at a significant cost to colleges’ operating
budgets. Specific government grants have been provided to support certain services, but core funding is
also diverted from general programming to sustain these initiatives.

2
  Ontario Office of the Premier, “Speech from the Throne- Open Ontario Plan,” March 8, 2010,
http://www.premier.gov.on.ca/news/event.php?ItemID=11282&Lang=EN
3
  Ontario Ministry of Finance, “2011 Ontario Budget Chapter 1: Ontario’s Plan for Jobs and Growth,” March 29, 2011,
http://www.fin.gov.on.ca/en/budget/ontariobudgets/2011/ch1a.html

Breaking Down Barriers to Student Success: Expanding a High-Performance Workforce                                     4
Four major questions arise from this current situation. First, how much is Ontario’s college system
currently spending to support students at risk? Second, from the government’s perspective, is it a sound
investment of taxpayer’s funds to provide these programs and services? Third, what significance, if any,
does increasing college graduation rates among students at risk have for Ontario’s short-term and long-
term economic future? Finally, what does this all mean for the government’s commitment of adding
60,000 additional post-secondary spaces in Ontario?
Colleges Ontario therefore commissioned Deloitte Inc. to assess the costs and benefits of Ontario college
programs for students at risk, and provide recommendations to the Ontario government and colleges.
2.2. Scope of the analysis
The analysis focused on the role that Ontario’s 24 public colleges are playing, and could play in helping
students at risk to achieve their educational and career goals, by offering various support programs and
services, and the associated costs and benefits to government and private individuals. The analysis also
considered the importance of supporting students at risk for Ontario’s economy. Based on this
investigation, recommendations were developed for government and Ontario’s colleges.
2.3. Purpose and objective
The purpose of this analysis was to assess the role Ontario’s public colleges are playing to support
students at risk to achieve their educational and career goals, and thereby contributing to increased
employment rates and increased competitiveness of Ontario’s employers in the global economy. The
analysis also aimed to assess the costs and benefits of the efforts of colleges to support students at risk.
The findings of this analysis have been presented in the following report. The objectives of the report are
to:
Assess the extent to which providing support to students at risk is central to colleges’ missions:
Estimate how much the college sector spends to support students at risk, and how many
students are helped;
Highlight and describe challenges and solutions faced, and estimate a range of per-student
costs incurred, to assist students at risk;
Report on the views of college representatives and other stakeholders as to the importance
colleges place on addressing the needs of students at risk as part of their mandates;
Describe the views of employers on the reported skills shortage facing Ontario, the role of non-
traditional skilled workers in their business, and their interest in colleges’ efforts to support
students at risk;
Examine the differences in educational and career prospects for students at risk from obtaining
post-secondary educational credentials;
Assess the return on investment of spending to support students at risk;
Breaking Down Barriers to Student Success: Expanding a High-Performance Workforce 5 Describe new and/or particularly effective approaches to serving students at risk and increasing
retention and graduation rates; and,
Assess the importance of supporting colleges as they deliver programs and services to students
at risk, from the perspective of government facing a tough fiscal climate.
Assuming that colleges add 30,000 spaces in support of the government’s target, estimate the
proportion who may be at risk and the annual incremental system costs.
2.4. Overview of approach
Deloitte collaborated with an Advisory Committee formed by Colleges Ontario throughout the project. The
Advisory Committee included representatives from a cross-section of Ontario’s public colleges, as well as
representatives from Colleges Ontario. The purpose of the Advisory Committee was to advise Deloitte
and provide expertise on various matters, including:
Definition and understanding of ‘students at risk’ and applicable programs and services;
Detailed insight into the funding, operations, and current challenges of Ontario’s colleges;
Up-to-date data from the college sector on student enrolment levels, college spending, funding
levels, and student profiles;
Identifying and reaching out to interviewees for stakeholder consultations;
Questions for consultation sessions; and,
Analysis and interpretation of findings.
Deloitte relied on multiple sources of qualitative and quantitative evidence, including primary and
secondary sources, to conduct the analysis. Specifically, the analysis involved the following components:
1. Document/literature review and external research
2. Primary research on college spending levels to support students at risk and the inventory of
programs and services delivered
3. Consultations with stakeholder groups
4. Cost-benefit analysis of programs and services for students at risk
To analyze the costs and benefits of programs and services to support students at risk, Deloitte
administered the financial cost survey to Vice-Presidents of Finance for all 24 Ontario colleges (see
Appendix B – College financial survey). The response rate was 100%. To calculate the benefits
associated with these programs and services, Deloitte relied on the expertise of college administrators
and statistics from reliable sources, such as census data. An overview of the methodology is provided in
Section 4.2 of this report, and details on the approach and assumptions are provided in Appendix D.
Results of the cost-benefit analysis were validated with Subject Matter Experts in the fields of post-
secondary education and returns on investments in higher education.
Breaking Down Barriers to Student Success: Expanding a High-Performance Workforce 6Stakeholder consultations were conducted with four different groups—college administrators, employers, students, and government officials. With respect to the colleges, 8 colleges were chosen to visit that represented a sampling of geography, size and language. The site visits were conducted from July to September 2011, and included a day of interviews with senior level officials, and individuals responsible for programming aimed at students at risk. Further detail with respect to consultations can be found in Appendix E. The information collected across sources of evidence enabled Deloitte to develop an in-depth understanding of the role of the college sector in today’s economy, and the challenges facing students at risk in terms of graduating from college and contributing to the skilled labour force. Deloitte also acquired a deep appreciation of the range of programs and services colleges offer to support students, their impact, and the challenges colleges face to delivering these programs on a sustainable basis. Conclusions were drawn based on evidence gathered across multiple lines of evidence and detailed analysis of findings. Based on these findings and conclusions, recommendations have been made to government and Ontario’s colleges. Findings are interdependent and should be considered holistically. Taken together, a collaborative framework is proposed for government and colleges to strengthen post-secondary education in Ontario and achieve government targets for the province’s level of educational attainment. Breaking Down Barriers to Student Success: Expanding a High-Performance Workforce 7
3.0               Overview findings

This assessment of costs and benefits of programs targeted to students at risk is intended to identify those practices,
models, and ideas that result in positive educational outcomes. The analysis highlights a range of valuable practices
across the college sector within the constraints of current resources provided to colleges by MTCU. The innovative
and effective practices outlined are evidence of the importance colleges have placed on effectively serving students
at risk.

As discussed in section 4.0, there is a solid case to be made for continuing to support colleges to provide the
resources dedicated to recruiting and retaining students at risk of not graduating. Deloitte’s analysis revealed that, as
reported from college administrators, the sector invests considerably in programming for students at risk. Over $144
million of MTCU/post-secondary grant funding was spent on serving students at risk with targeted programs and
services in 2010-2011. This represents just over one-tenth of operational and special purpose grant funding to
colleges across the province.

While the cost of these programs and services is high, it is a worthwhile investment of government funding.
Programming for students at risk is associated with a 35 percentage point increase in the graduation rate for students
at risk. These graduates generate gains to the government in terms of increased income tax revenue and reduced
transfer payments, resulting in a 14% internal rate of return for government. Individual students will experience an
11% return on investing the time and money to attend and graduate college with the support of these services, due to
associated increases in earnings. Moreover, there are the intangible benefits in being able to provide students who
were once at risk the opportunity to change their life course and become productive citizens of the province and
country. This was emphasized in the interviews conducted with students and graduates who underlined the
importance these programs and support services played in helping them stay in college, graduate and ultimately find
meaningful employment. This outcome is beneficial not just for the individual, but also for their families, community,
and ultimately society as a while.

Deloitte also concluded that supporting students at risk is a reasonable strategy to increase the post-secondary
education attainment rate in Ontario and avoid an impending skilled labour shortage. Various economic analyses,
including work from the Conference Board of Canada and TD Economics, underline the need for governments to
focus on populations that are currently underrepresented in post-secondary education institutions in order to increase
the post-secondary attainment rate in the population. Increasing education levels in Ontario will mitigate the
impending skilled labour shortage, and help maintain Ontario’s advantage in the global economy. This conclusion is
supported by our interviews with students and graduates who have accessed these programs and, consequently,
have been successful in their studies and in finding employment. Employers also told Deloitte that because of the
efforts from colleges, students at risk graduate from college as skilled, competitive workers in the labour market.

It is among at risk populations where potential gains in educational attainment can be made, provided the appropriate
supports are in place to attract them to college and help them overcome barriers they face. Deloitte estimates that in
order to fulfill half of the Ontario government’s commitment to creating an additional 60,000 post-secondary education

Breaking Down Barriers to Student Success: Expanding a High-Performance Workforce                                     8
spaces, Ontario colleges will have to spend an additional $22 to $37 million annually on targeted programming. This
range is based on a lower bound of 30% of the new students being at risk (the same as amongst the current student
population) and an upper bound of 50% of the new students being at risk (based on an assumption that these new
students may be somewhat more likely to be at risk than current students). College administrators assert that the
government should consider the costs of offering these programs and services when setting funding levels, as this
programming is necessary for so many students to attend and graduate from college.
To increase post-secondary educational attainment among students at risk requires a joint effort between colleges
and government. Five key themes describing the current situation and a recommended approach for government and
colleges are provided below. The themes take into consideration Ontario’s geographic size and economic and
cultural diversity, but also reflect the fact that colleges as a whole are in the shared business of serving a wide range
of students with complex needs. If acted upon, these themes will support the continued viability and success of
programming targeted to students at risk, will enhance the programming available, and will ensure even more
students graduate from post-secondary education institutions and join the skilled labour force.
3.1. Colleges are diverting funding from other purposes to provide support services to
students at risk
Ontario’s college system plays a major role in developing skills and increasing the skilled labour supply by assisting
underrepresented and marginalized populations in accessing post-secondary education. They do so primarily through
providing skills enhancement programs and a range of support services to ensure students at risk of not graduating
remain in college and succeed. However, this is not without a significant cost.
The findings of the financial survey and cost-benefit analyses raise important considerations in light of the
government’s commitment to raising post-secondary attainment rates. The financial data received from colleges
illustrates that a sizeable portion of funding is used to serve students at risk across various support programs and
services. The total value of this spending significantly exceeds the value of targeted grants from government
specifically geared toward at risk populations. Consequently, colleges spend an additional 8% of their total grant
funding, some $107 million, to deliver these supports to students at risk.
.
3.2. Colleges produce a skilled labour supply that will ensure Ontario’s economy
remains robust, by providing support services to students at risk and increasing
graduation rates
In consultations with current students and graduates of college programs who accessed support services while at
college, it is very evident that these programs played an integral, if not essential role in ensuring students remained in
the college system until graduation. A number of students who demonstrate at risk characteristics faced challenging
life circumstances before entering college, and after years of low self-esteem, require support and a personal
connection for them to stay. In interviews with colleges, it was noted that students need to feel supported within the
first three to six weeks of them starting their program. As a result, colleges have invested heavily into their orientation
programs to serve this need. A sampling of specific solutions includes:
Proactive approaches for orientation
Breaking Down Barriers to Student Success: Expanding a High-Performance Workforce 9 Providing orientation three times a year as opposed to just in the fall semester
Consolidating support services in one location to create a ‘one-stop-shop’
Developing approaches for more individualized and one-on-one services for high needs students
Providing flexible hours for services
Drawing on Vincent Tinto’s model of student departure, these services promote academic and social integration for
students at risk. Academic and social integration work together to influence a student’s ongoing commitments to the
institution and to reaching their personal goals – which in turn, influences the decision to remain in, or to leave,
college.
By supporting students to stay in college and succeed, these programs and services increase graduation rates by 35
percentage points among students at risk. Graduates then contribute to a labour force that is shrinking and that
requires an increasing number of skilled workers to meet labour demand. These graduates generate returns to
government in terms of increased income tax revenue and reduced payments for social assistance and EI. The return
on investment to government is estimated at 14%. From a private perspective, these graduates benefit from a lifetime
of higher earnings due to graduating from college with the support of various programs and services, and enjoy an
internal rate of return of 11% on the investment of time and money to attend college. Individuals and society
experience additional benefits not captured in these calculated returns, such as improved health, intergenerational
benefits, and increased civic participation
Another strong benefit of investing in underrepresented groups is that these individuals who were once thought of as
‘at risk’ are now viewed as fully functional individuals of society. Employers noted that colleges succeed in helping
students move from ‘at risk’ to valuable employees.
In the coming years Ontario faces a serious skills shortage as greater number of workers prepare to retire and fewer
young people enter the workforce. Ontario should continue focusing on post-secondary education retention and
graduation rates, to ensure the province has enough skilled individuals for the current and future labour demands of
the economy. This skilled labour shortage is already taking place in some sectors and professions, such as health
care and welding.
3.3. Providing support services for students at risk has become part of the core
business of colleges
The mandate of colleges is to be institutions of access. As such, colleges are seen to be much more inclusive and
open to the profile of students at risk. Colleges have also increasingly sought to increase enrolment among
underrepresented populations in order to increase the educational attainment of the population. As a result, colleges
have undergone a fundamental shift as the profile of students entering college today is very different compared to five
to ten years ago. Students increasingly require not only more types of support services, but also more intensive and
personalized assistance to ensure that they remain in the system until they graduate.
College administrators informed Deloitte that delivering these services is increasingly part of the “core business” of
colleges, and requires a considerable investment of operating funds. Deloitte’s analysis substantiates reports from
college administrators that the costs of support programs and services—which are essential for an increasing
proportion of their student populations—take away resources needed to deliver quality academic programs. For
Breaking Down Barriers to Student Success: Expanding a High-Performance Workforce 10example, smaller class sizes in remedial math and English courses mean larger class sizes for students who do not
fall into the ‘at risk’ category.
The increasing population of students who are at risk of not graduating is a point that has already been
acknowledged by the government, but in the context of the K-12 education school system. As seen through the
various Student Success initiatives in the K-12 education system, the Ontario government has acknowledged that in
order to increase graduation rates, specific initiatives needed to be put in place to help helps students in grades 7 to
12 by tailoring their education to their individual strengths, goals, needs and interests. Through specific programming
and additional funds provided to school boards, the province has been able to increase its graduation rate from 68%
to 81%, an increase of 13%. This was done through a sustained and dedicated effort both through human and
financial resources, including putting in a number of programs such as additional English and math courses to help
build foundations in core literacy and numeracy, the implementation of Student Success Teams (principal, student
success teacher, guidance counselor, special education teacher and other educators) in high schools to provide
extra attention to students who need it, and credit rescue and credit recovery programs to help students regain lost
learning to stay on track to graduate.
These additional programs targeted to students who were at risk of not completing high school has proven to be an
extremely successful way of increasing graduation rates. Similar programming is currently taking place within
colleges; however, dedicated financial and human resources need to be allocated if it is to have a major impact.
Given this, funding allocations should consider the significant costs of increasingly essential support services to a
changing student population. This is particularly important given that at risk populations are the population among
whom gains in educational attainment can be realized, as proven by the impact of Student Success initiatives the
government has supported in the secondary school system.
3.4. Government and colleges should support all individuals in accessing a post-
secondary education
Post-secondary education is considered by many to be “the best investment you can make” given that it increases
one’s employment opportunities, lowers the duration and likelihood of unemployment, and increases earnings.4 This
is a point that is not lost on the Ontario government, which has committed to post-secondary education both through
their policy and budgetary platforms.
However, various studies show that not all students consider post-secondary education upon graduating from high
school, and many sub-populations are underrepresented in the post-secondary educated population. These include:
Aboriginal persons
Persons with disabilities
Individuals living in rural areas
Students from low-income families
Students whose parents did not attain post-secondary education
Delayed entrants
Individuals caring for dependents
4
TD Economics, 2011.
Breaking Down Barriers to Student Success: Expanding a High-Performance Workforce 11 Secondary school students with low grades
Secondary school students who are uncertain about their career direction
Given this, a more concerted effort should be made to reach these populations so that all Ontarians may benefit from
post-secondary education. An efficient way of doing so is to support colleges in attracting and retaining these
populations. For many underrepresented groups, colleges are a much more popular route to post-secondary
education than universities. For example, the gap in participation rates is much higher in university participation than
college participation for populations such as First Nations, persons with disabilities, and students from low-income
families.
Moreover, providing educational opportunities for all individuals helps equalize economic and social outcomes across
the populations. This is particularly true given that employers increasingly require post-secondary education among
employees. If underrepresented groups are not supported in applying for, attending, and succeeding in post-
secondary education, social and economic disparities will only increase as the labour market increasingly demands
skilled workers.
3.5. To meet the stated goal of an additional 60,000 spaces in Ontario’s post-
secondary education institutions , a concerted effort will need to be made to
support colleges in recruiting and retaining students at risk
If governments seek to increase enrolment in post-secondary education, their efforts should be targeted towards
those individuals who are at risk of not attending post-secondary education. It is among these populations where
gains can be made. To do so, however, requires that colleges are supported in their numerous efforts to attract
students at risk to college and assist them in overcoming various barriers and challenges. Supporting colleges will
also enable the sector to improve upon the programming that is currently in place across the province, so that
students at risk are served even more effectively. The cost-benefit analysis shows that there is a solid business case
for government to invest in increasing the number of students at risk in college, through expanding support services
and programs.
Support services for students at risk have demonstrated a capacity for working with diverse groups of students,
supporting different learning and career pathways, retaining students in the system, and ultimately ensuring students
transition from ‘at risk’ to contributing members of society with meaningful employment. By continuing to strengthen
these programs, colleges and government can be confident that they are taking the right steps to ensure that
individuals from all walks of life have the ability to attend and graduate from post-secondary education. This joint
commitment will ultimately help to secure the future prosperity of Ontario and advance equality among its citizens.
Breaking Down Barriers to Student Success: Expanding a High-Performance Workforce 124.0 Costs and benefits of at risk
programming
Ontario’s colleges have made a considerable investment to reach out to and support students at risk, which is a core
priority across the sector. Deloitte conducted a financial survey of colleges as well as a cost-benefit analysis of
programs and services for students at risk to determine how much these supports cost the sector, and whether or not
it is a sound investment of government funds. Deloitte also conducted a cost-benefit analysis from the perspective of
students themselves, to determine whether attending and graduating from college with the assistance of these
interventions is financially beneficial. Deloitte’s analysis concludes that supporting students at risk represents a good
financial investment of government funding, generating a positive return, and that college is a good investment for
individual students. As well, supporting students to graduate from college is associated with various other economic
and social benefits that are of value to individuals, communities, and government, but that are difficult to quantify and
have not been included in rate of return calculations.
Key Findings:
The total cost associated with supporting students at risk is $211,862,000
The cost of programs and services associated with supporting students at risk,
excluding financial aid administration and programs not funded through MTCU/post-
secondary funding, is $ $144,193,000
This represents approximately 11% of the total funding received by colleges from
MTCU in operating and special purpose grants in 2010-2011
These interventions produce an estimated 35 percentage point increase in graduation
rates for students at risk
From the perspective of government, the use of MTCU/post-secondary funding to offer
these supports generates an 14% internal rate of return
From the perspective of an individual student, attending college and graduating with the
support of these services generates an 11% internal rate of return
Increasing graduation rates is associated with other benefits to government and society
at large, such as improved health, improved civic participation, economic growth and
intergenerational benefits.
Breaking Down Barriers to Student Success: Expanding a High-Performance Workforce 134.1. Costs of programs and services for students at risk
The Vice-Presidents of Finance at all of Ontario’s 24 colleges were asked to complete a financial survey outlining the
costs associated with programs and services offered to students at risk in the 2010-2011 academic year. See
Appendix B for a copy of the survey. Respondents were
One student’s story
instructed on the definition of ‘students at risk’ for the purposes
of the study, and were provided with a list of applicable Sarah has successfully completed two
programs and services. Respondents were required to list and college diplomas, in public relations and
business administration, thanks in large
briefly describe the supports they offer that fall within the scope
part to the tutoring services offered at
of the survey. The survey then required college administrators her college. She was required to
to report on the estimated direct program operating budget for complete four accounting courses as
part of her studies; at mid-term in her
each program/service, as well as the estimated proportion of
first accounting course, she was failing.
the operating budget allocated to serving students at risk. If she had failed the course, she would
Indicated costs included departmental overhead costs on a pro- have been a semester behind in her
program in order to re-take the course.
rated basis. College-wide overhead costs were excluded from
While her teachers were very willing to
the survey. help, Sarah needed the additional
assistance a tutor could provide.
Results of the survey reveal that Ontario’s colleges spent Fortunately, Stephanie could access
tutoring services. Without her tutor, she
$$211,862,000 to serve students at risk with support programs believes she would have failed
and services in the 2010-2011 academic year. This total accounting.
includes funding for programs and initiatives that are outside of
Sarah is also the mother of a young son.
the MTCU/post-secondary grant funding structure. Examples of She had support from her family to
such funding programs include : ensure she could attend college during
the day. She told Deloitte that her
college used to offer day care services
Second Career
for student parents, but that the day
Dual Credit Initiative care closed a few years ago because of
School Within a College financial problems. She knew of
students who could not find other means
School-College-Work-Initiative of child care and had to leave college for
Apprenticeship Training a semester because of the closure.
Literacy and Basic Skills Program and Academic
Upgrading
This total also includes funding to administer financial aid supports to students at risk. For the purposes of the cost-
benefit analysis, however, non-MTCU/post-secondary funded programs and initiatives were excluded from the total
cost of supporting students at risk, to focus on services offered by colleges funded through MTCU/post-secondary
grants. Financial aid administration and assistance was also excluded since this could be considered a core function
of college administration, rather than a support program or service designed to address specific needs of students at
risk.
With these exclusions, the total cost of programs and services delivered to students at risk is $144,193,000. This
represents 11% of the total operating and special purpose grant allocations to colleges in Ontario in 2010-2011. In
other words, colleges spend just over one-tenth of funding allocations from government to attract, retain, and promote
the success of students at risk. A summary of the total costs to each college, both including and excluding financial
aid administration and non-MTCU/post-secondary programs, is provided in Appendix C.
Breaking Down Barriers to Student Success: Expanding a High-Performance Workforce 14Within the funding allocations to colleges are targeted funds to support specific at risk populations. Colleges received
approximately $37 million of such targeted funding.5 Compared to the approximately $144 million spent on support
programs and services delivered to students at risk, this leaves a difference in $107 million. Colleges are therefore
diverting over $100 million of funding from basic operations and academic programming to deliver a range of
supports to students at risk. This represents 74% of at risk student funding – and 8% of the total $1.348 billion in
funding delivered to colleges in 2010-2011 (see Figure 1 below).
These results confirm what Deloitte heard during consultations with colleges: supporting students at risk is part of the
core business of colleges that requires a substantial investment of college resources above and beyond what the
MTCU targeted funding. Administrators also told Deloitte that as the proportion of students who are at risk rises, the
costs of meeting their needs through additional programming have grown considerably. Colleges must divert funding
to meet this need. There is concern that the quality of academic programs will suffer as a result. For example, class
sizes in programs have increased in order to accommodate the rising costs of remedial and preparatory programs,
which are increasingly becoming a standard part of students’ college education.
Figure 1 – Breakdown of costs & funding for students at risk
$160,000,000
$144,192,929 $37,000,000
$140,000,000
26%
$120,000,000
$107,192,929
$100,000,000
$80,000,000
$60,000,000
74%
$40,000,000
$20,000,000
$0
Cost of Support Programs and Services Targeted Funds to Support Specific at- Funds Diverted From Basic Operations
Delivered to Students at-Risk Risk Populations and Academic Programming
4.2. Cost-benefit analysis approach
Evidently, programming to assist students at risk is costly for colleges. As described in section 5.0, Deloitte learned
from college administrators, students, employers, and secondary research that these supports are necessary to
ensure success for an increasing proportion of the student population. From a financial perspective, however, do the
benefits outweigh the costs?
A cost-benefit analysis was performed to determine whether the public costs of programs and services for students at
risk are worthwhile from the perspective of government. As well, Deloitte performed an analysis to determine whether
attending and graduating from college is a worthwhile investment for students at risk.
5
Based on 2010-2011 data on MTCU funding to colleges, provided by Colleges Ontario. Targeted funds included in the $37 million
total include: Aboriginal PSE Action Plans; Accessibility Fund for students with disabilities; Interpreters Fund; Support Services for
Hearing Impaired; and First Generation Access.
Breaking Down Barriers to Student Success: Expanding a High-Performance Workforce 15Framework of analysis
To calculate the costs and benefits from the government’s perspective, Deloitte used the total cost of MTCU/post-
secondary funded programming delivered to students at risk: $144,193,000. An additional cost to government to
supporting students at risk is the operating funding to colleges to educate students who would otherwise have
dropped out, but instead remain in college and graduate thanks to these programs and services. As well, government
faces a cost of lost income tax revenue from students attending college who otherwise would have worked and
earned income.
With respect to benefits accrued by government, various economic and social benefits are associated with increasing
college graduation rates. For the purposes of the analysis, however, a conservative approach was taken to estimating
the benefits of increased graduation rates for government. That is, total gains to government were calculated based
on direct monetary benefits in terms of increased tax revenue and reduced transfer payments.
In addition to calculating the return to government from funding used for programs and services to support students at
risk, the study also considered the private perspective: is it beneficial for the individual student at risk to attend
college, access these support services, and graduate? The private cost-benefit analysis considers how the out-of-
pocket and opportunity costs associated with attending college compare to the benefits realized over one’s lifetime.
Again, there are numerous financial and non-financial benefits associated with higher educational attainment, and
non-financial benefits may be associated with financial gain. For example, improved health may translate into lower
out-of-pocket health care costs. However, a conservative approach was taken to calculating private returns, and
benefits were calculated based on employment and income gains associated with higher education levels. Figure 2
below summarizes the costs and benefits taken into account to calculate the return on investment from both the
government and private perspectives.
Figure 2 – Cost-benefit analysis framework
Public (government) perspective Private (students) perspective
Spending by colleges for
programs/services for at risk students
Funding to colleges for higher Tuition costs
Costs
enrolment due to retention impacts of Lost after-tax income while in college
programs/services
Lost income tax revenue while
students are in college
Increased income tax revenue from Increased annual after-tax income
Benefits
graduates’ increased earnings due to increased earnings
Social assistance and EI savings
A complete list of assumptions used in the analysis is given in Appendix D, along with a detailed description of how
various costs and benefits were calculated.
Breaking Down Barriers to Student Success: Expanding a High-Performance Workforce 16Estimating the impact of programming for students at risk on graduation rates
In order to estimate the benefits of these programs and services, it was necessary to first determine the impact of
these interventions on graduation rates. In other words, it was first necessary to identify the population of students at
risk who graduate with the assistance of these interventions, who otherwise would not have attended or completed
college. To do so, Deloitte used an informed and conservative estimation based on primary and secondary research.
Ontario colleges were asked to provide an estimate of the percentage of students who are at risk and access at least
one of the programs and services indicated in their survey responses over the course of their college experience. The
median and average of responses from colleges exceeded 58%. External research sources estimate the percentage
of students who access various support services to be lower than what was reported by colleges.6 However, these
sources do not indicate the percentage of all students who have accessed at least one of several support programs
or services, and define services differently than this analysis. The estimate from colleges may also be higher from
data in other studies because colleges may not be able to distinguish the number of unique students who access
multiple programs, and may double-count students who access more than one service. Deloitte also reviewed data
from the province-wide Student Satisfaction Survey and individual college surveys. Therefore, a conservative
estimate of 30% was used, which was validated with One student’s story
college administrators on the Advisory Committee.
When Kristin began a two-year college program,
Colleges were also asked to estimate the percentage she turned to support from counseling and
point increase in graduation rate for students at risk disability services to help her pursue her studies.
While she found the services very helpful, she was
as a result of these programs and services. In other
still struggling in her courses and suffering from
words, colleges were asked to identify what panic attacks. Her teachers and counselors
percentage of students at risk would not have suggested she transfer to the Community
Integration through Cooperative Education (CICE)
attended and graduated from college without support
program. This program, designed for students with
from programs and services. An informed estimate intellectual disabilities and other major barriers to
from colleges was used because available data on learning, integrates co-operative education and
additional learning supports. Kristin found the
the impact of support programs and services are
cooperative element to be very engaging. The
slim,7 and are generally focused on only specific program helped her to understand how she learns
initiatives, rather than the combined impact of best, and she learned techniques for learning more
effectively. Kristin believes the CICE program
programs offered to students, beginning from enabled her to overcome her challenges to
outreach to graduation. Furthermore, available data learning and successfully complete her diploma.
report the impact on students in general, rather than
on a particular population of students—in this case,
students at risk.
6
For example, the Pan-Canadian Study of First-Year College Students conducted by HRSDC found that 14.8% to 31.1% of
students accessed various support services. Based on responses to the Ontario College Student Engagement Surveys from 2006 to
2009, approximately 20% of students access critical services like academic advising, literacy, and learning skills services (Peter
Dietsche, 2011). It is important to note, however, that these access rates are for individual programs and services, while our study
sought to identify the percentage of students who are at risk and access at least one of a range of services. Therefore, it is
reasonable to presume a higher percentage than those reported in various surveys.
7
Quantifying the impact of support services faces numerous hurdles. In addition to the logistical and ethical challenges of
designating control groups who do not have access to services, it is very challenging to control for all other factors that influence
whether a person successfully graduates. Furthermore, students often access more than one service at a time, thereby making it
difficult to isolate the impact of any particular program. For further discussion on the challenges of measuring program impacts,
please see: Richard Wiggers and Christine Arnold, 2011.
Breaking Down Barriers to Student Success: Expanding a High-Performance Workforce 17You can also read