Briefing to the Legislative Council Panel on Financial Affairs - 1 February 2021 HONG KONG MONETARY AUTHORITY
←
→
Page content transcription
If your browser does not render page correctly, please read the page content below
HONG KONG MONETARY AUTHORITY

Briefing to the Legislative Council
    Panel on Financial Affairs

          1 February 2021

                                      1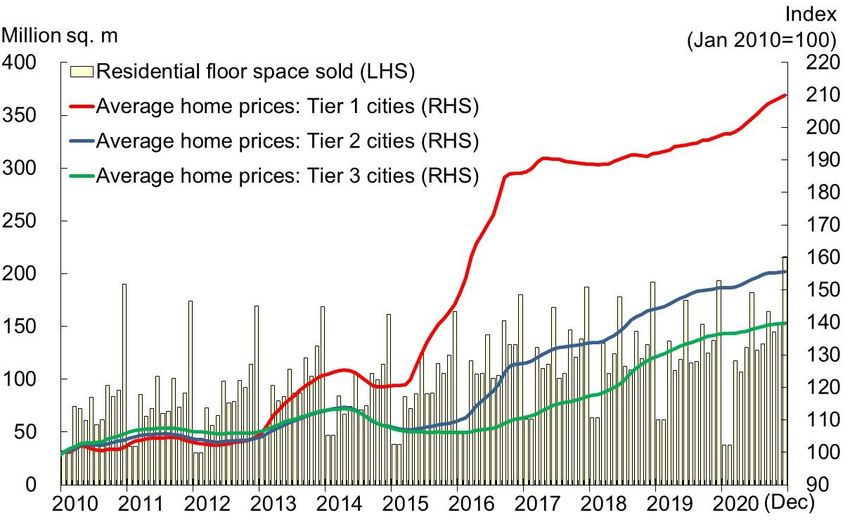
DISCUSSION TOPICS

Updates on
–   Financial and Economic Environment
–   Currency Stability
–   Banking Stability
–   Financial Infrastructure
–   Hong Kong as an International Financial Centre

–   Investment Environment and Performance of
    the Exchange Fund
–   Hong Kong Mortgage Corporation
                                                     2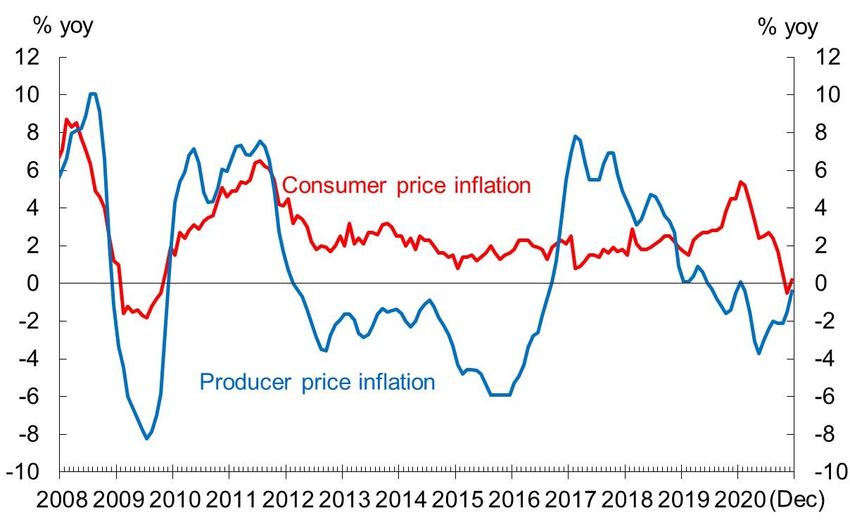
FINANCIAL AND ECONOMIC
     ENVIRONMENT

                         3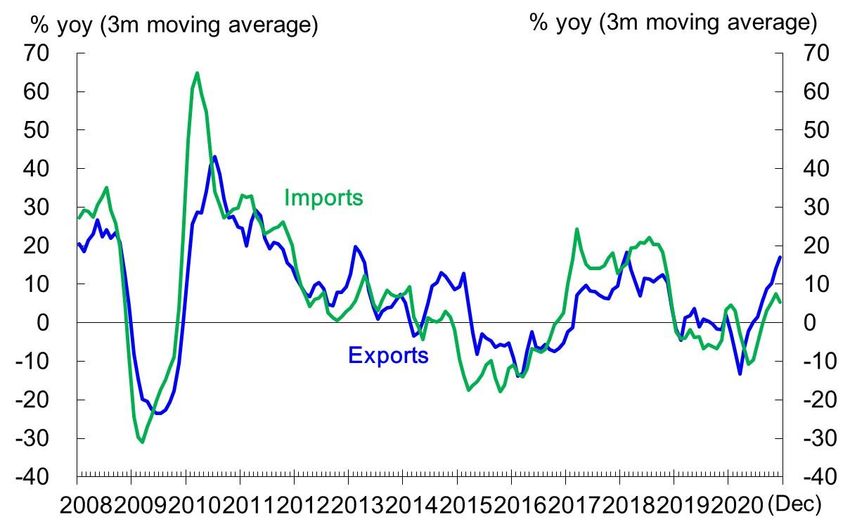
GLOBAL ECONOMIC GROWTH FORECASTS
                                         Real GDP Growth
      (% year-on-year)

                                                                  2020        2021
                                             2019
                                                                Forecasts   Forecasts

      US                                       2.2                  -3.5       4.4

      Euro area                                1.3                  -7.3       4.4

      Japan                                    0.7                  -5.3       2.4

      Asia (ex-Japan)                          5.0                  -0.3       7.4

        Mainland China                         6.0                  2.3        8.3

        Hong Kong                             -1.2                  -6.0       4.7

Sources: January 2021 Consensus Forecasts and Official Statistics                       4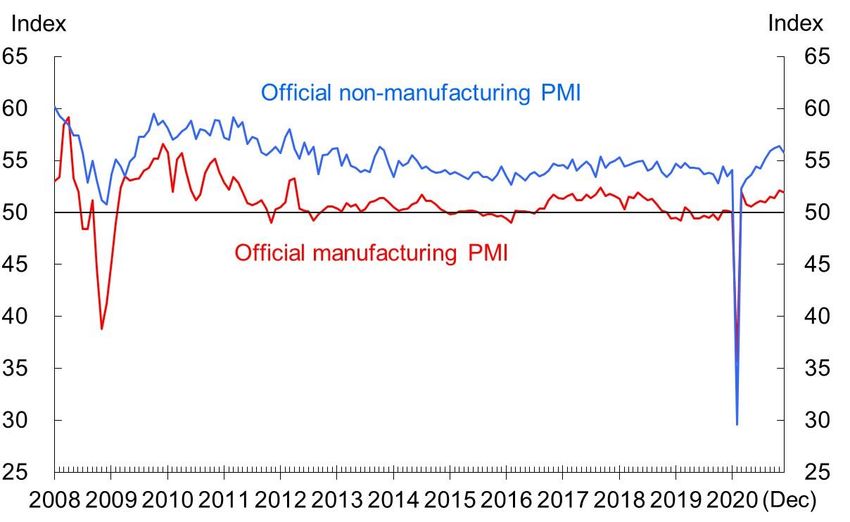
REAL GDP GROWTH IN
                MAJOR ECONOMIES

Source: CEIC                        5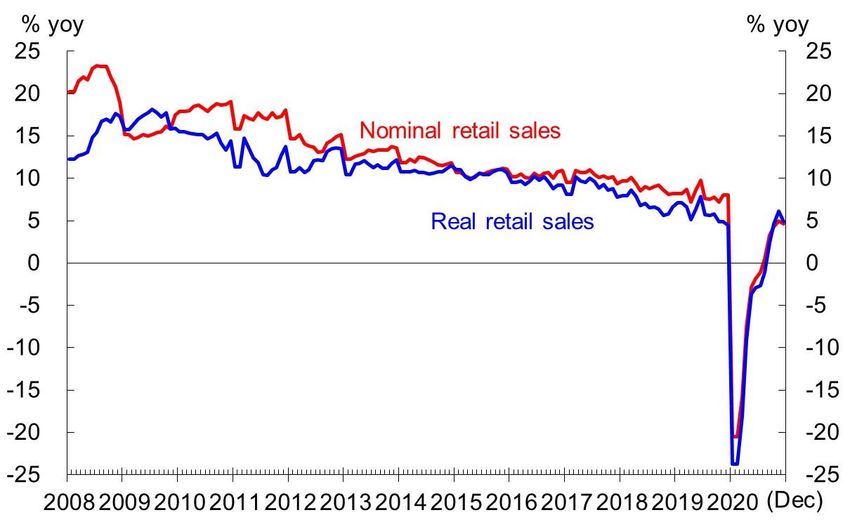
HEADLINE INFLATION IN
                MAJOR ECONOMIES

Source: CEIC
                                       6
PURCHASING MANAGERS’ INDEX
                       IN MAJOR ECONOMIES

               *Weighted average of the ISM Manufacturing and Services PMIs
Source: CEIC                                                                  7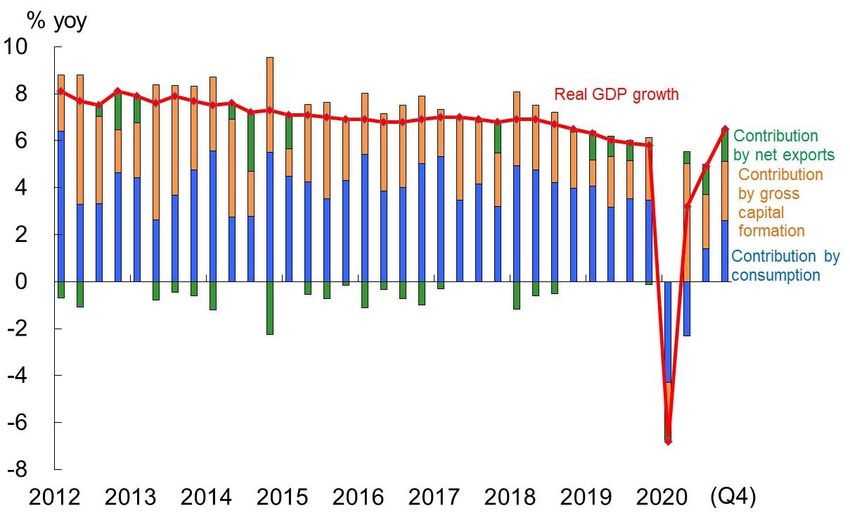
NOMINAL EFFECTIVE EXCHANGE
               RATE INDEX OF MAJOR CURRENCIES

Source: CEIC                                    8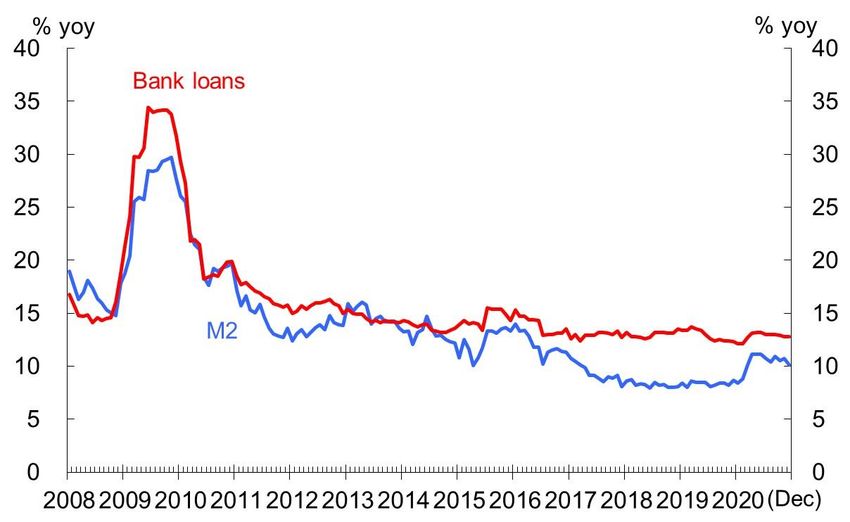
US: CONSUMPTION GROWTH &
               BUSINESS INVESTMENT ACTIVITY

Source: CEIC                                  9
US: LABOUR MARKET SITUATION

Source: CEIC                                 10
US: LABOUR FORCE PARTICIPATION

Source: CEIC                                    11
US: HOME PRICES

Sources: CEIC and Datastream                     12
US: HOME SALES

Sources: CEIC and Datastream                    13
US: FEDERAL GOVERNMENT DEBT
                          US federal debt held by the public

Sources: CEIC and Congressional Budget Office                  14
EURO AREA: SOVEREIGN BOND YIELDS
10-year sovereign bond yield
Note: 10-year Irish sovereign bond yield data is not available between 12 Oct 2011 and 14 Mar 2013
Source: Bloomberg 15EURO AREA: UNEMPLOYMENT RATE Source: Bloomberg 16
EURO AREA: OVERALL INDEBTEDNESS

Source: European Central Bank
Note: FR – France, IT – Italy, ES – Spain, PT – Portugal, GR – Greece, IE – Ireland
The latest figures are up to Q3/2020                                                  17
JAPAN: FINANCIAL MARKETS

Source: Bloomberg                              18
JAPAN: PUBLIC DEBT

Sources: Bank of Japan and CEIC                  19
MAINLAND CHINA: REAL GDP GROWTH

Source: CEIC
                                            20
MAINLAND CHINA: RETAIL SALES Note: January and February figures are the average annual growth rate for the first two months of the year Sources: WIND and HKMA staff estimates 21
MAINLAND CHINA:
                           FIXED ASSET INVESTMENT

Sources: CEIC and HKMA staff estimates
                                                    22
MAINLAND CHINA:
IMPORT AND EXPORT GROWTH
Sources: CEIC and HKMA staff estimates
23MAINLAND CHINA: PURCHASING
MANAGERS’ INDEX
Source: CEIC
24MAINLAND CHINA: INFLATION
Source: CEIC
25MAINLAND CHINA:
MONEY AND LOAN GROWTH
Source: CEIC
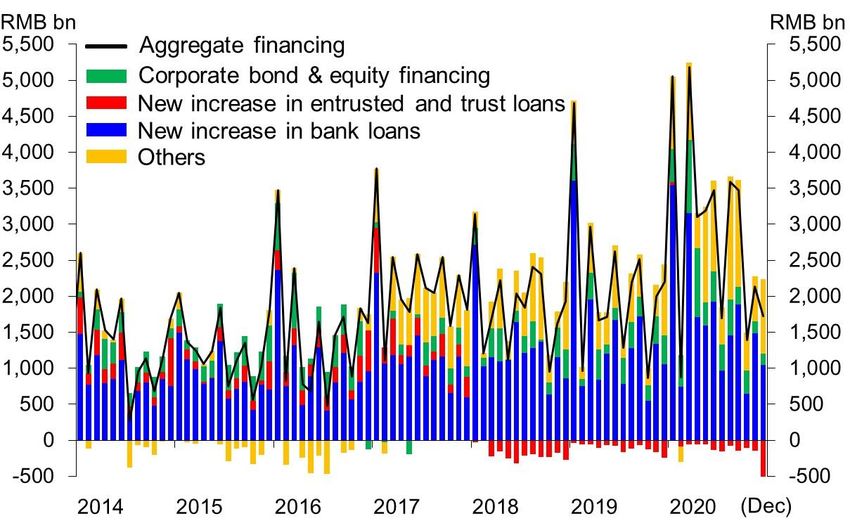
26MAINLAND CHINA:
AGGREGATE FINANCING FLOW
Source: CEIC
27MAINLAND CHINA: PROPERTY PRICE AND
TRANSACTION VOLUME
Sources: CEIC, WIND and HKMA staff estimates
28MAINLAND CHINA: HOUSING PRICE
CHANGES IN MAJOR CITIES
Sources: CEIC, WIND and HKMA staff estimates
29HONG KONG: REAL GDP GROWTH Source: C&SD 30
HONG KONG: ECONOMIC ACTIVITY

Source: C&SD                                  31
HONG KONG: BUSINESS OUTLOOK

Sources: C&SD and IHS Markit               32
HONG KONG: UNEMPLOYMENT RATE

Source: C&SD                                  33
HONG KONG: INFLATION

Sources: C&SD and HKMA staff estimates         34
HONG KONG: EQUITY MARKET

Source: Bloomberg                              35
HONG KONG:
                RESIDENTIAL PROPERTY PRICES

Source: Rating and Valuation Department       36
HONG KONG: TRANSACTION VOLUME
IN THE PRIMARY AND SECONDARY MARKETS
Source: The Land Registry 37HONG KONG: NEW RESIDENTIAL
MORTGAGE LOANS
Source: HKMA 38HONG KONG: COMPOSITE INTEREST RATE
% p.a.
4
3
2
1
0
2007 2008 2009 2010 2011 2012 2013 2014 2015 2016 2017 2018 2019 2020
Source: HKMA 39HONG KONG: LOAN GROWTH
AND ASSET QUALITY
Growth rate (%) % of total loans
Total loans (LHS)
25 1.0
Classified loans of retail banks (RHS)
20.2
20 0.75* 0.8
16.0 16.1
15 12.7 0.6
10 9.6 0.4
6.5 6.7
5 4.4 0.2
3.5
1.6
0 0.0
2011 2012 2013 2014 2015 2016 2017 2018 2019 2020
Note: * The figure is for 2020Q3 (Jan-Nov)
Source: HKMA 40HONG KONG: HOUSEHOLD DEBT
% of GDP % of GDP
100 100
Total household debt
90 87.7 90
Residential mortgage
80 Credit card advances 80
Loans for other private purposes
70 70
60 54.3 60
50 50
40 40
30 30
20 20
10 10
0 0
2005 2006 2007 2008 2009 2010 2011 2012 2013 2014 2015 2016 2017 2018 2019 2020
(Q3)
Source: HKMA 41CURRENCY STABILITY
42HONG KONG DOLLAR
SPOT EXCHANGE RATE
43AGGREGATE BALANCE
44DOMESTIC INTEREST RATES
4512-MONTH HONG KONG DOLLAR
FORWARD POINTS
46BANKING STABILITY
47BANKING SECTOR PERFORMANCE
Locally incorporated authorized institutions (AIs)
remained well capitalised
Source: HKMA 48
• The banking sector stayed well capitalised. The total CAR of locally incorporated AIs
stood at 20.3% at end-September 2020, well above the international minimum
requirement of 8%.BANKING SECTOR PERFORMANCE
Liquidity position remained robust
Source: HKMA 49
• In the third quarter of 2020, the quarterly average LCR of category 1 institutions was
156.8%, well above the statutory minimum requirement of 100%. For category 2
institutions, their quarterly average LMR was 55.9%, also well above the statutory
minimum requirement of 25%.BANKING SECTOR PERFORMANCE
Asset quality deteriorated slightly but remained at
a healthy level
Source: HKMA 50
• As the economic impact of the COVID-19 outbreak took hold, the asset quality of retail
banks deteriorated slightly but remained at a healthy level. The classified loan ratio of
retail banks increased to 0.75% at end-September 2020 from 0.71% a quarter earlier.
For the banking sector as a whole, the classified loan ratio increased to 0.84% from
0.79% during the same period. Both were significantly below the long-term average of
2% since 2000.BANKING SECTOR PERFORMANCE
Net interest margin (NIM) narrowed
Source: HKMA 51
• The NIM of retail banks’ Hong Kong offices narrowed to 1.24% in the first three quarters
of 2020 from 1.64% in the same period last year. The narrowed NIM was mainly due to
a decline in Hong Kong Interbank Offered Rates (HIBORs) in the second and third
quarter, which compressed banks’ margin on HIBOR-based assets.BANKING SECTOR PERFORMANCE
Credit growth slowed
Source: HKMA 52
• Total loans increased slightly by 1.6% in the first eleven months of 2020, or 1.8% on an
annualised basis.BANKING SECTOR PERFORMANCE
Loan-to-deposit ratios decreased
Source: HKMA 53
• Hong Kong dollar loan-to-deposit ratio edged down to 83% at end-November 2020 from
85% at end-September 2020.
• Similarly, loan-to-deposit ratio for all currencies decreased to 72% from 75% during the
same period.FIGHTING THE VIRUS
AND SUPPORTING THE ECONOMY
Extended Pre-approved
Enhanced SME Financing
Principal Payment
Guarantee Scheme
Holiday Scheme
• Principal payments of eligible • Principal moratorium for
small and medium-sized 80% and 90% Guarantee
enterprises (SMEs) deferred Products deferred up to 18
up to one year till April 2021 months till March 2021
• Enhanced the Special 100%
Loan Guarantee Scheme
• Aggregate number of cases involving credit relief (up to
December 2020):
Corporate customers: 58,000 cases (HK$740 billion)
Individual customers: 28,000 cases (HK$44 billion)
54PROPERTY MORTGAGE LOANS (RMLs)
Average loan-to-value (LTV) ratio and
Residential property price index and debt servicing ratio (DSR) for newly approved
transaction volume residential mortgage loans
Property Price Index Sale and Purchase
(Oct 1997 = 100) agreements Average LTV ratio (%) Average DSR (%)
250 16,000 70 45
Sep 2009*
64%
14,000 65 43
200 Oct 2020 Oct 2020
220 12,000 60 57%
41
10,000 55
150 Oct 2020 39
4,951
8,000 50
37
100 45
6,000 Aug 2010#
41%
35
4,000 40
Oct 2020
50 37%
35 33
2,000
Average LTV ratio Average DSR
0 0 30 31
2009 2010 2011 2012 2013 2014 2015 2016 2017 2018 2019 2020
2009 2010 2011 2012 2013 2014 2015 2016 2017 2018 2019 2020
Transaction volume (rhs) Property price index (lhs) * Before the first round of the HKMA’s countercyclical measures
was introduced
# When tighter requirement on DSR was introduced by the HKMA
Sources: R&VD and Land Registry 55
• The average LTV ratio of newly approved RMLs hovered at 57% recently, following a rise in
the earlier period, primarily driven by larger proportion of RMLs with mortgage insurance
which generally have a higher LTV ratio. The HKMA considers the risk manageable as the
portion of loans above the HKMA’s permissible LTV cap is covered by mortgage insurance.
Latest statistics on RMLs
Monthly Monthly
average average May Jun Jul Aug Sep Oct
in 2018 in 2019 2020 2020 2020 2020 2020 2020
Number of sale and 4,771 4,983 5,984 6,987 6,133 4,358 5,024 4,951
purchase agreements
Number of new RML 12,826 12,244 15,019 13,829 13,246 10,846 12,288 10,908
applications
Number of new RMLs 9,296 8,981 8,749 10,032 9,019 7,918 7,826 7,311
approved
Latest statistics on residential property prices
Property price index Period Property price index
Rating and Latest position 10/2020 220.3
Valuation
Department Recent peak 5/2019 229.6
(10/1997=100)
Peak in 1997 10/1997 100.0
Centaline Latest position 6/12/2020 177.8
(6/7/1997=100)
Recent peak 30/6/2019 190.5
Peak in 1997 19/10/1997 102.9INTERNATIONAL STANDARDS
IMPLEMENTATION
2021
• Amendments to Banking (Capital) Rules – revised
capital treatment on banks’ equity investments in
funds
• Amendments to Banking (Exposure Limits) Rules
– technical refinements
2022
• Amendments to Banking (Capital) Rules – Basel III
final reform package
56
As reported in the last FAP meeting, preparatory work for legislative amendments scheduled
for the next two years to implement the relevant Basel regulatory standards is on-going:
Year 2021
Legislative amendments targeted to be submitted to LegCo sometime in 2021 (potentially
sometime in second half of the year) are:
• amendments to the Banking (Capital) Rules to reflect the revised Basel capital
requirements for banks’ exposures to equity investments in funds; and
• amendments to the Banking (Exposure Limits) Rules to incorporate certain technical
refinements to enhance clarity and better reflect the policy intent of certain existing
provisions.
Year 2022
The above will be followed sometime in 2022 with the submission of amendments to the
Banking (Capital) Rules to implement two sets of capital standards under the Basel III
reforms. These consist respectively of:
• revisions to the credit risk, operational risk, and leverage ratio frameworks, as well as
requirements for the prudent use of internal models (which are scheduled to take effect
from 2023 as minimum standards for banks); and
• a revised market risk framework which is scheduled to take effect from 2023 for reporting
purposes by locally incorporated AIs (and no earlier than that for the actual capital
requirements).ANTI-MONEY LAUNDERING (AML)
• Commenced consultation on legislative proposals to
amend the Anti-money Laundering and Counter-
Terrorist Financing Ordinance (Cap. 615) (AMLO) to
align with the latest international standards by:
Strengthening Hong Kong’s Anti-Money Laundering
and Counter-Financing of Terrorism (AML/CFT)
regime by bringing virtual asset service providers
and dealers in precious metals and stones under
regulation
Amending various existing provisions to introduce
increased risk-based flexibility, such as
amendments to facilitate wider adoption of remote
on-boarding initiatives 57
• The Government launched a three-month public consultation on legislative proposals to
amend the AMLO with a view to bringing Hong Kong's regulatory regime up-to-date and in
line with the latest international requirements, as promulgated by the global standard
setter, Financial Action Task Force (FATF). This followed up on the FATF’s mutual
evaluation in 2019 which commended the effectiveness of Hong Kong’s AML/CFT regime,
and assessed Hong Kong’s regime as being in line with international standards.
• The proposed amendments include the introduction of (1) a licensing regime for virtual
asset service providers; (2) a registration regime for dealers in precious metals and
stones; and (3) certain technical amendments.
• One of the proposed technical amendments to the AMLO aims to provide flexibility with
regard to the additional measures in non-face-to-face situations (viz. Section 9 of
Schedule 2 to the AMLO). In line with the FATF guidance, the use of independent and
reliable digital identification systems is proposed as a recognised means which mitigates
risks in situations where a customer is not physically present for customer identification
and verification purposes, thus facilitating the wider adoption of remote on-boarding
initiatives by financial institutions.
• The consultation will close on 31 January 2021. The HKMA will review the industry
feedback and continue to work closely with the banking sector and relevant government
bureaux and departments on issues relating to the legislative proposals.RESOLUTION REGIME
• Current priority is the development of rules under the
Financial Institutions (Resolution) Ordinance (FIRO) on
contractual stays (Stay Rules), which would require the
adoption of a provision in certain financial contracts to
recognise any suspension of termination rights imposed
under the FIRO
• Conclusion on public consultation on the Stay Rules was
released in late December 2020. Draft text of the Stay
Rules was also issued at the same time for industry
consultation. Our current intention is to introduce the Stay
Rules into LegCo in the first half of 2021
58
• The current priority on resolution is the development of rules to be made by the Monetary
Authority as a resolution authority under the FIRO which will require Hong Kong
incorporated AIs and some of their group companies to include a provision in certain
financial contracts that are not governed by Hong Kong law so that the parties to the
contracts agree to be bound by a suspension of termination rights (i.e. “stay”) that may be
imposed by the Monetary Authority under the Hong Kong resolution regime. The Stay
Rules are intended to implement the relevant Financial Stability Board principles for
enhancing the effectiveness of cross-border resolution actions.
• Further to the launch of a two-month public consultation on the policy proposals for
formulating the Stay Rules earlier this year, the conclusion on the public consultation was
released by the HKMA in late December 2020. Draft text of the Stay Rules was also
issued at the same time for industry consultation. Our current intention is to introduce
the Stay Rules into LegCo for negative vetting in the first half of 2021.FINANCIAL INCLUSION
• Issuance of the Guideline on Banking Services for
Persons with Intellectual Disabilities
• Continued uptake of Simple Bank Accounts (SBAs)
service by small and medium-sized enterprises
• Facilitated banks to display the “Leave Home Safe” QR
codes at over 1,300 branches and premises to support
the fight against COVID-19
59
• Further to the issuance of the Practical Guideline on Barrier-free Banking Services by the
Hong Kong Association of Banks (HKAB) in March 2018, with the support of the HKMA,
HKAB engaged relevant stakeholders and developed the Guideline on Banking Services
for Persons with Intellectual Disabilities. The Guideline was issued in December 2020,
setting out the principles and good practices recommended for the banking industry when
providing banking services to customers with intellectual disabilities. Meanwhile, the
HKMA issued a circular to set out the expectation that banks should observe the
principles and recommended practices stipulated in the Guideline when providing
services to customers in need. Banks should also provide proper guidance and training
to frontline staff to ensure they can understand and communicate with customers properly,
and provide appropriate services to address the needs of customers.
• The HKMA continues encouraging banks to support and launch Simple Bank Account
(SBA) service to provide basic banking services with less extensive customer due
diligence measures, hence offering more choices to corporate customers. As of
end-2020, there are four banks offering such service with over 6,000 SBA accounts
opened.
• The HKMA worked with the Innovation and Technology Bureau, the Office of the
Government Chief Information Officer and HKAB to facilitate banks to display the “Leave
Home Safe” QR codes at bank branches and other customer interfacing premises, such
that users of “Leave Home Safe” mobile app can scan the QR codes to record their visit
history at different bank venues, thereby supporting the fight against COVID-19.BANKING CONSUMER PROTECTION
• Issued a circular on customer protection in respect of
the reform of interest rate benchmarks, reminding
banks of customer protection requirements
• Working with the Industry Associations to introduce
more than one Credit Reference Agency (CRA) for
consumer credit data in Hong Kong
• When ready, the Industry Associations will issue
tenders for selection of CRAs. The new system is
expected to be in operation by end-2022
60
• The HKMA issued a circular on 21 October 2020 on customer protection in respect of the
reform of interest rate benchmarks. The circular reminds banks to uphold customer
protection principles in line with the Treat Customers Fairly Charter and other applicable
requirements (e.g. Code of Banking Practice) throughout the processes of the reform and
transition of interest rate benchmarks. The circular also requires banks to develop
robust customer communication programmes for consumer education and outreach.
• The HKMA has been discussing with HKAB, the Hong Kong Association of Restricted
Licence Banks and Deposit-taking Companies and the Hong Kong S.A.R. Licensed
Money Lenders Association Ltd. (collectively referred to as “Industry Associations”) the
proposal of introducing more than one CRA for consumer credit data in Hong Kong. The
HKMA seeks to implement the relevant arrangement soon with a view to enhancing the
service quality of consumer CRAs and reducing the operational risk of having only one
commercially-run consumer credit information service provider in the market, particularly
the risk of single point of failure.
• The Industry Associations are working with the HKMA to sort out the details and proceed
with various preparatory work. When ready, Industry Associations will issue tenders for
selection of CRAs. The new system is expected to be in operation by the end of 2022.BANKING INVESTOR PROTECTION
• Shared with the industry key observations and good
practices noted from mystery shopping programme on
retail banks’ sale of investment and insurance products
• Provided guidance on investment services via non-face-to-
face channels, assessment of customers’ concentration
risk, and product disclosure for non-retail banking
customers with a view to streamlining the process
• Provided guidance on the expected standards in handling
life insurance policy replacement
• Worked closely with the Insurance Authority to further
extend the temporary facilitative measures for non-face-to-
face sale of certain insurance products amid COVID-19
61
• The HKMA issued a circular on 30 September 2020 to share with the industry the key
observations and good practices noted from the mystery shopping programme on retail
banks’ sale of investment and insurance products. The HKMA will continue to monitor
the selling practices of banks in its on-going supervision.
• The HKMA issued a circular on 23 December 2020 to provide guidance regarding
provision of investment services using non-face-to-face channels, assessment of
customers’ concentration risk, and product disclosure for non-retail banking customers
who are financially literate to understand the investment products, with a view to
streamlining the selling process to improve customer experience while protecting
customers.
• In light of the observations identified in the course of the HKMA’s supervisory work in
relation to banks’ handling of life insurance policy replacement, the HKMA issued a
circular on 20 October 2020 to share the observations and provide guidance to banks on
the expected standards in identifying, monitoring, reviewing and following up on policy
replacement.
• Amid the uncertainties brought about by COVID-19, the HKMA and the Insurance
Authority worked closely to further extend on 2 December 2020 the effective period of the
phase 2 temporary facilitative measures for non-face-to-face sale of certain insurance
products to until 31 March 2021. The scope of products covered (i.e. Qualifying
Deferred Annuity Policy, Voluntary Health Insurance Scheme products, term insurance
policies and certain refundable or renewable insurance policies that provide insurance
protection) and the implementation details of measures remain unchanged.PUBLIC EDUCATION
• Launched an online drama series
“STEPS” to introduce the major
functions and roles of the HKMA,
and raise interest of the younger
generation in joining the HKMA
• Launched an online parenting and
educational campaign (小小理財師) on
basic money management concepts,
banking and payment services
• Through the HKMA’s digital media channels
Promoted the merchant payment and bill payment
functions of Faster Payment System (FPS)
Publicised new batch of Silver Bond and issues to
note in subscription
Provided updates on Green Finance initiatives 62
• Launched an online drama series “STEPS” to introduce the major functions and roles of
the HKMA, and raise interest of the younger generation in joining the organisation through
the story of a young new recruit.
• Launched an online parenting and educational campaign (小小理財師) during Christmas
& New Year to educate kids on basic money management concepts, banking and
payment services through animation, games, worksheets and DIY toys.
• Through the HKMA's digital media channels:
Promoted the merchant payment and bill payment functions of FPS enabled by
scanning QR codes;
Publicised the new batch of Silver Bond and introduced its subscription arrangement
and issues to note; and
Provided updates on initiatives related to Green Finance, including the HKMA’s work
on the Alliance for Green Commercial Banks, and the development of strategy on
green and sustainable finance.DEPOSIT PROTECTION SCHEME (DPS)
• Completed comprehensive drill tests for implementing
electronic payment channels for DPS compensation
• Launched social media
campaigns “DPS Kung Fu
Duo” and “DPS Saving Duo
Comics” to raise awareness
and to deepen public
understanding of DPS
• Continued reaching out to
target audience groups via
various community
education activities
63
• The Hong Kong Deposit Protection Board completed the industry-wide drill tests for the
implementation of electronic payment channels for dispersing DPS compensation,
including the use of Faster Payment System (FPS). All participating banks have
systems and processes ready to effect compensation payments to depositors via FPS
during a payout situation. The use of electronic payment channels is expected to be
ready in the second half of 2021 following completion of procedures enhancements and
training of payout agents.
• Launched two social media campaigns: i) “DPS Kung Fu Duo” with two videos with the
theme of learning Kung Fu produced to promote the key features of DPS in a fun-to-watch
manner; and ii) “DPS Saving Duo Comics” in partnership with local illustrators to create
stories in relation to savings in comic format to reinforce public awareness and
importance of DPS protection on bank deposits.
• Continued reaching out to target audience groups through online and face-to-face
community education activities:
Conducted online briefing for recruiting DPS Ambassadors who are nearly-retired and
new retirees; and
Collaborated with NGOs to conduct small-group discussion sessions with the elderly
and homemakers to understand their saving habits and concerns while introducing
the coverage of DPS protection.HONG KONG ACADEMY OF FINANCE (AoF)
• Financial Leadership Development – more virtual
events launched under the Leadership Development
Programme
• Research Activities – released a new Applied
Research report by the Hong Kong Institute for
Monetary and Financial Research:
“The Green Bond Market in Hong Kong:
Developing a Robust Ecosystem for Sustainable
Growth” (November 2020)
64
Financial Leadership Development
• The following virtual events were organised under the Leadership Development
Programme in the fourth quarter of 2020:
A webinar on 9 November 2020 co-hosted by the AoF and the HKMA under the
Banking Talent Programme, featuring Ms Katherine Ng, Managing Director, Chief
Operating Officer and Head of Policy and Secretariat Services, Listing Division, Hong
Kong Exchanges and Clearing Limited; Mr Eric Hui, Chief Executive Officer, Zurich
Insurance (Hong Kong); and Mr Bruno Lee, Regional Head of Retail Wealth
Distribution, Wealth & Asset Management, Asia, Manulife Investment Management
(Hong Kong) Limited;
A conversation session with Mr Bill Winters, Group Chief Executive of Standard
Chartered PLC, on 10 November 2020;
A panel discussion titled “Talent Development for Financial Industry in Hong Kong” on
16 November 2020. It was chaired by Mr Carlson Tong, Chairman of the University
Grants Committee and Fellow of the AoF, featuring Mr Liu Che-Ning, Vice Chairman
of Global Banking, Global Banking and Markets of the Hongkong and Shanghai
Banking Corporation Limited; Professor Wei Shyy, President of the Hong Kong
University of Science and Technology; and Mr Andrew Weir, Regional Senior Partner
of Hong Kong, Vice Chairman of China, Global Chair of Asset Management and Real
Estate of KPMG; and
A conversation session with Mr Noel Quinn, Group Chief Executive of HSBC Holdings
PLC, on 8 December 2020.Research Activities
• A new applied research report was released in November 2020 by the Hong Kong
Institute for Monetary and Financial Research:
“The Green Bond Market in Hong Kong: Developing a Robust Ecosystem for
Sustainable Growth” - This report illustrates the state of the green bond markets in
Hong Kong and globally, sheds light on the benefits of green bonds to issuers and
investors, and discusses the strategies to accelerate the development of Hong Kong
as a leading international green bond hub.FINANCIAL INFRASTRUCTURE
65FINANCIAL INFRASTRUCTURE
• Financial infrastructure remains safe and efficient
• Operation of Bond Connect has been smooth;
actively promote Bond Connect to overseas investors
• Further refine the Hong Kong Trade Repository
(HKTR) for over-the-counter derivatives according to
the relevant local and international standards
66
Bond Connect
• Since the launch of Bond Connect on 3 July 2017, the related settlement operations
performed by the Central Moneymarkets Unit have been smooth.
• With the Delivery-versus-Payment settlement fully implemented in August 2018, as well
as the inclusion of renminbi-denominated Mainland government and policy bank
securities into the Bloomberg Barclays Global Aggregate Index in April 2019 and J.P.
Morgan Government Bond Index-Emerging Markets in February 2020, more overseas
investors have started to invest in the Mainland interbank bond market via the Bond
Connect. The HKMA has been maintaining close communications with the People's
Bank of China and other relevant Mainland institutions to explore enhancements to
Northbound Trading.
Over-the-counter derivatives trade repository
• Since the reporting function of the HKTR was launched in July 2013, reporting by banks to
the HKTR has been smooth.FASTER PAYMENT SYSTEM (FPS) in 2020
Registrations: 6.9 Million ( 71% from end-2019)
No. of HKD transactions: 130 Million ( 233% from 2019)
Value of HKD transactions: HKD 1,339 Billion ( 108% from 2019)
FPS usage diversified
Number of transactions in 2019 Number of transactions in 2020
67
• The number of registrations and turnover of the FPS have been growing steadily. Since
the launch of the system till 31 December 2020, the FPS recorded 6.9 million registrations
(including 4.43 million in mobile number, 1.12 million in email address, 1.21 million in FPS
ID and 0.11 million in Hong Kong ID number), up by 71% or 2.9 million registrations from
end-December 2019.
• The turnover of the FPS rose particularly fast amid the epidemic in 2020, as compared to
2019. The total number of transactions in 2020 rose two times from 2019. The average
daily turnover reached 505,000 (worth HK$5.2 billion and RMB95 million) in December
2020, equivalent to three times of that in December 2019 and tenfold of that in October
2018, the first full month after the launch.
• The usage of the FPS expanded to merchant payments and top-up transactions in 2020
from primarily P2P transactions initially.
• The FPS has launched a new feature on 6 December 2020, which allows citizens to link
their HKID number to their bank account for receiving payments from institutions. Given
HKID number is a piece of sensitive personal information, this new function is not
intended for making person-to-person payments. It will only be used by institutions
which already possess the HKID number of the recipients of the payments. Since its
launch on 6 December until end-December, the FPS recorded over 110,000 registrations
of the new feature in less than a month. Banks will promote this service to their
corporate customers, while the HKMA will also explore more use cases with the industry
and the Government. Corporate customers generally take time to understand the new
feature and need to upgrade their systems for application.LATEST FINTECH INITIATIVES
• Despite the pandemic, “Hong Kong Fintech Week 2020”
successfully attracted over 1.2 million viewers from more
than 130 economies
• Developing Commercial Data Interchange (CDI) to enhance
SMEs’ access to financial services
• Conducting Central Bank Digital Currency (CBDC) research
on cross-border payments with the Bank for International
Settlements Innovation Hub (BISIH) and the Bank of
Thailand
• Started pilot run on the connection between eTradeConnect
and the People’s Bank of China (PBoC) Trade Finance
Platform
68
• Hong Kong Fintech Week 2020
The event was held virtually from 2 to 6 November 2020.
The event was well received, with over 18,000 business connections made, helping to
facilitate much needed business opportunities for many industry players.
• Commercial Data Interchange
Conducting a Proof-of-Concept (PoC) to study the technical feasibility of building the CDI,
a consent-based financial infrastructure that would enable more secure and efficient data
flow between banks and sources of commercial data. With the CDI, SMEs could use their
own data to enhance their access to financial services.
Completed Phase 1 of PoC, with a focus on using trade-related data to facilitate trade
finance application process.
Conducting Phase 2 of PoC, which covers other commercial data sources, including
payment data.
• Research on using Central Bank Digital Currency for cross-border payments
Completed Phase 1 of research jointly with the Bank of Thailand, with a cross-border
corridor network prototype developed and joint report published in January 2020.
Conducting Phase 2 of research, which aims to explore business use cases in
cross-border trade settlement and capital market transactions. By the end of January
2021, HKEx, 19 participating banks, and 5 other corporates are participating in the project.• Connection between eTradeConnect and PBoC Trade Finance Platform Completed Phase 1 of PoC and initiated a pilot run. By the end of January 2021, 7 banks in both places have used the connection to execute cross-border trade finance transactions. Total trade value exceeded HK$26 million. Conducting Phase 2 of PoC, which covers more types of trade activities and financing products to provide a holistic solution for SME financing services. In the long run, the HKMA hopes to leverage the result of the PoC and contribute to the development of a set of globally-accepted standards for connecting different trade finance platforms by working with international stakeholders including the BISIH.
STORED VALUE FACILITIES (SVFs) AND
RETAIL PAYMENT SYSTEMS (RPSs)
• SVF usage continued to grow in Q3 2020:
Accounts in use: 63.97 million (+2.3% year-on-year (yoy))
Average daily transaction value: HK$612 million (+9.9%
yoy)
Licensees continue to extend their business reach
• SVF Security 2.0:
Enhancements in SVF account structure and account
opening process
Announced on 18 September 2020, and will be
implemented with effect from 2 July 2021
• Continue to supervise licensees in a risk-based manner,
taking targeted supervisory actions where necessary
• Continue to oversee six designated RPSs 69REGULATORY DEVELOPMENT OF
THE OVER-THE-COUNTER (OTC)
DERIVATIVES MARKET
• The HKMA and Securities and Futures Commission (SFC)
jointly published the consultation conclusion paper on the
Financial Services Providers (FSP) list for clearing
obligation in June 2020. The revised FSP list was gazetted
and became effective on 1 January 2021
• As of November 2020, the Hong Kong Trade Repository
logged a total of 2.87 million outstanding OTC derivatives
trades, covering five asset classes under mandatory
reporting requirements, i.e. foreign exchange, interest rate,
equity, credit, and commodity derivatives
70
• Under the Hong Kong OTC Derivatives Clearing Rules (Clearing Rules), AIs and licensed
corporations (LCs) are subject to the clearing obligation of specified OTC derivative
transactions. In order to capture transactions between AIs/LCs and major dealers
outside Hong Kong that are not AIs or LCs, the concept of FSP was introduced. Under
the Clearing Rules, an entity will be designated as a FSP if the entity belongs to a firm on
the Financial Stability Board’s list of global systemically important banks or on the OTC
Derivatives Supervisors Group’s list of major dealers, and the entity is a clearing member
of major central counterparties. Specific transactions between a FSP and AIs/LCs are
subject to the clearing obligations. The HKMA and SFC perform annual review and
public consultation of the FSP list to ensure the list remains relevant and appropriate.INTEREST RATE BENCHMARKS
The Treasury Markets Association (TMA) has adopted Hong
Kong Dollar Overnight Index Average (HONIA) as the
alternative reference rate for HIBOR. The HKMA and TMA
continue to promote the use of HONIA
On LIBOR transition, the HKMA has, in consultation with the
TMA, developed and announced the following guidelines
applicable to AIs:
From 1 January 2021, AIs should be in a position to offer
products referencing the alternative reference rates to
LIBOR;
From 1 January 2021, adequate fall-back provisions should
be included in all newly issued LIBOR-linked contracts that
will mature after 2021; and
From 30 June 2021, AIs should cease to issue new LIBOR-
linked products that will mature after 2021 71HONG KONG AS AN
INTERNATIONAL
FINANCIAL CENTRE
72RMB TRADE SETTLEMENT AND PAYMENT
RMB trade settlement Average daily turnover of Hong Kong
handled by banks in Hong Kong RMB RTGS System
RMB bn RMB bn
RMB trade settlement (Jan - Nov) RMB bn RMB bn
6,000 6,000 1,400 1,400
Full year Cross-border transactions between
5,376.3 Hong Kong and the Mainland
Offshore market transactions
5,000 5,000 1,200 1,200
Full year
Full year 4,206.2 1,000 1,000
4,000 3,913.9 4,000
800 800
3,000 3,000
5,788.3
600 600
4,835.2
2,000 3,821.3 2,000
3,485.9 400 400
1,000 1,000 200 200
0 0
0 0 2017 2018 2019 2020
2017 2018 2019 2020 Jan - Nov
73
• In the first eleven months of 2020, renminbi trade settlement handled by banks in Hong
Kong totalled RMB5,788.3 billion.
• In the first eleven months of 2020, the average daily turnover of Hong Kong RMB Real
Time Gross Settlement (RTGS) system stood at RMB1,198.7 billion.RMB LIQUIDITY POOL
AND FINANCING ACTIVITIES
RMB customer deposits and RMB financing activities
RMB certificates of deposit (CDs)
(at period end) (at period end)
RMB bn RMB bn RMB bn RMB bn
800 800 500 500
Outstanding RMB CDs issued
Outstanding PBoC Bills
RMB customer deposits Outstanding RMB bonds
700 700
Total Outstanding RMB loans
400 400
600 600 75.0
80.0
500 500
300 300
20.0
400 400 212.4 181.5
168.6
200 200
300 300 170.6
200 200
100 100
153.7 164.5
100 100 144.5
105.6
0 0 0 0
2017 2018 2019 2020 Nov 2017 2018 2019 Nov 2020
74
• As at end-November 2020, renminbi customer deposits and outstanding renminbi CDs
amounted to RMB718.3 billion and RMB38.3 billion respectively, totalling RMB756.6
billion.
• As at end-November 2020, outstanding renminbi loans amounted to RMB164.5 billion.
Outstanding dim sum bonds amounted to RMB181.5 billion. The dim sum bond
issuance totalled RMB59.3 billion for the first eleven months of 2020. In November 2018,
the PBoC started to issue bills in Hong Kong, which aims to enrich the spectrum of high
quality renminbi financial products in Hong Kong and to help build the benchmark yield
curve of renminbi bonds in Hong Kong. As at end-November 2020, outstanding PBoC
bills amounted to RMB75 billion.BOND CONNECT TURNOVER
AND PARTICIPATING INSTITUTIONS
Number of Registered
Average Daily Turnover Institutional Investors
No. of (at period end)
Institutional
RMB bn Investors
25
2,500
2,352
20 19.3
2,000
1,601
15
1,500
10.6
10
1,000
5 503
3.6 500
2.2
247
0
2017 2018 2019 2020 0
H2 2017 2018 2019 2020
75
• In 2020, Bond Connect recorded 235 trades daily on average. The daily turnover
averaged RMB19.3 billion, up around 82% from the 2019 average of RMB10.6 billion.
As of end of 2020, Bond Connect onboarded 2,352 registered institutional investors.MAINTAINING RMB BUSINESS LINKS WITH
OTHER JURISDICTIONS
Nov 2020 2019 2018
1 No. of participating banks on Hong Kong's 206 204 200
RMB clearing platform
Of which:
Branches and subsidiaries of overseas banks 172 173 173
and overseas presence of Mainland banks
2 Amount due to overseas banks 112.0 76.3 80.4
(RMB billion)
3 Amount due from overseas banks 109.4 95.4 132.8
(RMB billion)
76DEVELOPING HONG KONG’S
PRIVATE EQUITY (PE) PLATFORM
Hong Kong has a robust PE industry: the total capital under
management by PE funds in Hong Kong reached
US$160 billion at end-2019*
A new limited partnership regime for PE funds came into
operation on 31 August 2020. Around 80 funds had been
registered under the new regime by mid-January 2021. The
HKMA is working with the Government to develop a
legislative proposal to enable foreign funds to re-domicile to
Hong Kong
• Regarding the tax concession for PE carried interest, the
HKMA has been working with the Government to develop a
legislative proposal. The relevant bill will be introduced into
the Legislative Council in February 2021
* Source: Asian Venture Capital Journal 77PROMOTING GREEN FINANCE
• In December 2020, the Green and Sustainable
Finance Cross Agency Steering Group, co-chaired
by the HKMA and the Securities and Futures
Commission, launched its green and sustainable
finance strategy for Hong Kong and five key action
points to promote green and sustainable finance in
Hong Kong
• The HKMA is conducting preparatory work to assist
the Government in issuing green bonds equivalent to
HK$66 billion in the coming five years under the
Government Green Bond Programme
78
• The Cross-Agency Steering Group aims to coordinate the management of climate and
environmental risks to the financial sector, accelerate the growth of green and sustainable
finance in Hong Kong and support the Government’s climate strategies. Other members
include the Environment Bureau, the Financial Services and the Treasury Bureau, the
Hong Kong Exchanges and Clearing Limited, the Insurance Authority and the Mandatory
Provident Fund Schemes Authority. The Steering Group launched its Strategic Plan that
sets out six key focus areas (risk management, disclosure, capacity building, financial
innovation, mainland opportunities, and collaboration) for strengthening Hong Kong’s
financial ecosystem to support a greener and more sustainable future in the longer term,
and announced five nearer-term actions to address the most pressing issues:
1. Mandate Climate-related disclosures aligned with the Task Force on Climate-related
Financial Disclosures recommendations across relevant financial sectors no later than
2025;
2. Aim to adopt the Common Ground Taxonomy jointly developed by Mainland China and
European Union;
3. Support the International Financial Reporting Standards (IFRS) Foundation’s proposal
to establish a new Sustainability Standards Board for developing and maintaining a
global, uniform set of sustainability reporting standards;
4. Promote climate-focused scenario analysis; and
5. Establish a platform to act as a focal point for cross-sectoral capacity building, thought
leadership and development of repository for green and sustainable finance resources.PROMOTING GREEN FINANCE
• International Finance Corporation (IFC), a member of the World
Bank Group, signed the Alliance for Green Commercial Banks
(Alliance) partnership with HKMA in November 2020. This new
partnership aims to help develop green commercial banks and
encourage more green investment by banks in order to address
climate change
• As the founding member and first regional anchor for the Asia
Chapter of the Alliance, the HKMA will serve as the hub for green
finance among commercial banks in Asia
• Over the next five years, the HKMA and IFC will jointly launch
targeted initiatives in the region to undertake green finance
research, provide unique market insight, tailor capacity
building/training support, and provide practical guidance for banks.
These campaigns will help the banks develop their own roadmap to
mainstream green finance as their core business and enhance
existing green financial products and services
79
• The Alliance is a new initiative launched by IFC.
• The Alliance encourages commercial banks in Asia to adopt strategies and targets to
become greener. The signing of the agreement makes the HKMA the first partner to
work with IFC on the initiative.
• Under the agreement, over the next five years, the HKMA and IFC will bring together
financial institutions, banking industry associations, research institutions, and innovative
technology providers across Asia to develop, build, and boost the capacity for green
finance and promote climate-related investments.INVESTMENT ENVIRONMENT
AND PERFORMANCE OF
THE EXCHANGE FUND
80INVESTMENT ENVIRONMENT IN 2020
• Interest rates: Yields of major developed countries
remained persistently low after a significant decline in the
first quarter as demand for risk aversion rose sharply. US
government bonds fell by about 100 basis points and
reached record low during the year
• Equity markets: Equity markets fell sharply in the first
quarter of 2020 after the global outbreak of COVID-19
pandemic. Super easy monetary policies drove the swift
rebound of global equities. The S&P 500 reached record
high at the end of the year
• Exchange rates: Major currencies appreciated against the
US dollar, with the US dollar weakening particularly during
the second half of the year due to low US interest rates and
economic downturn
81MAJOR DEVELOPED MARKETS 10-YEAR
GOVERNMENT BOND YIELDS REMAINED LOW
82EQUITY MARKETS REBOUNDED SHARPLY
AND HOVERED AT HIGH LEVELS
83MAJOR CURRENCIES
APPRECIATED AGAINST USD
84INVESTMENT INCOME
I 2020 I 2019 2018
(unaudited)
Full Full Full
(HK$ billion) year 2H 1H year year
Bonds 92.5 17.8 74.7 114.5 57.4
Hong Kong equities* 4.0 23.6 (19.6) 22.1 (20.7)
Other equities 69.0 84.4 (15.4) 100.7 (38.7)
Foreign exchange# 9.6 34.0 (24.4) (13.0) (9.0)
Other investments@ 22.7 28.4 (5.7) 37.9 21.9
Investment
income/(loss) 197.8 188.2 9.6 262.2 10.9
* Excluding valuation changes of the Strategic Portfolio.
# This is primarily the effect of translating foreign currency assets into Hong Kong dollar after deducting the portion for
currency hedging.
@ Including valuation changes of private equity and real estate investments held under the Long-Term Growth Portfolio.
This figure represents valuation changes up to the end of September 2020. Valuations of these investments from
October to December are not yet available.
85INCOME AND EXPENDITURE
I 2020 I 2019 2018
(unaudited)
(HK$ billion) Full year H2 H1 Full year Full year
Investment income/(loss) 197.8 188.2 9.6 262.2 10.9
Other income 0.2 0.1 0.1 0.2 0.2
Interest and other expenses (14.5) (4.3) (10.2) (24.8) (17.9)
Net income/(loss) 183.5 184.0 (0.5) 237.6 (6.8)
Fee payment to Fiscal Reserves*# (32.6) (14.0) (18.6) (53.8) (60.2)
Fee payment to HKSAR
government funds and statutory
bodies* (11.5) (5.7) (5.8) (9.0) (13.8)
* The rate of fee payment is 3.7% for 2020, 2.9% for 2019 and 4.6% for 2018.
# This does not include the 2020 fee payment to the Future Fund because such amount will only be
disclosed when the composite rate for 2020 is available.
(The composite rate was 8.7% for 2019 and 6.1% for 2018. Fee payable to the Future Fund was
HK$24.4 billion for 2019 and HK$16.4 billion for 2018.)
86EXCHANGE FUND ABRIDGED BALANCE SHEET
(HK$ billion) At 31 Dec 2020 At 31 Dec 2019 Change
ASSETS (unaudited)
Deposits 266.3 305.9 (39.6)
Debt securities 3,239.1 2,856.6 382.5
Hong Kong equities* 206.9 194.8 12.1
Other equities 534.8 534.9 (0.1)
Other assets# 253.7 314.5 (60.8)
Total assets 4,500.8 4,206.7 294.1
LIABILITIES AND EQUITY
Certificates of Indebtedness 556.2 516.1 40.1
Government-issued currency notes & coins in circulation 12.8 13.0 (0.2)
Balance of the banking system 457.5 67.7 389.8
Exchange Fund Bills and Notes issued 1,068.9 1,152.3 (83.4)
Placements by banks and other financial institutions 87.6 35.0 52.6
Placements by Fiscal Reserves@ 881.8 1,137.5 (255.7)
Placements by HKSAR government funds and statutory bodies 342.5 328.4 14.1
Placements by subsidiaries 15.5 12.6 2.9
Other liabilities 224.9 194.7 30.2
Total liabilities 3,647.7 3,457.3 190.4
Accumulated surplus 852.4 748.7 103.7
Revaluation reserve 0.7 0.7 -
Total equity 853.1 749.4 103.7
Total liabilities and equity 4,500.8 4,206.7 294.1
* Including shares of the Hong Kong Exchanges and Clearing Limited in the Strategic Portfolio.
# Including fund injection to Exchange Fund’s investment holding subsidiaries at a carrying amount of HK$193.2 billion at
31 December 2020 (HK$177.3 billion at 31 December 2019).
@ Including placements by the Future Fund of HK$205.0 billion (HK$224.5 billion at 31 December 2019).
87HISTORICAL INVESTMENT INCOME
(HK$ billion)
Year Full Year Q4 Q3 Q2 Q1
2001 7.4 13.6 10.4 (2.0) (14.6)
2002 47.0 26.3 (2.1) 26.5 (3.7)
2003 89.7 33.5 8.4 41.1 6.7
2004 56.7 33.0 14.1 (7.2) 16.8
2005 37.8 7.3 19.0 13.6 (2.1)
2006 103.8 36.0 37.1 12.5 18.2
2007* 142.2 33.4 61.8 26.3 20.7
2008* (75.0) 8.3 (48.3) (20.4) (14.6)
2009*# 107.7 10.6 71.9 58.7 (33.5)
2010*# 79.4 5.9 74.5 (12.1) 11.1
2011*# 27.1 22.1 (41.4) 21.6 24.8
2012*# 111.6 30.3 42.4 (5.6) 44.5
2013*# 81.2 30.7 54.7 (23.3) 19.1
2014*# 44.7 6.1 (17.8) 43.3 13.1
2015*# (15.8) 21.0 (63.8) 18.7 8.3
2016*# 68.1 (23.3) 47.1 18.9 25.4
2017*# 264.0 66.0 61.8 71.3 64.9
2018*# 10.9 (33.6) 9.5 - 35.0
2019*# 262.2 60.3 23.5 45.0 133.4
2020*# (unaudited) 197.8 107.0 81.2 121.6 (112.0)
* Excluding valuation changes of the Strategic Portfolio
# Including valuation changes of private equity and real estate investments held under the LTGP
88INVESTMENT RETURN
OF THE EXCHANGE FUND (1994-2020)1
16%
12.1% 11.8%
12%
10.8% 10.8%
10.2% 9.5%
7.4%
8%
6.1% 6.6%
5.7% 5.9%
5.1% 5.1%
4.8% 4.8%
4.4% 4.4%
3.1%
3.6%
4%
2.4% 2.7%
2.0% 2.0%
1.1% 1.4%
0.7%
0.3%
0%
Investment Return (1994-2020)2
2020 (unaudited)2
Compounded Annual Hong Kong
1994
1995
1996
1997
1998
1999
2000
2001
2002
2003
2004
2005
2006
2007
2008
2009
2010
2011
2012
2013
2014
2015
2016
2017
2018
2019
Composite CPI (1994-2020)3
Compounded Annual
-0.6%
-4%
-5.6%
-8%
1 Investment return calculation excludes the holdings in the Strategic Portfolio.
2 The return includes the performance of LTGP up to the end of September 2020. The audited full year
return will be disclosed in the annual report of 2020 to be released later this year.
3 Composite CPI is calculated based on the 2014/2015-based series.
89HONG KONG
MORTGAGE CORPORATION
90SME FINANCING GUARANTEE SCHEME
• Special 100% Loan Guarantee:
As of 15 January 2021, over 26,200 applications were
approved, amounting to about HK$41 billion. Among
these applications, almost 9,000 benefited from the
enhanced scheme, totalling about HK$13 billion
During the period, around 16,400 applications have
chosen the principal moratorium option
• 80% and 90% Guarantee Products:
In 2020, over 4,700 applications were approved, with
total loan amount of about HK$15 billion
Around 1,500 loans have chosen the principal
moratorium option
91MORTGAGE INSURANCE PROGRAMME (MIP)
• Revisions to MIP made with effect from 16 October 2019:
The cap on the value of a property eligible for the MIP has
been raised (applicable to completed residential properties
only)
A first-time homebuyer is still eligible to apply even if he or
she cannot meet the stress test
The maximum debt-to-income ratio for all MIP loans is set at
50%
• As of 15 January 2021, around 38,000 applications under the
new coverage were approved, with over 90% being first-time
homebuyers
• Principal moratorium or extension of repayment schedules
available to borrowers to help reduce their repayment burden
92FIXED-RATE MORTGAGE PILOT SCHEME
• The application period of the Fixed-rate Mortgage Pilot
Scheme has been extended to 30 October 2021
• Fixed mortgage rates for 10, 15 and 20 years have been
lowered to 1.99%, 2.09% and 2.19% per annum respectively
• As the borrowers will be insulated from interest rate
movement under the fixed-rate period which is 10 years or
longer, stress testing against interest rate rise is not
required, but the current requirement on debt-to-income ratio
is still applicable
• Since the launch of the Pilot Scheme, applications with loan
amount totalling over HK$100 million have been received
93REVERSE MORTGAGE PROGRAMME (RMP)
• As of 15 January 2021, 4,450 RMP applications were
received:
Average age of borrowers: 68 years old
Average monthly payout: HK$16,200
Payment terms: 10-year (23.7%);
15-year (15.2%); 20-year (12.5%); life (48.6%)
Average property value: HK$5.6 million
Average property age: 30 years
94HKMC ANNUITY PLAN
• Received a total premium amount of around HK$2.5 billion
in 2020, an increase of 56% over 2019
• The average premium amount also rose by 31% to
HK$970,000
• Detailed business results:
2019 FY 2020 FY
No. of policies issued 2,188 2,606
Total premium amount HK$1.6 bn HK$2.5 bn
Average premium amount HK$750,000 HK$970,000
95You can also read