Built cultural heritage in times of climate change - Fraunhofer ...

Page created by Chester Hansen
 
CONTINUE READING
Built cultural heritage in times of climate change - Fraunhofer ...
Climate
Modelling

Building
Simulation

Mitigation and
Adaptation Strategies

Impact
Assessment

Stakeholder
Experiences

Climate for
Culture Products

   Built cultural heritage in times of climate change
Built cultural heritage in times of climate change - Fraunhofer ...
Editorial

                                                                            Brussels/Holzkirchen, October 2014

            Climate for Culture was the first large-scale European-funded research project in the field of
            preservation of cultural heritage. The findings from five years of multidisciplinary research
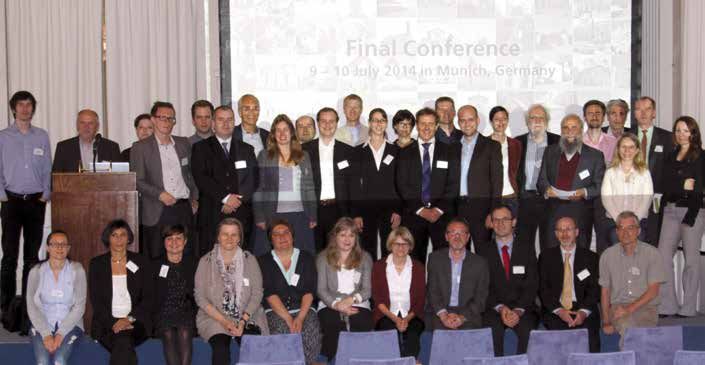
            on the impact of climate change on historic buildings were presented in 28 lectures at an
            international conference which took place 9 -10 July 2014 in the Munich “Residenz”. At this final
            meeting of the project around 160 experts (scientists, conservators, curators, administrators,
            journalists and politicians) from Europe, the United States, Egypt, Iran and Taiwan discussed
            with the Climate for Culture team the newly developed Climate for Culture methodology and
            its transfer into practice.
            In the closing speeches at the evening ceremony in the “Kaisersaal”, Director Dr Kurt
            Vandenberghe from the Directorate General Research and Innovation of the European
            Commission emphasized the responsibility of the European Union and its citizens to protect
            and sustain our cultural heritage and how important the role of research and innovation is in
            achieving these goals. He expressed his thanks to the multidisciplinary Climate for Culture
            team for the substantial contributions they had made. Dr Angelika Niebler, member of the
            European Parliament, recalled the support of the Parliament for the inclusion of cultural her-
            itage research in the European research framework programme Horizon2020. In particular,
            she explained that the members of the Parliament are very pleased to be regularly informed
            about the progress in research on the preservation of cultural heritage in Europe. Dr Niebler
            explained that the Climate for Culture project had been exemplary in this respect.
            In addition to the articles in this brochure, more information can be found at www.climateforculture.eu

            Johanna Leissner                                   Ralf Kilian
            Coordinator                                        Scientific Coordinator
            Fraunhofer Gesellschaft                            Fraunhofer Institute for Building Physics IBP

                                                                                                                 1
Built cultural heritage in times of climate change - Fraunhofer ...
Introduction
                                                                                                                                                       in historic buildings and its impact on cultural heritage items in   Those case study building models were used to produce the
EU project "Climate for Culture"                                                                                                                       Europe and Egypt. In addition, predictions for sea level rise up
                                                                                                                                                       to 2100 produced from the climate models identifies the sites
                                                                                                                                                                                                                            first results, derive suggestions for software development and
                                                                                                                                                                                                                            improvement as well as to apply different active and passive
Damage risk assessment, economic impact and mitigation strategies for                                                                                  most at risk in Europe. By coupling of climate modelling with        measures in the model.
                                                                                                                                                       building simulation future indoor climates and energy demands
sustainable preservation of cultural heritage in times of climate change                                                                               can be calculated and thus suitable mitigation strategies devel-     The development of the building simulation tool is also based
                                                                                                                                                       oped and tested. Valuable collections in historic buildings from     on real data from historic buildings collected as case studies.
Grant agreement No. 226973 (2009-2014)                                                                                                                 different climate zones have been included in in situ investiga-     For this purpose a survey with a specially designed question-
                                                                                                                                                       tions of current and past problems and in making projections         naire was performed to set up a range of case studies from all
Johanna Leissner, Ralf Kilian, Urban Kaiser, Uta Pollmer, Constanze Fuhrmann, Gabriele Maas-Diegeler, Sabrina Rota , Lola Kotova, Daniela Jacob,
                                                                                                                                                       of future issues.                                                    over Europe and Egypt. The survey covers up to now over 100
Uwe Mikolajewicz, Melanie Eibl, Vivi Tornari, Eirini Bernikola, Henk Schellen, Jos van Schijndel, Zara Huijbregts, Marco Martens, Florian Antretter,
                                                                                                                                                                                                                            case studies in eleven countries. Parameters like type of build-
Stefan Bichlmair, Mathias Winkler, Sarah Kosmann, Jonathan Ashley-Smith, Kristina Holl, Dario Camuffo, Chiara Bertolin, Susana Mourato,
                                                                                                                                                       For the high resolution climate simulations within the Climate       ing, specific site-related factors, available indoor and outdoor
Eleni Fimereli, Chris Gaskell, Tomáš Vyhlídal, Goran Simeunovic, Jiří Šolc, Mihael Mirtič, Gašper Stegnar, Marjana Šijanec Zavrl, Tor Broström,
                                                                                                                                                       for Culture project two moderate scenarios are investigated,         climate data, observed damage and suitability for other work
Aleš Sládek, Oto Sládek, Vlatka Rajčić, Roko Žarnić, Magdalena Rozanska, Jan Radon, Jan Holmberg, Robert Krah, Jochen Käferhaus, Nigel Blades,
                                                                                                                                                       the A1B scenario and the very recent RCP4.5 scenario of the          packages are reviewed and are transferred into a Climate for
Katy Lithgow, Tina Naumovic, Klaus Häfner, Florence Bertin, Pavel Zítek
                                                                                                                                                       IPCC assessment report 5 (AR5). The mid-line A1B scenario            Culture database which has several categories of information.
                                                                                                                                                       assumes a greater CO2 emission increase until 2050 and a de-         The list of case study buildings will be continuously updated
                                                                                                                                                       crease afterwards. In the recent past the global circulation         and extended further.
                                                                                                                                                       model community launched the climate runs driven by the
                                                                                                                                                       new AR5 IPCC emission scenarios which served for the second          Based on the climate data received from the high-resolution
                                         Overview of Climate for Culture                                                                               phase. RCP 4 .5 stands for Representative Concentration Path-        regional climate model a climate classification map over all of
                                                                                                                                                       way and is a scenario based on long-term, global emissions of        Europe and Northern Africa was produced. The climate map is
                                         Climate Change is one of the most critical global challenges of our time. For many decades nu-                greenhouse gases, short-lived species, and land-use-land-cov-        derived from an overlay of temperature and humidity for the
                                         merous scientists from all over the world have been researching this topic and complex climate                er which stabilizes radiative forcing at 4.5 Watts per square me-    baseline climate 1960-1990 since temperature and humidity
                                         models suitable for making future climate projections have been developed. Climate change in                  ter (W m-2, approximately 650 ppm CO2 equivalent) in the year        changes have a great influence on most degradation processes
                                         itself is not the main concern; more important is its impact on the planet. But there is not so               2100 without ever exceeding that value.                              of materials. The climate zones were established to organize
                                         much information available on how the changing climate will affect mankind and its environ-                                                                                        the collection of crucial data from various historic buildings: For
                                         ment. Although many studies have been conducted to explore the impact of climate change on                    For the development of the whole building simulation tools,          each climate zone, a zone leader was appointed to be responsi-
                                         economy, biodiversity and agriculture or on fresh water availability, only a little is known, to              sets of climate indices were defined. The test datasets were         ble for harmonized data collection.
                                         whether, and how, climate change influences our cultural heritage. Within the European fund-                  prepared for the period of 1950 to 2100. Modelled climate data
                                         ed project Climate for Culture running from 2009 until 2014, a multidisciplinary research team                needed to be verified and processed to be suitable for building      The case study buildings were used for the development of
                                         consisting of 27 partners from the EU and Egypt, has conducted research in order to estimate                  simulation. New methods and modules for the simulation tools         the whole building simulation tool including a generic building
                                         the impact of climate change on the indoor environments of historic buildings in Europe and                   had to be developed, implemented, tested and used. The suc-          model and for assessing the effects of climate change. There-
                                         the Mediterranean region and on the vast collections they contain.                                            cessful application of suitable simulation tools allows compu-       fore, in situ investigations of existing problems have been
                                                                                                                                                       tational testing of active and passive adaptation and preserva-      carried out to be used for the projection of future challenging
                                         For this purpose, the CLIMATE FOR CULTURE project has coupled for the first time ever cli-                    tion strategies. Several building simulation tools were tested       issues using whole building simulation and different situ moni-
                                         mate modelling with whole building simulation tools: The high resolution climate change evo-                  and two - Hambase and WUFI Plus - proved to be suitable to           toring technologies. The in situ measurements have been per-
                                         lution scenarios provide the necessary climate indices for different periods in the past (1961-               model temperature and the change in relative humidity fluc-          formed by laser speckle interferometry which was developed in
                                         1990), near (2021-2050) and far (2071-2100) future. Here the regional climate model REMO                      tuations due to moisture buffering. Software models for some         the previous European project Laseract and by 3D microscopy.
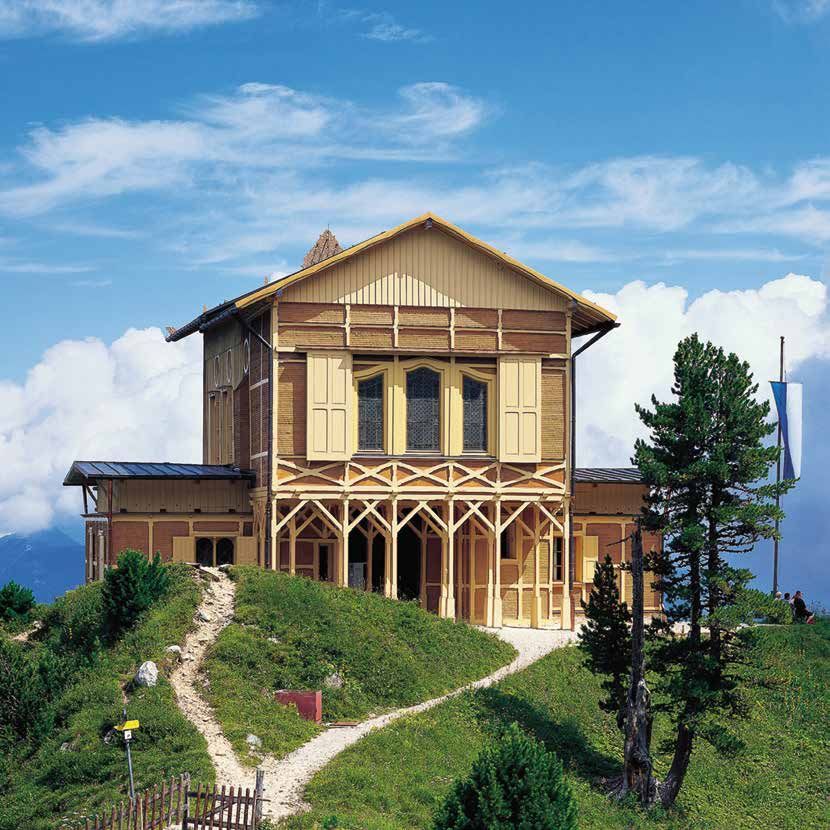
                                         with the high spatial resolution of approx. 10x10 km has been further developed over the whole                case study buildings already exist, for instance in Germany,         The two methods have already been successfully applied at the
                                         of Europe and the Mediterranean. This set of climate indices is used in whole building simula-                Linderhof castle, The Kings House on the Schachen, the church        test site at Fraunhofer Institute for Buildings Physics in Holz-
                                         tion tools to assess future projections of outdoor climate changes on the indoor environments                 of Roggersdorf and in the Netherlands, Amerongen Castle.             kirchen (Germany) and at several case study sites in Croatia and

 2                                                                                                                                                                                                                                                                                           3
Built cultural heritage in times of climate change - Fraunhofer ...
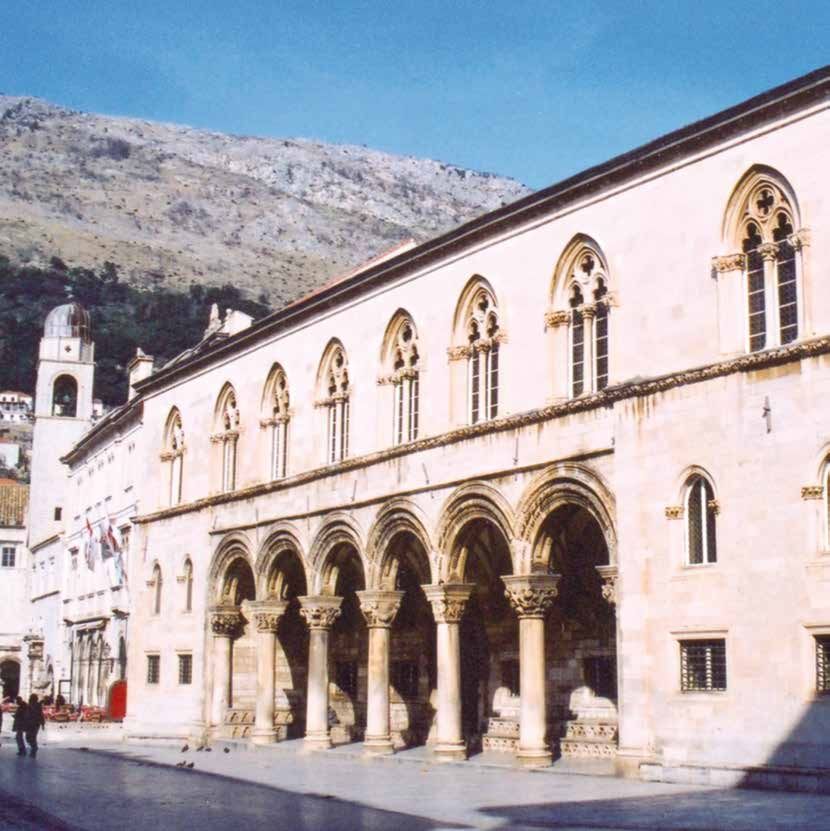
Crete and show good complementarity. Further investigations                                 to adapt buildings to climate change. For the first time, a com-
by glass sensors from the previous European project AMECP                                   prehensive and in-depth analysis of the economic benefits as-
(Assessment and monitoring the environment of cultural prop-                a)              sociated with reducing climate change damage to built heritage
erty) to assess the corrosivity impact of indoor and outdoor                                interiors in Europe was undertaken. This also included a study
conditions at cultural heritage sites throughout Europe have                                of the attitudes, preferences and ethical views held by the gen-
also been carried out at case study sites in Crete and Croatia                              eral public on the need to protect cultural assets from the im-
and Germany. These examinations allow a much more precise                                   pact of climate change. A questionnaire for the visitor surveys
and integrated assessment of the real damage impact of cli-                                 in the United Kingdom, Sweden, Germany, Romania and Italy
mate change on cultural heritage at regional scale. In terms of                  b)         was developed.
climate control in historic buildings a survey of the state of the
art has been finalized and used to develop appropriate mitiga-
tion/adaptation strategies. This means that active and passive                              The Climate for Culture methodology
measures were discussed and defined which resulted in the im-
plementation of humidistat heating and equal sorption control                               From the global climate model
as well as an absolute humidity control algorithm in the whole
building simulation tool WUFI®Plus. In addition different exist-                             to high resolution regional climate simulation (a)
ing and new microclimate control approaches are considered in
the tools Hambase and MATLAB/Simulink .                                          c)          to case study historic buildings (b)

The main innovation in the whole project is the first ever use                               to whole building simulation (c)
of a combination of climate modelling and building simulation               f)
tools to predict in a better way the influence of the changing                               to indoor environments (d)
outdoor climate on the indoor environment in historic build-
ings up to 2100 and to calculate the future energy demand for                                to individual cultural heritage items (e)
environmental control in historic buildings. By using an auto-
mated procedure an assessment of the damage potential in                         d)          to indoor climate maps (f)
various climate zones has been performed. The project focus-
es on gradual climate change and has not taken into account                                  predictions for the far future (g)
extreme events; this was explicitly excluded by the European           g)
Commission`s 2008 call for proposals. Since temperature and
humidity are still recorded with analogue thermo-hygrographs                                Figure 1: The Climate for Culture methodology
in many museums, a software algorithm has been developed
to convert analogue into digitised data. The software DigiChart
can be downloaded for free at the Climate for Culture website.                   e)
The project also examines a broad range of mitigation and ad-
aptation measures: How to control indoor and microclimates
energy efficiently and how revitalisation and enhancement                   g)
of historical climate control (climatisation) systems can lead       2100
to sustainable solutions for historical buildings. The climate
for culture methodology is integrated into a decision support
software which provides building owners information on how                       Figure 1

 4                                                                                                                                                        5
Built cultural heritage in times of climate change - Fraunhofer ...
Chapter 1   Climate modelling                                                                           9

    Chapter 2   Building simulation                                                                         15
                Hygrothermal building simulation to predict indoor climate conditions                       16
                Assessment of a historic church                                                             17
                Simulating and mapping future energy demands                                                20
                Conservation of cultural heritage in the UK                                                 24

    Chapter 3   Mitigation and adaptation strategies                                                        27
                Energy efficient climate control in historic buildings                                      29
                Indoor climate control for historic interiors and decision support                          33
                Revitalisation and enhancement of historic climatisation systems                            37
                Wall heating system (“Temperierung”)                                                        41
                Radiative heating experiments                                                               44

    Chapter 4   Impact assessment                                                                           47
                Damage functions                                                                            49
                Risk assessment                                                                             52
                Experimental investigation of surface monitoring of materials in environmental conditions   55
                The economic benefits of conserving built heritage interiors from climate change damage     60
                in Europe
                Retrospective preservation surveys at Collections                                           64

    Chapter 5   Stakeholder experiences                                                                     65
                Cultural heritage in the times of climate change - the case study buildings                 66
                Stakeholder experiences - putting Climate for Culture in the context of                     67
                the National Trust
                Stakeholder experiences - the results of the Climate for Culture project                    70
                and their significance for future work

    Chapter 6   Climate for Culture products                                                                73
                Climate for Culture database of case studies                                                75
                The Climate for Culture Decision Making Support System                                      79
                “DigiChart” software for digitising of thermo-hygrograph charts                             81

    Conclusions and future perspectives                                                                     84

    Acknowledgement                                                                                         85

    Climate for Culture partners	                                                                           86

    associated partners	                                                                                    92

    Image rights		                                                                                          94

6                                                                                                                7
Built cultural heritage in times of climate change - Fraunhofer ...
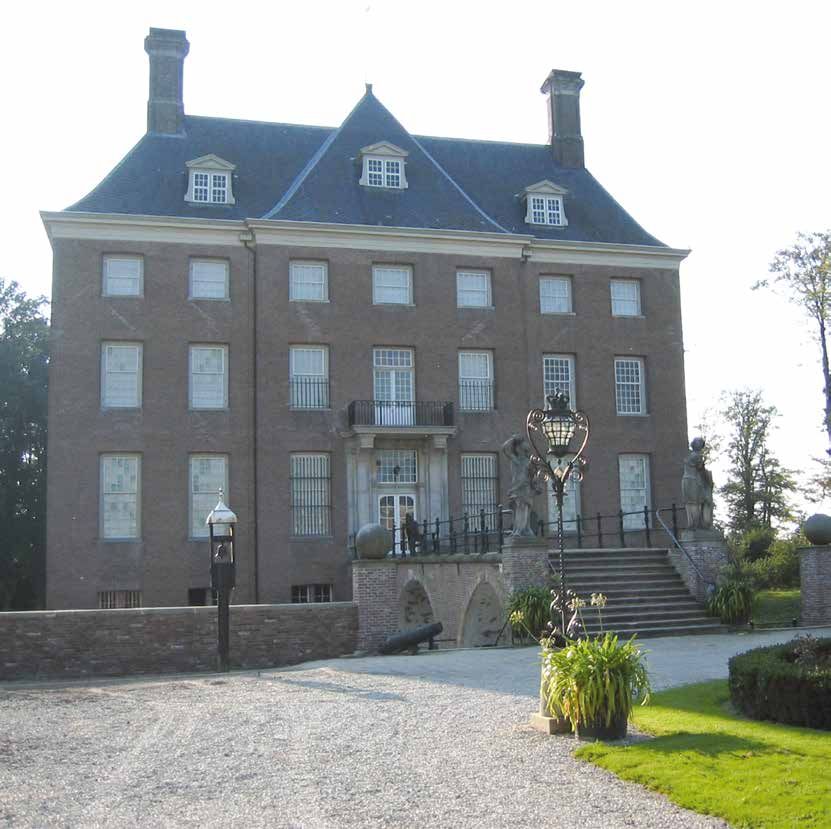
Chapter 1   Climate modelling

8                                   9
Built cultural heritage in times of climate change - Fraunhofer ...
Chapter 1
                                                                                                                                             sites. Several components contribute to SLR. The most impor-         regional climate model REMO, two global circulation models
Climate modelling                                                                                                                            tant ones on a global scale are ocean thermal expansion and          were applied as the driving force. The large-scale atmospheric
                                                                                                                                                                                                                  flow fields to drive REMO at the lateral boundaries were derived
                                                                                                                                             changes in the mass of the water stored on land, especially in
Lola Kotova, Uwe Mikolajewicz and Daniela Jacob                                                                                              ice sheets and glaciers, but also in reservoirs and groundwater.     from the global coupled atmosphere-ocean models ECHAM5-
                                                                                                                                             On a regional scale, this is further modified by changes in ocean    MPIOM [11] and MPI-ESM [12].
                                                                                                                                             circulation and by changes in the atmospheric pressure. Locally,
                                    Climate change is one of the most critical global challenges of our time. Scientific research shows      the movement of the land relative to an equipotential surface        Furthermore, we have investigated the significance of the cli-
                                    that the preservation of the cultural heritage of Europe is particularly vulnerable to these factors.    also matters. Important components are the response of the           mate change pattern. We focused on climate change signals
                                                                                                                                             solid earth to previous changes in load, such as to the decay of     between the three time slices mentioned above. These slices
                                    The research team of the CLIMATE FOR CULTURE project aims to assess the damage potential of              the ice sheets, which were present during the last glacial period    of 30 years are long enough to provide adequate estimates for
                                    climate change on our cultural heritage sites, its socio-economic impact and possible mitigation         20,000 years ago as well as geotectonic movements.                   climate change calculations. On the other hand, a substantial
                                    strategies. For this purpose, climate evolution scenarios are provided in high spatial resolution                                                                             impact of natural variability on the estimated climate signal can
                                    covering all of Europe. These results are further applied as input in building simulation models to      In the project, we applied the regional atmosphere model REMO        be avoided within these time slices. The climate change sig-
                                    identify the most urgent risks for specific regions with the aim of developing mitigation strategies.    developed at the Max Planck Institute of Meteorology in its most     nal is derived from the monthly mean data which is calculated
                                                                                                                                             recent hydrostatic version (REMO 2009) [2,3,4]. It was originally    from 1h values. It expresses a relative change between the at-
                                    The state of knowledge on climate change is provided on a regular basis by the Assessment                developed over Europe using the physical parameterisations of        mosphere time-mean state in near/far future and present. By
                                    Reports of the Intergovernmental Panel on Climate Change (IPCC) [1]. The IPCC defines climate            ECHAM4 [5] and the dynamical core of the former weather pre-         calculating the climate change signal, we applied a two-sided
                                    change as follows: “Climate change refers to a change in the state of the climate that can be            diction model of the German Weather Service (DWD) [6].               student t-test [13]. The climate signal is called statistically sig-
                                    identified [...] by changes in the mean and/or the variability of its properties and that persists for                                                                        nificant if the level of significance reaches 95 % or more.
                                    an extended period, typically decades or longer”. It refers to any change in climate over time,          The large-scale atmospheric flow fields to drive the REMO model
                                    whether due to natural variability or as a result of human activity.                                     at the lateral boundaries were derived from a global coupled         In the project, we used two moderate emission scenarios de-
                                                                                                                                             atmosphere-ocean model. The simulation set-up consists of a          veloped by IPCC. The emission scenarios were based on an
                                    Most of the observed increases in global average temperatures since the mid-20th century are             double nesting procedure. The global model data is used to drive     extensive assessment of driving forces and emissions in the
                                    very likely due to the observed increase in anthropogenic greenhouse gas (GHG) concentrations.           REMO at ~50 km horizontal resolution. The results of this experi-    scenario literature, alternative modelling approaches and an
                                    The time-dependent (of over centuries) climate response to changing concentrations of GHGs               ment are used to drive REMO on a horizontal grid of about 11 km.     “open process” that solicited wide participation and feedback.
                                    can be studied using global Earth System Models (ESMs).                                                  27 levels are applied on the vertical grid.                          They represented different demographic, social, economic,
                                                                                                                                                                                                                  technological and environmental developments, which may
                                    ESMs have been developed as a mathematical representation of the Earth system, which are not             A series of 30-year time-slice experiments was performed: in         be viewed positively by some people and negatively by others.
                                    only coupled atmosphere-ocean general circulation models (GCMs), but also take into account              addition to the scenario simulations for the near (2021 to 2050)
                                    different biogeochemical feedbacks.                                                                      and far future (2071 to 2100) climate with projected GHG concen-     The climate simulation is based on the IPCC AR4 A1B scenario
                                                                                                                                             trations, a control simulation for the recent past (1961 to 1990)    [14] as it provides a good mid-line scenario for carbon dioxide
                                    Despite their success in simulating the Earth’s climate, GCMs only provide information at a              forced with observed GHG concentration was calculated. A 30-         output and economic growth. The A1B scenario is defined as
                                    relative coarse spatial scale, which is not sufficient for regional climate change assessment.           year seasonal climatology was derived for each experiment.           not relying too heavily on one particular energy source, on the
                                    The following two different principles transferring the information from a global model to the                                                                                assumption that similar improvement rates apply to all energy
                                    region of interest have therefore been developed: statistical and dynamical downscaling.                 A lot of effort has been made to provide quality control datasets.   sources and end-use technologies. Representative Concentra-
                                                                                                                                             An assessment of robustness of climate change patterns pro-          tion Pathway (RCP) 4.5 is the scenario of the long-term, global
                                    Statistical downscaling techniques connect the climate change signal provided by a GCM with              jected for Europe has been achieved across different studies, e.g.   emissions of greenhouse gases, short-lived species and land-
                                    observations from measurement stations in the region to achieve higher resolved climate                  Jacob et al. [7,8], Vautard et al. [9], von Storch et al. [10].      use-land-cover which stabilises radiative forcing at 4.5 W/m 2
                                    change signals. Dynamical downscaling uses high resolution three-dimensional regional cli-                                                                                    (approximately 650 ppm CO 2 -equivalents) in the year 2100
                                    mate models (RCM). This is a standard procedure for atmospheric variables. However, sea                  In the project, we refer to different global and regional model      without ever exceeding that value [15]. This scenario has been
                                    level rise (SLR) is also a potential threat to many coastal regions and their cultural heritage          combinations. While dynamical downscaling is done by the             used in the AR5 report.

10                                                                                                                                                                                                                                                                                 11
Built cultural heritage in times of climate change - Fraunhofer ...
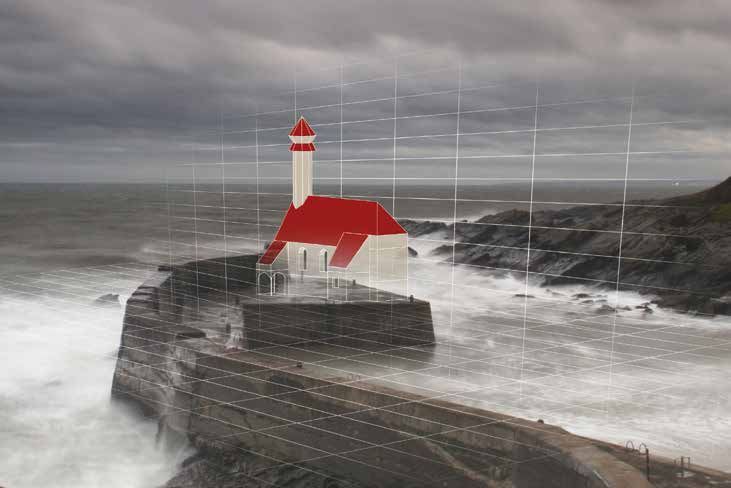
Figure 1 shows projected changes of the annual mean of near-                                                                                                                                                                                                                               The contribution of ice sheet melting, glacier melting and chang-
surface air temperature (TEMP2) for the far future. The tem-                                                                                                                                                                                                                               es of water storage on land is estimated to be approx. 31 cm. The
perature increase is statistically significant, with regional                                                                                                                                                                                                                              spatial pattern resulting from these changes has been calculated
differences for all of Europe for all simulations. While the tem-                                                                                                                                                                                                                          using fixed patterns from Bamber and Riva [19]. Glacial isostatic
perature increases between 1 and 3 °C for RCP4.5, the A1B                            A1 B                                                              RCP4.5                                                                                                                              adjustment, which describes the adjustment of the solid earth
scenarios simulations showed projected future warming of 2                   30 °W    0°    30 °E     60 °E                                    30 °W      0°    30 °E     60 °E              Total relative sea level rise                                                                 to the decay of the ice sheets after the last glacial period, is re-
to 4.5 °C. The projected spatial patterns are very similar in all                                                                                                                                                                                                                  60 °N
                                                                                                                                                                                                                                                                                           sponsible for a slow rising of the land in Scandinavia, Iceland and
scenarios with stronger annual mean warming in Southern Eu-                                                                                                                          60 °N
                                                                                                                                                                                                                                                                                           Scotland. Therefore, the expected sea level rise is relatively small
rope and in northeastern areas.                                      50 °N                                             50°N
                                                                                                                                                                                                                                                                                           (or even negative) in these regions (see Fig. 3). The coastal SLR is
                                                                                                                                                                                                                                                                                   55 °N   strongest in the southeastern part of the North Sea.
                                                                                                                                                                                     55 °N
Figure 1: Projected changes of annual mean of near-surface
                                                                     40 °N                                             40°N
air temperature [K] for the period of 2071-2100 compared to                                                                                                                                                                                                                        50 °N
                                                                                                                                                                                                                                                                                           Figure 3: Regional distribution of total relative sea level rise esti-
1961-1990 for different emission scenarios A1B (left panel) and                                                                                                                      50 °N                                                                                                 mated for years 2070-2099 of scenario A1B relative to 1961-1990.
RCP4.5 (right panel)                                                 30 °N                                             30°N
                                                                                                                                                                                                                                                                                           The estimate includes ocean thermal expansion, changes in the
                                                                                                                                                                                                                                                                                   45 °N   mass of ice sheets and glaciers, global mean changes of the water
                                                                     20 °N                                             20°N                                                          45 °N
Whereas TEMP2 is rising, the REMO model does not simulate                                                                                                                                                                                                                                  stored in groundwater and reservoirs, changes in ocean circula-
a clear signal in precipitation (TPREC) for all of Europe. The re-                                                                                                                                                                                                                 40 °N
                                                                                                                                                                                                                                                                                           tion and atmospheric load and glacial isostatic adjustment. Other
                                                                                      -3.6 -3 -2.4 -1.8 -1.2 -0.6 0 0.6 1.2 1.8 2.4 3    3.6
sults presented in Figure 2 show that the general tendency is                                Near-surface air temperature, [K]
                                                                                                                                                                                     40 °N
                                                                                                                                                                                                                                                                                           effects like tectonics are not included. The estimate of the global
enhanced precipitation for most regions in central and north-                                                                                                           Figure 1                                                                                                           mean sea level rise for this period is 49 cm.
ern Europe and decreased precipitation in the Mediterranean                                                                                                                          35 °N
                                                                                                                                                                                                                                                                                   35 °N

region (up to 40 % over the Iberian Peninsula for A1B).                              A1 B                                                              RCP4.5
                                                                             30 °W    0°    30 °E     60 °E                                    30 °W      0°    30 °E     60 °E
                                                                                                                                                                                                                                                                                   30 °N   References
                                                                                                                                                                                     30 °N
Figure 2: Relative annual mean differences of total precipitation
in % for 2071-2100 compared to 1961-1990 for different emis-                                                                                                                                                                                                                               1.   IPCC. www.ipcc.ch
sion scenarios A1B (left panel) and RCP4.5 (right panel). Hatched    50 °N                                             50°N
                                                                                                                                                                                             5 °W          0°          5 °E      10 °E       15 °E     20 °E       25 °E   30 °E
                                                                                                                                                                                                                                                                                           2.   Jacob, D.; Podzun, R. Sensitivity studies with the regional climate
areas indicate regions with statistically significant changes.                                                                                                                                      -0.2    -0   0.2      0.3   0.35   0.4   0.45    0.5   0.55   0,6
                                                                                                                                                                                                                                                                                                model REMO. Meteorol. Atmos. Phys. 1997, 63, 119-129
                                                                                                                                                                                                                                                                                           3.   Jacob, D. A note to the simulation of the annual and inter-annual vari-
                                                                     40 °N                                             40°N
The change in mean relative sea level was calculated using the                                                                                                                                                                                                                                  ability of the water budget over the Baltic Sea drainage basin. Mete-
                                                                                                                                                                                                    -0.2    -0   0.2      0.3   0.35   0.4   0.45    0.5   0.55   0.6
data from the regionally coupled atmosphere-ocean model                                                                                                                                                                                                                                         orol. Atmos. Phys. 2001, 77, 61-73
REMO/MPIOM [17]. The model was forced with data from the             30 °N                                             30°N                                                                                A1B scenario, 2070-2099 relative to 1961-1990                                   4.   Teichmann, C. et al. How does a regional climate model modify the
scenario simulation with the global climate model ECHAM5/                                                                                                                                                                                                                      Figure 3         projected climate change signal of the driving GCM: A case study over
                                                                     20 °N                                             20°N
MPIOM [18]. From this simulation, the contributions due to glo-                                                                                                  Copyright © CS2.0
                                                                                                                                                                                                                                                                                                different CORDEX regions using REMO. Atmosphere 2013, 4(2), 214-
bal ocean thermal expansion, changes in ocean circulation and                                                                                                                                                                                                                                   236; doi:10.3390/atmos4020214
                                                                                       -50 -30 -20 -10 -5     0    5    10    20 30 50
atmospheric load have been calculated. The change in climato-                                        Total precipitation [%]                                                                                                                                                               5.   Roeckner, E.; Arpe, K.; Bengtsson, L.; Christoph, M.; Claussen, M.;
logical sea level for the period 2070 to 2099 relative to the near                                                                                                      Figure 2                                                                                                                Dümenil, L.; Esch, M.; Giorgetta, M.; Schlese, U.; Schulzweida, U. The
past (1961 to 1990) was calculated. The global mean contribu-                                                                                                                                                                                                                                   atmospheric general circulation model ECHAM-4: Model description
tion due to ocean thermal expansion for this period is 18 cm.                                                                                                                                                                                                                                   and simulation of the present day climate; Report No. 218; Max Planck
                                                                                                                                                                                                                                                                                                Institute for Meteorology: Hamburg, Germany, 1996
                                                                                                                                                                                                                                                                                           6.   Majewski, D. The Europa-Modell of the Deutscher Wetterdienst. In
                                                                                                                                                                                                                                                                                                Proceedings of the ECMWF Seminar on Numerical Methodsin Atmos-
                                                                                                                                                                                                                                                                                                pheric Models, Reading, UK, 9-13 September 1991; pp. 147-191

12                                                                                                                                                                                                                                                                                                                                                                  13
Built cultural heritage in times of climate change - Fraunhofer ...
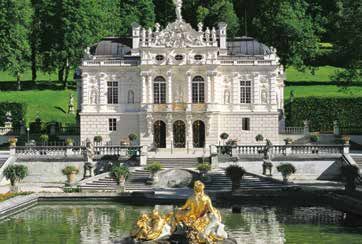
7.  Jacob, D. et al. 2013. EURO-CORDEX: new high-resolution climate              16. Church, J. A.; Clark, P. U.; Cazenave, A.; Gregory, J. M.; Jevrejeva, S.;
    change projections for European impact research. Reg Environ                     Levermann, A.; Merrifield, M. A.; Milne, G. A.; Nerem, R. S.; Nunn, P.
    Change; DOI 10.1007/s10113-013-0499-2                                            D.; Payne, A. J.; Pfeffer, W. T.; Stammer, D. and Unnikrishnan, A. S;
8. Jacob, D. et al. Assessing the Transferability of the Regional Climate            2013: Sea Level Change. In: Climate Change 2013: The Physical Sci-
    Model REMO to Different COordinated Regional Climate Downscal-                   ence Basis. Contribution of Working Group I to the Fifth Assessment
    ing EXperiment (CORDEX) Regions. Atmosphere 2012, 3, 181-199;                    Report of the Intergovernmental Panel on Climate Change [Stocker, T.
    doi:10.3390/atmos3010181                                                         F.; Qin, D.; Plattner, G.-K.; Tignor, M.; Allen, S. K.; Boschung, J.; Nau-
9. Robert Vautard et al. 2014. Environ. Res. Lett. 9 034006                          els, A.; Xia, Y.; Bex, V. and Midgley, P.M.(eds.)]. Cambridge University
    doi:10.1088/1748-9326/9/3/034006
10. von Storch, H.; Zorita, E.; Cubasch, U., 1993. Downscaling of Global
                                                                                     Press, Cambridge, United Kingdom and New York, NY, USA
                                                                                 17. Sein, D. V.; Mikolajewicz, U.; Gröger, M.; Fast, I.; Cabos, W.; Pinto, J.G.;   Chapter 2   Building simulation
    Climate Change Estimates to Regional Scales: An Application to Ibe-              6,7; Hagemann, S.; Semmler, T. and Jacob, D. (2015). Regionally cou-
    rian Rainfall in Wintertime. J. Climate, 6, 1161-1171. Jungclaus, J. H.;         pled atmosphere – ocean – sea ice – marine biogeochemistry model
    Botzet, M.; Haak, H.; Keenlyside, N.; Luo, J.-J.; Latif, M.; Marotzke, J.;       ROM. Part I: Description and validation., under revision at Journal of
    Mikolajewicz, U. and Roeckner, E. (2006). Ocean circulation and trop-            Advances in Modeling Earth Systems
    ical variability in the coupled model ECHAM5/MPI-OM. Journal of              18. Jungclaus, J. H.; Botzet, M.; Haak, H.; Keenlyside, N.; Luo, J.-J.; La-
    Climate 19 (16): 3952-3972                                                       tif, M.; Marotzke, J.; Mikolajewicz, U. and Roeckner, E (2006). Ocean
11. Roeckner, E.; Bäuml, G.; Bonaventura, L.; Brokopf, R.; Esch, M.; Gior-           Circulation and tropical variability in the coupled model ECHAM5/
    getta, M.; Hagemann, S.; Kirchner, I.; Kornblueh, L.; Manzini, E.; Rho-          MPIOM. Journal of Climate 19 (16): 3952-397; Special Session: Climate
    din, A.; Schlese, U.; Schulzweida, U.; Tompkins, A. (2003): The atmos-           Models at the Max-Planck Institute for Meteorology (MPI-M). Jour-
    pheric general circulation model ECHAM 5. PART I: Model description.             nal of Climate. Volume 19, Issue 16 (August 2006). doi: http://dx.doi.
    MPI-Report No. 349                                                               org/10.1175/JCLI9023.1
12. JAMES Special Issue: The Max Planck Institute for Meteorology Earth          19. Bamber, J. and Riva, R., The sea level fingerprint of recent ice mass
    System Model. 2013                                                               fluxes (2010). The Cryosphere, 4, pp. 621-627, 2010 www.the-cryo-
13. Hans von Storch and Francis Zwiers. 2013. Testing ensembles of cli-                sphere.net/4/621/2010/doi:10.5194/tc-4-621-2010
    mate change scenarios for “statistical significance”. Climatic Change.
    March 2013, Volume 117, Issue 1-2, pp. 1-9
14. Nakićenović, N., et al. Special Report on Emissions Scenarios: A Spe-
    cial Report of Working Group III of the Intergovernmental Panel on
    Climate Change (Cambridge Univ. Press, 2000)
15. van Vuuren, D. P.; Edmonds, J.; Kainuma, M.; Riahi, K.; Thomson, A.;
    Hibbard, K.; Hurtt G. C.; Kram, T.; Krey, V.; Lamarque J.-F.; Matsui, T.;
    Meinshausen, M.; Nakicenovic, N.; Smith, S. J.; Rose, S. K. (2011) Rep-
    resentative concentration pathways: an overview. Climatic Change
    109: 5-31: doi:10.1007/s10584-011-0148-z

 14                                                                                                                                                                                                   15
Built cultural heritage in times of climate change - Fraunhofer ...
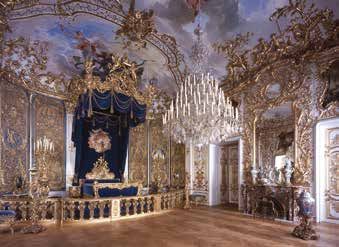
Chapter 2.1                                                                                                             Chapter 2.2
Hygrothermal building simulation to predict indoor climate conditions                                                   Assessment of a historic church
Florian Antretter                                                                                                       Florian Antretter, Matthias Winkler, Jan Radon and Agnieszka Sadlowska

                    Hygrothermal whole building simulation allows for the prediction of indoor temperature and          Introduction                                                            Building simulation
                    relative humidity in historic buildings. This makes climatic processes traceable. Consequences      Historic buildings have to adapt to the challenges accompanying         The advanced hygrothermal building simulation tool WUFI®Plus
                    of measures with regards to risk and energy demand can thus be evaluated in advance. The in-        climate change. With the example of the St. Margaretha church           is used to simulate the church [1]. This software couples whole
                    teraction of room and enclosing building components as well as the building interior are taken      located in Roggersdorf (Germany) it is shown how hygrothermal           building energy modelling with hygrothermal component mod-
                    into account to predict indoor temperature and relative humidity and its fluctuations as a result   building simulation with WUFI®Plus can be used to understand            elling and allows the combined assessment of hygrothermal
                    of outdoor conditions. This requires detailed modelling of heat and moisture exchange and           the performance of a historic building. As soon as a validated          conditions of the building envelope, indoor climate and energy
                    transport on and in components.                                                                     building model is created, it can be used to simulate the present       demand.
                    Only a few software tools are capable of taking moisture diffusion and capillary transport in       and future indoor climate, which can be evaluated and possible
                    building materials into account. In the Climate for Culture project, HAMBase (only diffusion)       risks for the building and its interior can be identified. The impact   The church in Roggersdorf is built in WUFI®Plus as a multi-zonal
                    and WUFI®Plus (diffusion and capillary transport) were used for holistic hygrothermal building      of different mitigation strategies on indoor climate can also be        model, consisting of the sacristy, the main nave, the entrance,
                    simulation. Input data is the building geometry, used materials in the assemblies, building use     evaluated to develop retrofitting strategies for the future.            the attic and the tower. Figure 1 shows a picture of the church
                    and resulting inner loads as well as air exchange due to infiltration and ventilation. Available                                                                            and its WUFI®Plus model. The northwest wall of the building
                    HVAC equipment can be modelled and coupled with various controls to maintain desired set-           Building description                                                    is covered with wooden shingles to protect the building from
                    points. Special control strategies for historic buildings like conservation heating, controlled     The St. Margaretha church in Roggersdorf is located near the            heavy rain. The nave is built out of tuff stone walls with lime
                    ventilation or “Temperierung” wall heating have also recently been implemented in the simula-       Fraunhofer Institute for Building Physics (IBP) in Holzkirchen in       plaster only on the inside surface. The walls of the entrance and
                    tion software. WUFI® Plus provides an easy to use graphical user interface that supports error-     Southern Bavaria. The church was erected between 1696 and               the sacristy are on both sides covered with lime plaster. The
                    free input.                                                                                         1709 from tuff stone. It was consecrated in 1709. The tower and         ceiling is insulated with mineral wool. The material data was
                    The results of whole building hygrothermal simulation cover the whole range of hourly energy        sacristy followed in 1764. The building was renovated funda-            taken from the database of WUFI®Plus.
                    demand for building conditioning for each zone, hourly indoor temperature and relative hu-          mentally from 2002 to 2004 . Shortly after the renovation the
                    midity for comfort and damage assessment as well as hygrothermal conditions on and in the           churchwarden again noticed moisture damage on the walls.                Future assessments of the indoor climate focus on the main
                    envelope components to assess hygric issues like mould growth. Whole building hygrothermal          Climate measurements in the St. Margaretha church have been             nave, as boundary conditions for this zone measured cli-
                    simulation is the tool of choice for detailed building assessment. It allows the various building   carried out by Fraunhofer IBP for several years, starting at the        mate data from outdoors and adjacent zones, and the sta-
                    parameters and boundary conditions to change and the resulting changes in damage risk and           beginning of 2005. The indoor climate parameters were first             tistical climate data was used. Since no measurements for
                    energy demand to be assessed.                                                                       measured. Then the measurements were extended to more pa-               the ground climate were available, it was assumed that the
                    All simulation models in the Climate for Culture project were calibrated with measured data         rameters at different places inside and outside the building. A         soil temperature under the floor surface corresponds to the
                    to ensure the credibility of the simulation output. The calibrated model is then used to assess     full data set of measurements with a time step of one hour has          floor surface temperature and that the relative humidity has
                    the effect of active and passive measures on damage potential and energy demand under the           been available since 2012. Weather data was accessible from             a constant value of 95 % RH. Due to the lack of data on air
                    influence of a changing climate.                                                                    the Fraunhofer IBP outdoor testing facility, only 5 km away             change, a constant infiltration air change rate of 0.4 h -1 was
                    A second simplified approach using state-space models as transfer functions was also applied        from Roggersdorf. Thanks to the measurements , the observed             determined to be adequate in the validation process. As
                    for the prediction of indoor temperature and relative humidity. This method can only be ap-         damage could be linked to condensation that occurs mainly in            there is no regular service in the church, heat and moisture
                    plied when all necessary measured values are available for the parameterisation of the model.       the transitional period during springtime.                              gains from people were not included. In some simulation-
                    But the simulation performance of this method is higher and therefore faster. This makes it                                                                                 variants moisture gains from potted plants were included
                    possible to perform simulations for different building types on a fine grid over Europe for dif-                                                                            (40 g/h from April until August). Altogether 15 simulations were
                    ferent time periods to produce indoor climate and indoor climate risk maps.                                                                                                 carried out using boundary conditions and loads at different accu-
                                                                                                                                                                                                racy levels.

16                                                                                                                                                                                                                                                              17
Figure 1: Picture and screenshot of the WUFI®Plus model of the St.                                                                                                                        referred to as near future and far future respectively. This data       fluctuations of temperature and relative humidity in the church
Margaretha church in Roggersdorf, Germany                                                                                                                                                 is used for hygrothermal building simulations with the validated        are higher with mechanical ventilation systems than with no sys-
                                                                                                                                                                                          WUFI®Plus model of the church in Roggersdorf.                           tem at all. This could cause problems for valuable interior arti-
Model verification                                                                                                                                                                                                                                                facts that are sensitive to high RH fluctuations.
The measurements of indoor climate from the years 2005 and 2012                                                                                                                           Simulations of scenario A1B predict increasing indoor temperatures
were used to validate the simulation output. Statistical parameters                                                                                                                       for the mean, maximum and minimum statistical parameters of             Another method for controlling indoor relative humidity is
show a high correlation between measured and simulated data,                                                                                                                              about 0.6-0.7 K between near and far future. At the same time, the      conservation heating. Here, an additional heating device with
with a correlation coefficient of 0.994 for the year 2005 and 0.991                                                                                                                       parameters for indoor relative humidity increase by approximately 5     a maximum heating power of 10 kW is included in the building
for 2012. Relative humidity also shows good correlation coefficients                                                                                                                      % RH. In addition to the statistical evaluation of indoor climate pa-   model to control relative humidity through indoor temperature.
of 0.840 for 2005 and 0.833 for 2012. By comparing the 2012 data,                                                                                                                         rameters, an indoor damage and risk assessment was performed.           Whenever relative humidity would rise above a set-point, in this
main differences for relative humidity can be found during winter,                                                                                                                        During the Climate for Culture project, numerous damage functions       case 65 % RH, the nave is heated to reduce relative humidity. This
where the simulated relative humidity is systematically lower than                                                                                                                        were collected which describe climate-induced damage processes          method was able to limit maximum relative humidity throughout
in the measured data.                                                                                                                                                                     to support a risk assessment. These damage functions cover bio-         the whole year.
                                                                                                                                                                                          logical, chemical and mechanical damages . They were applied on
Furthermore, the accuracy of the simulation model was checked                                                                                                                             the simulated future indoor climates of the Roggersdorf church with     Conclusions
according to conservation demands by applying the criteria pro-                                                                                                                           the following results: a very small risk of mould growth can be ob-     The simulations of the St. Margaretha church in Roggersdorf show
posed by [2]. Temperature showed excellent accuracy between                                                                                                                               served, nevertheless the simulated indoor climate can still be con-     that hygrothermal building simulation is capable of producing re-
simulation results and measured data and an acceptable accu-                                                                                                                              sidered as safe. Possible damage could arise as indoor climate condi-   liable indoor climate data which fulfils the high accuracy require-
racy in relative humidity, which is visualised in the quantile-quan-                                                                                                                      tions are favourable for insect growth. Possible mechanical damage      ments of conservators. The simulation results can be used for an
tile scatterplots in Figure 2. By combining both indoor climate                                                                                                                           is predicted for panel paintings and wooden sculptures. Lacquered       in-depth assessment of historic buildings and their interior. Pre-
parameters, an acceptable accuracy could be achieved for 95 %                                                                                                                             wooden furniture is considered as safe. No chemical damages of pa-      dicted future climate can also be applied, which helps prepare
                                                                                                            y
of the examined days.                                                                                                                                                                     per and silk objects were predicted. The results of the damage and      historic buildings for the challenges of climate change. Possible
                                                                                                                                                                                          risk assessment were almost identical for both climatic scenarios       mitigation strategies and their impact on the building as well as
Figure 2: Quantile-quantile scatterplots of measured and simulat-                                                                                                                         and also remained at the same level for both time periods.              their energy demand can be evaluated to assess the effectivity of
ed indoor temperature (left) and relative humidity (right) with ac-                                                                                                                                                                                               retrofitting strategies.
curacy measures as defined by [2].                                                                                                                                                        Mitigation strategies
                                                                                                                                                                               Figure 1   As the church shows condensation-related moisture problems
Altogether, the WUFI®Plus model of the St. Margaretha church in                                                                                                                           different mitigation strategies were discussed. A guided manual         References
Roggersdorf is able to produce reliable simulation results of the in-                                                                                                                     ventilation strategy led to significantly higher daily fluctuations
door climate conditions and can be used to predict future indoor                                                                                                                          above 15 % RH for more than 30 days, which is not acceptable, as        1.   Holm, A. H.; Künzel, H. M.; Sedlbauer, K. (2003): The hygrothermal
                                                                                       25                                                      100
climate and to develop mitigation strategies.                                                                                                                                             it leads to mechanical damages in the interior. As a consequence,            behaviour of rooms: combining thermal building simulation and hy-
                                                                                       20                                                      90
                                                                                                                                                                                          the installation of a controlled ventilation system, which adapts            grothermal envelope calculation. In: Eight International IBPSA Con-
                                                                                       15
Future indoor climate prediction                                                                                                               80                                         to indoor and outdoor climate conditions, was considered. To                 ference, Eindhoven, The Netherlands, 11-14 Aug 2003: 499-505
                                                                        Measurements

                                                                                                                                Measurements

The future indoor climate prediction is based on the two climat-                       10
                                                                                                                                                70
                                                                                                                                                                                          assess the possibilities and limitations of this system, hygro-         2.   Kilian R. (2013): Klimastabilität historischer Gebäude – Bewertung
ic scenarios A1B and RCP 4 .5 from IPCC’s 4th and 5th reports.                          0                                                                                                 thermal building simulation was used to predict the indoor cli-              hygrothermischer Simulationen im Kontext der Präventiven Kon-
Outdoor climate data was created specifically for the location                          -5
                                                                                                                                               60
                                                                                                                                                                                          mate and compare it with the original free floating conditions               servierung. Dissertation University Stuttgart
of Roggersdorf through the regional downscaling model REMO                             -10                                                      50                                        in the church. From April to November, especially in the run-up
from the Max Planck Institute for Meteorology, which uses the                                                                                  40                                         to the critical spring period, relative and absolute humidity can
                                                                                         -10   -5   0   5   10   15   20   25                   40   50   60    70   80   90    100
scenarios as input for modelling all climate parameters relevant                                        Calculation                                            Calculation
                                                                                                                                                                                          be reduced through a ventilation system. No ventilation actions
for hygrothermal building simulations. Future outdoor climate                                                                                                                             are performed from mid-November until the end of March, as
was provided for the two time periods 2021-2050 and 2071-2100,                                                                                                                 Figure 2   the outdoor temperature falls below 0 °C. It was found that daily

18                                                                                                                                                                                                                                                                                                                                     19
Chapter 2.3
                                                                                                                                        description of the input for the model [4]. This single zone is                      1.3 Hourly based, EU-wide, external future A1B climate files [1]
Simulating and mapping future energy demands                                                                                            put into the model 16 times; for each zone some parameters are                       During the Climate for Culture project, external climate files
                                                                                                                                                                                                                             were developed especially for building simulation purposes us-
                                                                                                                                        changed according to the QoE and LoC. These parameters are
Jos van Schijndel, Zara Huijbregts, Marco H. J. Martens and Henk L. Schellen                                                            displayed in Tables I and II .                                                       ing the REMO model [3].

                                                                                                                                        Table I: Definition of Quality of Envelope (QoE) by different building
                                                                                                                                        parameters                                                                           2. METHODOLOGY
1. INTRODUCTION
                                                                                                                                                         QoE 1            QoE 2              QoE 3                QoE 4
                                                                                                                                                                                                                             A multi-zone energy model, representing a wide range of
Due to the climate change debate, a lot of research and maps                                          Building                          Exterior     Solid brick  Solid brick  Solid brick wall         Brick wall 100 mm,   museums and monumental buildings was implemented into
of external climate parameters are available. However, there is                                      simulation                         wall         wall 400 mm, wall 400 mm, 400 mm,                  cavity,              HAMBase. The latter consists of 16 different building zone
                                                                                                                                                     plastered    plastered    insulation on the        insulation 150 mm,
still a lack of maps of indoor climate performance parameters.                                      (HAMBase)                                                                  inside 100 mm,           brick 100 mm,        types made up of 4 levels of envelopes (LoE 1-4) and 4 levels
                                                                                                                                                                               plastered                plastered            of climate control (Lo C 1-4) from [4]. 7 performance indica-
This chapter presents a methodology for obtaining maps of
performances of similar buildings that are virtually spread all                                                                                                                                                              tors were used: (1) mean indoor temperature; (2) mean indoor
over Europe.                                                                                          Museum                                                                                                                 relative humidity; (3) mean heating demand; (4) mean cool-
                                                                                                                                        Glazing      Single          Double          Double low-e       Double low-e
                                                                                                       models                                                                                                                ing demand; (5) mean humidification demand; (6) mean de-
                                                                                                   (Classification)
Figure 1: Visualisation of the proposed methodology                                                                                     Infiltration 1 h-1           0.4 h-1         0.2 h-1            0.1 h-1              humidification demand; (7) total energy demand to produce
                                                                                                                                        rate
                                                                                                                                                                                                                             EU maps for 16 building types and five 30-year time slices:
The produced maps are useful for analysing the regional climate                                                            Figure 1                                                                                          recent past (1961-1990; RP), near future (2021-2050; NF), far
influence on building performance indicators such as energy                                                                             Table II: Definition of Level of Control (LoC) by different systems’                 future (2071-2100; FF), NF-RP and FF-RP. This gives a total of
use and indoor climate. Our approach is a new combination of                                                                            parameters                                                                           560 maps. Interpretation of mean demand is the mean pow-
three recent developments. Each development is introduced            validation results of the whole building model HAMBase are re-                                                                                          er (W) over a period of 30 years (regardless of the seasons).
                                                                                                                                                         LoC 1      LoC 2              LoC 3                  LoC 4
in a separate section: firstly, the simulation and mapping of        cently presented in [7].                                                                                                                                1 W (J/s) heat demand multiplied with 365 x 24 x 3600 s equals to
building performance indicators based on European weather                                                                               Temperature                                                                          annual heating energy of 31.536.000 J = 31.536 MJ. Please note
                                                                                                                                                                                                      20 (heating);
stations; secondly, a multi-zone energy model, representing a        1.2 A multi-zone indoor climate and energy model, repre-           set point [°C]       -   20 (heating) 20 (heating)                                   that in all our models, the building volume is 350 m3 . So 1W also
                                                                                                                                                                                                      22 (cooling)
wide range of buildings; and thirdly, the availability of hourly     senting a wide range of museums [4]                                                                                                                     represents 31.536 MJ/(year x 350 m3) = 90 kJ/(year x (m3 building
based, EU wide, external future A1B climate files from the Cli-      Marco Martens describes in his PhD thesis the input for the        Humidity set                           40 (humidification);  48 (humidification);    volume)) = 2.2510 -3 liter oil/(year x (m3 building volume)) (by us-
                                                                                                                                        point [%]            -        -
                                                                                                                                                                               60 (dehumidification) 52 (dehumidification)
mate for Culture project.                                            existing simulation model HAMBase that allows studying                                                                                                  ing caloric value of 106 J/litres for oil).
                                                                     all 16 combinations of quality of envelope (QoE) and level
1.1 The simulation and mapping of building performance in-           of control (LoC) of a typical exhibition room layout. To be        The construction of the building depends on QoE: walls, glaz-
dicators based on European weather stations [6]                      able to assess the influence of Quality of Envelope (QoE) and      ing and infiltration rate caused by leakages in the envelope, all
This paper presents a methodology and results for obtaining          Level of Control (LoC), this room layout is put into the simu-     change when improving the thermal quality of the envelope.
maps of performances of similar buildings that are virtually         lation model. The layout is based on common museum exhi-           Set-points depend on LoC. The available capacity for heat-
spread over the whole of Europe. The whole-building model            bition room specifications as encountered in several of the        ing, cooling, humidification and dehumidification is set to an
used for the simulations originates from the thermal indoor          researched museums; this room is located in the corner of          unrealistically high value to make sure set-points are actually
climate model ELAN which was already published in 1987 [8].          a building. The room consists of a single zone, 10 m long,         achieved; this is deliberately chosen to stress the influence                        For example 100W and a building volume of 500 m3 equals about
The current hourly-based model HAMBase, is part of the Heat,         10 m wide and 3.5 m high. The ceiling, floor, north and east       on energy use. All 16 types were implemented into one single                         100 litres/year.
Air and Moisture Laboratory [2], and is capable of simulating        walls are adiabatic, which means that the zone is connected to     multi-zone HAMBase model, thus providing a very efficient way
the indoor temperature, the indoor air humidity and energy use       other zones which are identical in behaviour but not part of the   of simulating all variants simultaneously. A year with hourly                        Furthermore, for all power calculations related with the indoor
for heating and cooling a multi-zone building. The physics of        simulation. The south and west walls are external walls            based external climate values takes less than 10 seconds to run                      climate, we assumed perfectly (100 % efficiency) air-conditioned
this model is extensively described by [9]. An overview of the       and have a window of 5 m² each. Martens provides a full            on a 4 GB/2.6 GHz computer.                                                          HVAC system. The reader should note that in practical HVAC

20                                                                                                                                                                                                                                                                                            21
systems a lot more energy may be required for cooling and de-                                                    3. EXEMPLARY RESULTS                                                                                                                                      regarding the total energy use in far future (FF) minus the               References
humidification. For example for dehumidification most systems                                                                                                                                                                                                              recent past (RP), i.e. FF-RP.
cool first below dew point and afterwards heat the air to a cer-                                                 In this section, simulated results for recent past (RP), near                                                                                                                                                                       1.   Climate for Culture (2014), http://www.climateforculture.eu
tain value. Therefore, it is clear, that a lot more energy may be                                                future (NF) and far future (FF) energy demands for Euro-                                                                                                  Figure 2: The total energy use in far future (FF) minus the recent past   2.   HAMLab (2014), http://archbps1.campus.tue.nl/bpswiki/index.
required than just looking at the air-side part of the balance.                                                  pean museums and monumental buildings are present-                                                                                                        (RP) using the corresponding Level of Control (LoC) and Level of Enve-         php/Hamlab
                                                                                                                 ed. As already discussed, we produced 560 maps. These                                                                                                     lope (LoE). The colour blue represents less expected energy needed in     3.   Jacob, D. and Podzun, R. (1997). Sensitivity studies with the Re-
                                                                                                                 maps will become publicly available on the Climate for Cul-                                                                                               the future, the colour red represents more expected energy needed in           gional Climate Model REMO. Meteorology and Atmospheric
                                                                                                                 ture website [1]. Figure 2 presents one of the main results                                                                                               the future. The brighter the colour, the higher the value.                     Physics, 63, pp. 119-129
                                                                                                                                                                                                                                                                                                                                                     4.   Martens, M.H.J. (2012), Climate risk assessment in museums, PhD
                                                                                                                                                                                                                                                                           It can be seen from Figure 2 that the first column is zero because             Dissertation, Eindhoven University of Technology
                                                                                                                                                                                                                                                                           LoC1 corresponds to a free floating building without any sys-             5.   van Schijndel, A. W. M. (2007). Integrated Heat Air and Moisture
                         0
                                                                 Type10FF-RPmeanTotalEnergy[W]
                                                                 70°N                                     500                              Type15FF-RPmeanTotalEnergy[W]
                                                                                                                                           70°N                                     500
                                                                                                                                                                                                                Type16FF-RPmeanTotalEnergy[W]
                                                                                                                                                                                                                70°N                                     500
                                                                                                                                                                                                                                                                           tems. The second column LoC2 corresponds to heated build-                      Modeling and Simulation, PhD Dissertation, Eindhoven University
                                                                                                                                                                                                                                                                           ings systems. LoC4, QoE1 represents a poor insulated building
                                                                                                          400

                                                          60°N
                                                                                                          300
                                                                                                                                                                                    400

                                                                                                                                                                                    300
                                                                                                                                                                                                                                                         400

                                                                                                                                                                                                                                                         300
                                                                                                                                                                                                                                                                                                                                                          of Technology
                                                                                                                                                                                                                                                                           with a high performance system. Here the highest differences
                                                                                                          200
                                                                                                                                                                                                                                                                                                                                                     6.   van Schijndel, A. W. M. & Schellen, H. L. (2013). The simulation and
                                                                                                                                    60°N                                                                 60°N
                                                                                                                                                                                    200                                                                  200
     QoE 4                                                                                                100
                                                                                                                                                                                    100                                                                  100

                                                                                                                                                                                                                                                                           between expected energy gains and losses can be observed.                      Mapping of Building Performance Indicators based on European
                                                   50°N                                                   0
                                                                                                                             50°N                                                   0             50°N                                                   0
                                                                                                          -100
                                                                                                                                                                                    -100                                                                 -100

                                            40°N
                                                                                                          -200

                                                                                                          -300
                                                                                                                      40°N
                                                                                                                                                                                    -200
                                                                                                                                                                                           40°N
                                                                                                                                                                                                                                                         -200              We refer to Tables I and II for the meaning of all different combi-            Weather Stations. Frontiers of Architectural Research, 2, 121-133
                                                                                                                                                                                    -300                                                                 -300

                                            10°W
                                                                  0°          10°E          20°E
                                                                                                   30°E
                                                                                                          -400

                                                                                                          -500        10°W
                                                                                                                                                                             30°E
                                                                                                                                                                                    -400
                                                                                                                                                                                                                                                  30°E
                                                                                                                                                                                                                                                         -400              nations of LoC and QoE.                                                   7.   van Schijndel, A. W. M. (2014). A review of the application of
                                                                                                                                            0°                        20°E          -500                         0°                        20°E          -500

                                                                                                                                                                                                                                                                                                                                                          SimuLink S-functions to multi domain modeling and building simu-
                                                                                                                                                        10°E                                                                 10°E

                                                                 Type10FF-RPmeanTotalEnergy[W]
                         0                                       70°N                                     500                              Type11FF-RPmeanTotalEnergy[W]                                        Type12FF-RPmeanTotalEnergy[W]

                                                                                                                                                                                                                                                                                                                                                          lation. Journal of Building Performance Simulation, 7(3), 165-178
                                                                                                                                           70°N                                     500                         70°N                                     500
                                                                                                          400
                                                                                                                                                                                    400                                                                  400
                                                                                                          300
                                                          60°N
                                                                                                          200                       60°N
                                                                                                                                                                                    300

                                                                                                                                                                                    200
                                                                                                                                                                                                         60°N
                                                                                                                                                                                                                                                         300

                                                                                                                                                                                                                                                         200
                                                                                                                                                                                                                                                                           4. CONCLUSIONS                                                            8.   de Wit, M. H.; Driessen, H. H. (1988). ELAN-A Computer Model for
     QoE 3
                                                                                                          100

                                                   50°N                                                   0
                                                                                                                             50°N
                                                                                                                                                                                    100

                                                                                                                                                                                    0             50°N
                                                                                                                                                                                                                                                         100

                                                                                                                                                                                                                                                         0
                                                                                                                                                                                                                                                                                                                                                          Building Energy Design. Building and Environment 23, pp. 285-289
                                                                                                                                                                                                                                                                           A new method for simulating and mapping energy demands
                                                                                                          -100

                                                                                                          -200
                                                                                                                                                                                    -100

                                                                                                                                                                                    -200
                                                                                                                                                                                                                                                         -100

                                                                                                                                                                                                                                                         -200
                                                                                                                                                                                                                                                                                                                                                     9.   de Wit, M. H. (2006). HAMBase, Heat, Air and Moisture Model for
                                                                                                                                                                                                                                                                           for European buildings for the recent past (RP), near future
                                            40°N
                                                                                                          -300

                                                                                                          -400
                                                                                                                      40°N
                                                                                                                                                                                    -300   40°N
                                                                                                                                                                                                                                                         -300
                                                                                                                                                                                                                                                                                                                                                          Building and Systems Evaluation, Bouwstenen 100, Eindhoven
                                            10°W
                                                                                                   30°E
                                                                                                                                                                                    -400                                                                 -400

                                                                                                                                                                                                                                                                           (NF) and far future (FF) is presented. It is a new combina-                    University of Technology
                                                                  0°                        20°E          -500        10°W
                                                                                                                                                                             30°E
                                                                                                                                                                                           10°W
                                                                                                                                                                                                                                                  30°E
                                                                              10°E
                                                                                                                                            0°                        20°E          -500                         0°                        20°E          -500
                                                                                                                                                        10°E                                                                 10°E

                                                                                                                                                                                                                                                                           tion of three recent developments: firstly, the simulation
                                                                 Type6FF-RPmeanTotalEnergy[W]
                         0                                       70°N                                     500                              Type7FF-RPmeanTotalEnergy[W]
                                                                                                                                           70°N                                     500
                                                                                                                                                                                                                Type8FF-RPmeanTotalEnergy[W]
                                                                                                                                                                                                                70°N                                     500
                                                                                                          400

                                                          60°N
                                                                                                          300
                                                                                                                                                                                    400

                                                                                                                                                                                    300
                                                                                                                                                                                                                                                         400

                                                                                                                                                                                                                                                         300
                                                                                                                                                                                                                                                                           and mapping of building performance indicators based on
                                                                                                          200                       60°N                                                                 60°N

                                                                                                          100
                                                                                                                                                                                    200                                                                  200
                                                                                                                                                                                                                                                                           European weather stations; secondly, a multi-zone energy
     QoE 2                                                                                                0
                                                                                                                                                                                    100                                                                  100

                                                                                                                                                                                                                                                                           model, representing a wide range of buildings which consists
                                                   50°N
                                                                                                                             50°N                                                   0             50°N                                                   0
                                                                                                          -100
                                                                                                                                                                                    -100                                                                 -100
                                                                                                          -200
                                            40°N
                                                                                                          -300
                                                                                                                      40°N
                                                                                                                                                                                    -200

                                                                                                                                                                                    -300   40°N
                                                                                                                                                                                                                                                         -200

                                                                                                                                                                                                                                                         -300
                                                                                                                                                                                                                                                                           of 16 different building zone types equal to all combinations of
                                                                                                                                                                                                                                                                           4 levels of buildings construction and 4 levels of climate con-
                                                                                                          -400
                                            10°W
                                                                                                   30°E
                                                                                                                                                                                    -400                                                                 -400
                                                                  0°                        20°E          -500        10°W
                                                                                                                                                                             30°E
                                                                                                                                                                                           10°W
                                                                                                                                                                                                                                                  30°E
                                                                              10°E
                                                                                                                                            0°                        20°E          -500                         0°                        20°E          -500
                                                                                                                                                        10°E                                                                 10°E

                                                                 Type2FF-RPmeanTotalEnergy[W]                                                                                                                                                                              trol; and thirdly, the availability of hourly based, EU wide, ex-
                         0                                       70°N
                                                                                                          500                              Type3FF-RPmeanTotalEnergy[W]                                         Type4FF-RPmeanTotalEnergy[W]

                                                                                                                                                                                                                                                                           ternal future A1B climate files from the Climate for Culture
                                                                                                                                           70°N                                     500                         70°N                                     500
                                                                                                          400
                                                                                                                                                                                    400                                                                  400
                                                                                                          300

                                                                                                                                                                                                                                                                           project. 7 performance indicators were used: (1) mean indoor
                                                          60°N                                                                                                                      300                                                                  300
                                                                                                                                    60°N                                                                 60°N
                                                                                                          200
                                                                                                                                                                                    200                                                                  200
                                                                                                          100

     QoE 1                                         50°N                                                   0
                                                                                                                             50°N
                                                                                                                                                                                    100

                                                                                                                                                                                    0             50°N
                                                                                                                                                                                                                                                         100

                                                                                                                                                                                                                                                         0
                                                                                                                                                                                                                                                                           temperature; (2) mean indoor relative humidity; (3) mean heat-
                                                                                                          -100

                                            40°N
                                                                                                          -200
                                                                                                                                                                                    -100

                                                                                                                                                                                    -200
                                                                                                                                                                                                                                                         -100

                                                                                                                                                                                                                                                         -200
                                                                                                                                                                                                                                                                           ing demand; (4) mean cooling demand; (5) mean humidifica-
                                                                                                          -300

                                                                                                                                                                                                                                                                           tion demand; (6) mean dehumidification demand; (7) total en-
                                                                                                                      40°N                                                                 40°N
                                                                                                                                                                                    -300                                                                 -300
                                                                                                          -400
                                            10°W
                                                                                                   30°E
                                                                                                                                                                                    -400                                                                 -400

                                                                                                                                                                                                                                                                           ergy demand to produce EU maps for 16 building types and five
                                                                  0°          10°E          20°E          -500        10°W
                                                                                                                                                                             30°E
                                                                                                                                                                                           10°W
                                                                                                                                                                                                                                                  30°E
                                                                                                                                            0°                        20°E          -500                         0°                        20°E          -500
                                                                                                                                                        10°E

                                                                                                                                                                                                                                                                           30 year time periods: RP, NF, FF, NF-RP and FF-RP. This gives a
                             LoC 1                                         LoC 2                                                                   LoC 3                                                               LoC 4
                                                                                                                                                                                                                                                                           total of total 560 maps. By using a classification of monumental
                                                                                                                                                                                                                                                                Figure 2   buildings and museums, the influence of level of control and level
                                                                                                                                                                                                                                                                           of envelope on the performance indicators can be visualised.

22                                                                                                                                                                                                                                                                                                                                                                                                                         23
Chapter 2.4
                                                                                                                                                                                                     The methodology used to conduct the investigation was divid-
Conservation of cultural heritage in the UK                                                                                                                                                          ed into four steps. The first step involved a process of model
                                                                                                                                                                                                     verification. This was done with the aim of developing a real-
Anastasios Markopoulos                                                                                                                                                                               istic modelled representation of the indoor hygrothermal con-
                                                                                                                                                                                                     ditions measured in the two buildings studied. A sensitivity
                                                                                                                                                                                                     analysis of a range of building parameters was carried out to
Interest in the conservation of historic buildings is growing due    palace built in the 12th century and later transformed into a site                                                              determine the level of correlation between the measured and
to concern over the risk of damage to both the material integri-     resembling a stately home by the Archbishop of Canterbury in                                                                    predicted indoor hygrothermal conditions and which factors
ty of the building construction and the items they house. Mois-      1456. It is recognised as one of the most fragile properties in                                                                 indicated the greatest influence on indoor hygrothermal con-
ture is one of the most prevalent causes of damage in historic       the National Trust collection and houses sculptures, historical                                                                 ditions. Comparison was drawn between the two sets of data
buildings, which can erode and rot aging building materials [1].     portraits and fine Stuart furniture. Two unheated zones on the                                                                  using a set of statistical criteria to assess the level of modelling
In tackling the issue of moisture in historic buildings, a prior-    first floor of the East range of the building were modelled. The                                                                accuracy achieved. Following this initial model verification pro-
ity should be evaluating the use of prospective conservation         building structure itself is complex and designed around several                                                                cedure, the accepted models were then simulated using future
strategies that could improve indoor moisture control, whilst        courtyards. Its composition is a mixture of mass stone wall and                                                                 climate change scenarios. These were set in three different time
at the same time recognising the sensitive state of the building     timber framed construction, a walling practice widely employed                                                                  periods labelled as the ‘near past’ (1961-1990), ‘near future’
materials, which have been subject to hygrothermal fluctua-          in the early part of the 17th century when Knole House was be-                                                                  (2021-2050) and ‘far future’ (2071-2100). The third stage of the
tions over a period of centuries [2]. Adverse response to newly      ing extended; and single glazing is used throughout. The house                                                                  methodology analysed the risk of moisture and temperature-
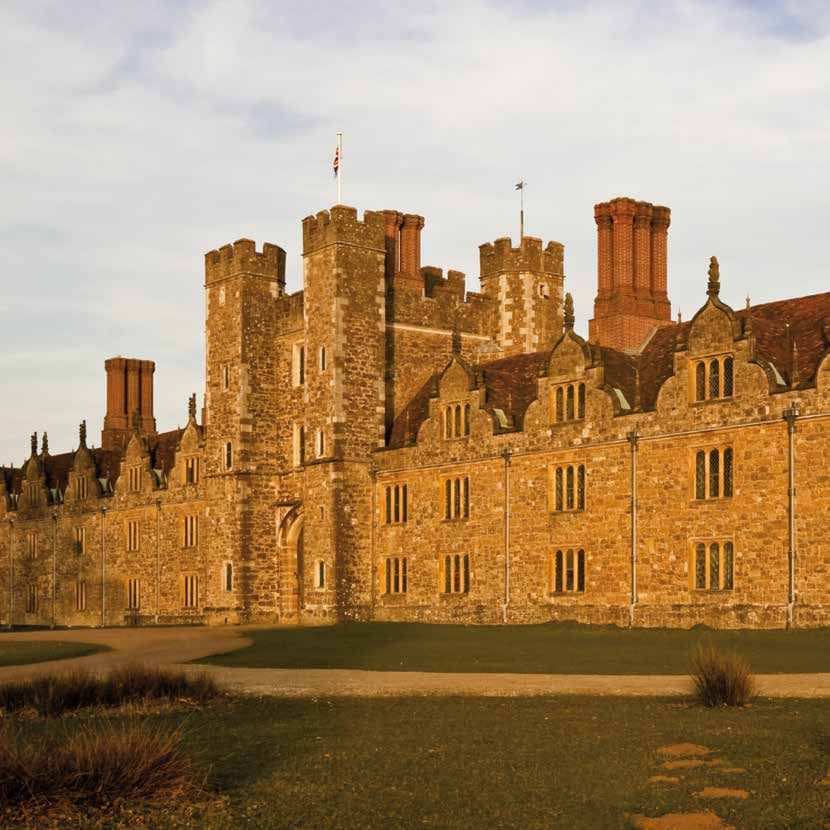
implemented approaches may lead to further moisture-related          is highly regarded as an outstanding example of Elizabethan            Figure 1 (National Trust Images/Andreas von Einsiedel)   related damage in the modelled buildings using an assessment
problems e.g. indoor humidification, which can induce mould          design [5] and great emphasis has been placed on its continued                                                                  tool developed during the course of the Climate for Culture
growth on cold indoor surfaces or even interstitial condensa-        preservation. A recent five-year programme was initiated focus-                                                                 project. Using the predicted indoor air temperature and rela-
tion in the construction [3].                                        ing on building refurbishment and the repair of moisture-related                                                                tive humidity produced for each of the climate change periods
An investigation was undertaken with the aim of assessing the        damage recorded at the site. This damage has been observed in                                                                   in the previous step, the risk of damage could be assessed. Fi-
hygrothermal performance of historic buildings. Numerical            the form of cracked masonry, rotting of delicate materials such                                                                 nally, the use of mitigation strategies to address concern over
modelling was adopted to carry out this analysis and involved the    as silks and velvet furniture coverings, mould growth on paint-                                                                 the hygrothermal conditions prevalent in the indoor building
use of the whole-building simulation tool WUFI®Plus [4], which       ings and uncomfortable indoor environmental quality.                                                                            environment was modelled. There was particular interest in in-
allowed for a range of building parameters to be looked at as part   The second building investigated was the Greek-inspired Palladi-                                                                vestigating the use of a conservation heating system at Knole
of the hygrothermal assessment process. These included occu-         an-style chapel located on the Gibside estate. This was originally                                                              House. The use of conservation heating, and its development
pancy, ventilation and the introduction of building conservation     designed by James Paine during the Georgian era and finally                                                                     in National Trust properties, continues to grow in light of the
strategies, including external wall insulation and conservation      completed in 1816 under the estate ownership of John Lyon. Its                                                                  recent commitment made to reducing the use of fossil fuels for
heating. The innovative methodology of correlating high resolu-      notable features include the central dome and a double portico                                                                  heating purposes and electricity by 50 % by 2020 [7]. In addition
tion climate change scenarios with building simulation models,       carrying a pediment surmounted by a parapet with four urns [6].                                                                 to modelling this system, the installation of insulation in the ex-
a key component of the Climate for Culture (CfC) project, also       A single zone was modelled where the main building construc-                                                                    ternal walls, ceiling and flooring was also investigated.
enabled quantification of the buildings’ hygrothermal response       tion material is ashlar stone with a plaster applied to the interior
with respect to changes in the external climate conditions dur-      wall and ceiling surfaces, timber clad walls in the seating areas
ing present and future climate change scenarios. An additional       and a combination of tiled and carpeted flooring. The site was
aspect of the work involved the risk assessment of potential         sold to the National Trust in 1964 and has since been carefully re-                                                             Figure 1: Venetian ambassador’s bedroom at Knole,
damage to building materials induced through the hygrothermal        assembled and refurbished after centuries of decline. The over-                                                                 Sevenoaks, Kent
conditions arising in the indoor environment.                        all building condition is of a reasonable quality and only minor
The buildings looked at during this study belong to the National     work is required, indicating that there are no serious structural                                                               Figure 2: The palladian chapel, begun in 1760 to the design of James
Trust (NT) collection and are located in the South East and North    concerns. As is the case in Knole House, no permanent heating is               Figure 2 (National Trust Images/Robert Morris)   paine, at Gibside, Newcastle Upon Tyne
of England, respectively. The first is Knole House, a medieval       applied in the building.

24                                                                                                                                                                                                                                                                    25
You can also read