Climate change impacts on corals in the UK Overseas Territories of British Indian Ocean Territory (BIOT) and the Pitcairn Islands
←
→
Page content transcription
If your browser does not render page correctly, please read the page content below
Climate change impacts
on corals in the UK
Overseas Territories of
British Indian Ocean
Territory (BIOT) and the
Pitcairn Islands

Blue Belt Programme

April 2021

Authors: Lincoln, S., Cowburn, B., Howes, E., Birchenough, S.N.R., Pinnegar, J.,
Dye, S., Buckley, P., Engelhard, G.H. and Townhill, B.L.

Issue date: 29 March 2021
© Crown copyright 2020
This information is licensed under the Open Government Licence v3.0. To view this licence,
visit www.nationalarchives.gov.uk/doc/open-government-licence/

This publication is available at www.gov.uk/government/publications

www.cefas.co.uk
Document Control

Submitted to:                Kylie Bamford (UK Foreign, Commonwealth and
                             Development Office)

Date submitted:              29 March 2021

Project Manager:             Victoria Young

Report compiled by:          Susana Lincoln

Quality control by:          Georg H. Engelhard

Approved by and date:        Christopher Darby and Silvana Birchenough, 25 March
                             2021

Version:                     Final checked

Version Control History

 Author               Date               Summary of changes                     Version
 Lincoln et al.       November 2020      Initial draft                          V0.1
 Lincoln et al.       January 2021       External peer review completed         V0.2
 Lincoln et al.       February 2021      QC QA corrections and final draft      V1.0
 Lincoln et al.       February 2021      Comments from Emily Hardman            V1.1
                                         (Marine Management
                                         Organisation)
 Lincoln et al.       March 2021         Editorial comments from Silvana        V2.0
                                         Birchenough et al.
 Lincoln et al.       March 2021         Editorial comments from                V2.1
                                         Christopher Darby
 Lincoln et al.       March 2021         All comments addressed                 Final
 Lincoln et al.       April 2021         Final checks by reviewers prior        Checked
                                         to publication

 This report has been reviewed by:

 Sheppard, C. (University of Warwick, UK), Wabnitz, C. (University of British Columbia,
 Canada), Dutra, L. (CSIRO, Australia), Graham, J. (Cefas, UK), Archer-Rand, S. (Cefas,
 UK) and Emily Hardman (MMO, UK).

 Recommended citation for this report:

 Lincoln, S., Cowburn, B., Howes, E., Birchenough, S.N.R., Pinnegar, J., Dye, S., Buckley,
 P., Engelhard, G.H. and Townhill, B.L. (2021). Climate change impacts on corals in the
 UK Overseas Territories of BIOT and the Pitcairn Islands. Scientific Report. UK Blue Belt
 Programme, 83 pp.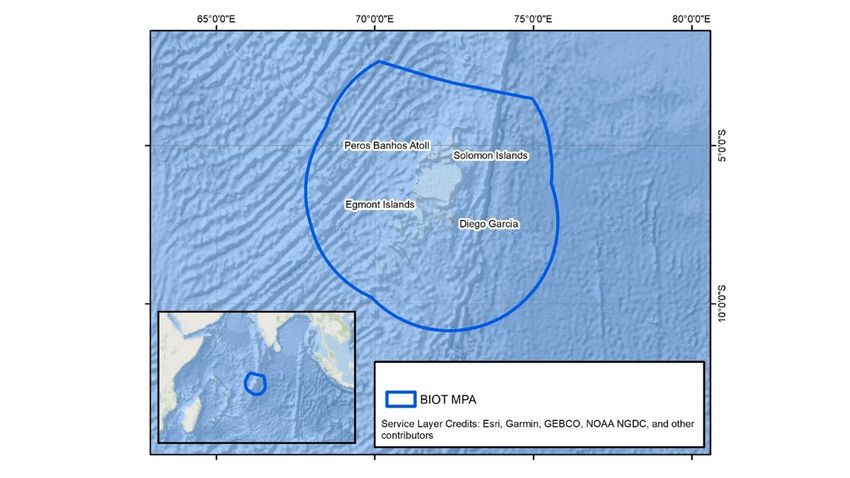
Contents
1.      Executive summary ................................................................................................................. 1

2.     Introduction ............................................................................................................................. 2
     2.1.   Purpose of this document ................................................................................................ 2
     2.2.   Background to this document .......................................................................................... 2
     2.3.   British Indian Ocean Territory (BIOT)............................................................................... 3
     2.4.   Pitcairn Islands ................................................................................................................ 4
     2.5.   Overview of marine climate change in the Indian and Pacific Ocean regions................... 5
       2.5.1.     Sea surface temperature change ............................................................................. 5
       2.5.2.     Ocean acidification and carbon chemistry ................................................................ 7
       2.5.3.     Sea level rise ......................................................................................................... 10
       2.5.4.     Extreme weather events ........................................................................................ 11
     2.6.   Overview of climate change impacts on corals .............................................................. 12
       2.6.1.     Impacts from bleaching .......................................................................................... 12
       2.6.2.     Impacts from changes in carbon chemistry and ocean acidification ....................... 13
       2.6.3.     Impacts from sea level rise and extreme weather events ....................................... 15

3.     BIOT: drivers of marine climate change................................................................................. 17
     3.1.   Sea surface temperature change................................................................................... 17
       3.1.1.    Observed changes ................................................................................................. 17
       3.1.3.    Projected future changes ....................................................................................... 19
     3.2.   Ocean acidification and carbon chemistry...................................................................... 21
       3.2.1.    Observed changes ................................................................................................. 21
       3.2.2.    Projected future changes ....................................................................................... 22
     3.3.   Sea level rise ................................................................................................................. 23
       3.3.1.    Observed changes ................................................................................................. 23
       3.3.2.    Projected future changes ....................................................................................... 24
     3.4.   Extreme weather events ................................................................................................ 24
       3.4.1.    Observed changes ................................................................................................. 24
       3.4.2.    Projected future changes ....................................................................................... 25

4.     BIOT corals: climate change impacts .................................................................................... 26
     4.1.   Impacts from bleaching.................................................................................................. 26
       4.1.1.   Observed impacts .................................................................................................. 26
       4.1.2.   Projected future impacts ........................................................................................ 27
       4.1.3.   Knowledge gaps and research needs .................................................................... 28
     4.2.   Impacts from changes in carbon chemistry and ocean acidification ............................... 28
       4.2.1.   Observed impacts .................................................................................................. 28
       4.2.2.   Projected future impacts ........................................................................................ 29
       4.2.3.   Knowledge gaps and research needs .................................................................... 29
     4.3.   Impacts from sea level rise and extreme weather events............................................... 30
       4.3.1.   Observed impacts .................................................................................................. 30
       4.3.2.   Projected future impacts ........................................................................................ 30
       4.3.3.   Knowledge gaps and research needs .................................................................... 31
     4.4.   Other anthropogenic pressures ..................................................................................... 31
       4.4.1.   Knowledge gaps and research needs .................................................................... 32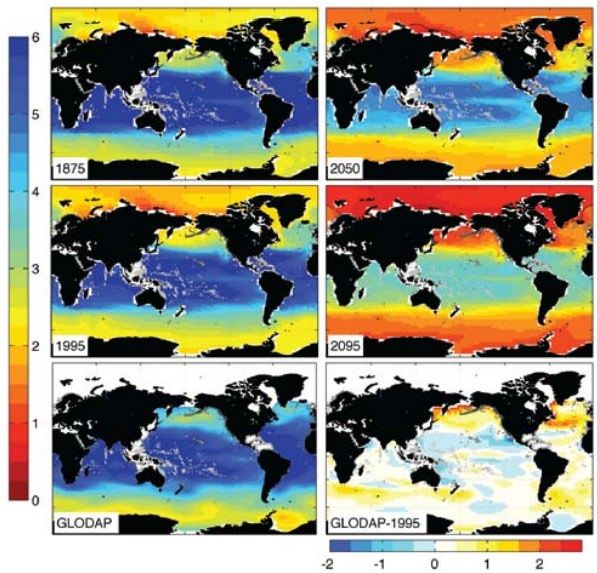
5.     Pitcairn Islands: drivers of marine climate change ................................................................. 33
     5.1.   Sea surface temperature change................................................................................... 33
       5.1.1.     Observed changes ................................................................................................. 33
       5.1.2.     Projected future changes ....................................................................................... 35
     5.2.   Ocean acidification and carbon chemistry...................................................................... 36
       5.2.1.     Observed changes ................................................................................................. 36
       5.2.2.     Projected future changes ....................................................................................... 36
     5.3.   Sea level rise ................................................................................................................. 37
       5.3.1.     Observed changes ................................................................................................. 37
       5.3.2.     Projected future changes ....................................................................................... 38
     5.4.   Extreme weather events ................................................................................................ 38
       5.4.1.     Observed changes ................................................................................................. 38
       5.4.2.     Projected future changes ....................................................................................... 39

6.     Pitcairn Islands corals: climate change impacts..................................................................... 40
     6.1.   Impacts from bleaching.................................................................................................. 40
       6.1.1.     Observed impacts .................................................................................................. 40
       6.1.2.     Projected future impacts ........................................................................................ 41
       6.1.3.     Knowledge gaps and research needs .................................................................... 42
     6.2.   Impacts from changes in carbon chemistry and ocean acidification ............................... 42
       6.2.1.     Observed impacts .................................................................................................. 42
       6.2.2.     Projected future impacts ........................................................................................ 43
       6.2.3.     Knowledge gaps and research needs .................................................................... 43
     6.3.   Impacts from sea level rise and extreme weather events............................................... 44
       6.3.1.     Observed impacts .................................................................................................. 44
       6.3.2.     Projected future impacts ........................................................................................ 44
       6.3.3.     Knowledge gaps and research needs .................................................................... 45
     6.4.   Other anthropogenic pressures ..................................................................................... 45
       6.4.1.     Knowledge gaps and research needs .................................................................... 46

7.     Other valuable marine habitats and communities .................................................................. 47
     7.1.  Macroalgae.................................................................................................................... 47
     7.2.  Seagrass ....................................................................................................................... 47
     7.3.  Mangroves..................................................................................................................... 48
     7.4.  Reef fishes and sharks .................................................................................................. 48
     7.5.  Seabirds ........................................................................................................................ 49
     7.6.  Marine turtles................................................................................................................. 50
     7.7.  Cetaceans ..................................................................................................................... 50

8.     Building resilience to climate change..................................................................................... 52
     8.1.   Limiting impact of human activities ................................................................................ 52
     8.2.   Active interventions ....................................................................................................... 54
     8.3.   Current management measures in place ....................................................................... 54
     8.4.   Further options to be considered ................................................................................... 55
     8.5.   Knowledge gaps and research needs ............................................................................ 55
       8.5.1.    Habitat mapping and vulnerability assessments..................................................... 55
       8.5.2.    Coral interventions ................................................................................................. 56
       8.5.3.    Ocean acidification and carbon chemistry .............................................................. 56
       8.5.4.    Sea level ................................................................................................................ 56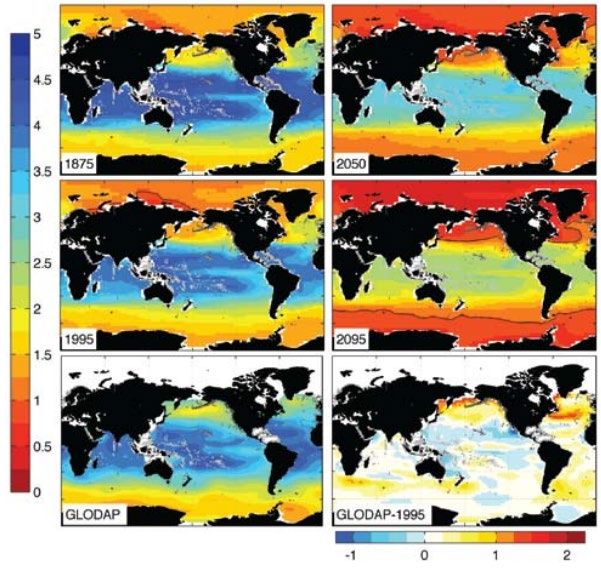
8.5.5.        Implementation of fisheries management and collection of catch records .............. 56

9.     Summary and conclusions .................................................................................................... 58

10. Acknowledgements ............................................................................................................... 60

11. Citations ................................................................................................................................ 61
List of Figures
Figure 1. The British Indian Ocean Territory Maritime Boundary and designated Marine Protected
Area, which occupies the entire Fisheries Conservation and Management Zone. ............. 3
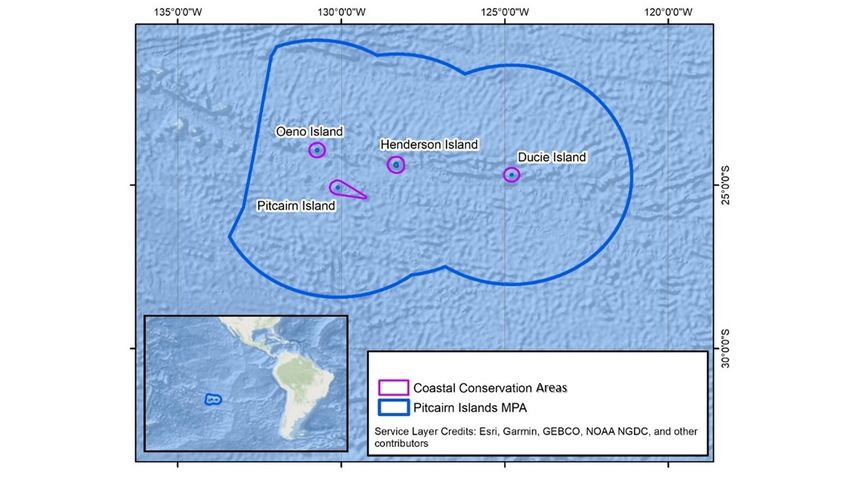
Figure 2. The Pitcairn Maritime Boundary and designated Marine Protected Area, which occupies
the entire Exclusive Economic Zone. The Marine Protected Area is a no-take area, but
subsistence fishing is allowed within the Coastal Conservation Areas. .............................. 5
Figure 3. SST anomalies during example years of El Niño (top) and La Niña events (bottom).
Figure copied with permission from Santoso and National Center for Atmospheric
Research Staff (2020). ...................................................................................................... 6
Figure 4. (Top and middle rows) CCSM3-modelled decadal mean Ωar (left) and Ωca (right) at the
sea surface, centred around the years 1875, 1995, 2050, and 2095 (bottom row)
GLODAP-based Ωar/Ωca at the sea surface, nominally for 1995; the GLODAP-1995 plot
shows the difference between the GLODAP-based and CCSM-based 1995 fields. Note
the different range of the difference plots. Deep coral reefs are indicated by darker grey
dots; shallow-water coral reefs are indicated with lighter grey dots. White areas indicate
regions with no data. GLODAP denotes carbon system measurements collected from
1990 through 1998, during CO2 survey oceanic cruises. Figure copied with permission
from Feely et al. (2009). .................................................................................................... 9
Figure 5. Projections of global sea level rise for the three RCPs, calculated based on a global set
of local sea level projections. Solid line = median, dashed = 5th–95th percentile, dotted =
0.5th–99.5th percentiles. Copied with permission from Kopp et al. (2014). ........................ 11
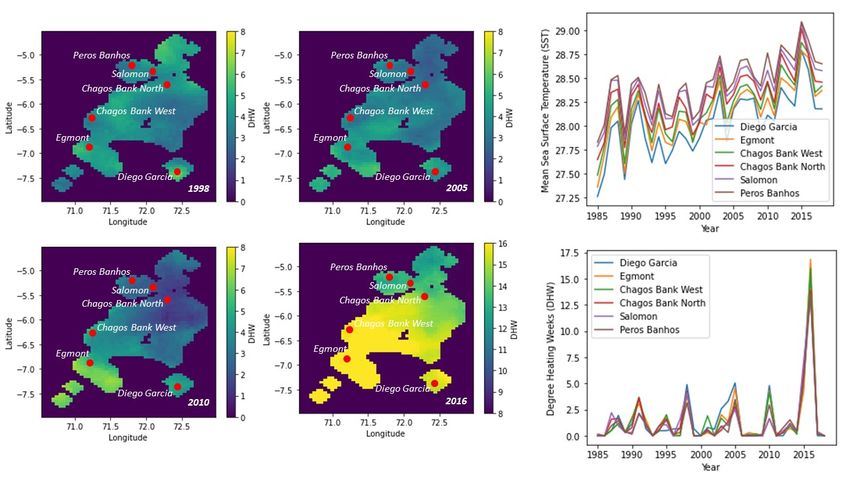
Figure 6. Past thermal stress in British Indian Ocean Territory (BIOT) showing: time series of mean
annual sea surface temperature (SST) (top right) and total Degree Heating Weeks
(DHWs) (bottom right) from six monitoring sites; and maps of DHWs during strong thermal
stress years 1998, 2005, 2010 and 2016, showing the position of the monitoring sites. The
dark blue areas denote no data. Data obtained from NOAA Coral Reef Watch (2018). ... 18
Figure 7. Historical and projected SST in the Indian Ocean, under two climate change emissions
scenarios. Original source: Figure 30.2 (Panel (f)) from Hoegh-Guldberg, O., R. Cai, E.S.
Poloczanska, P.G. Brewer, S. Sundby, K. Hilmi, V.J. Fabry, and S. Jung, 2014: The
Ocean. In: Climate Change 2014: Impacts, Adaptation, and Vulnerability. Part B: Regional
Aspects. Contribution of Working Group II to the Fifth Assessment Report of the
Intergovernmental Panel on Climate Change [Barros, V.R., C.B. Field, D.J. Dokken, M.D.
Mastrandrea, K.J. Mach, T.E. Bilir, M. Chatterjee, K.L. Ebi, Y.O. Estrada, R.C. Genova, B.
Girma, E.S. Kissel, A.N. Levy, S. MacCracken, P.R. Mastrandrea, and L.L.White (eds.)].
Cambridge University Press, Cambridge, United Kingdom and New York, NY, USA, pp.
1655-1731. ...................................................................................................................... 19
Figure 8. Future average SST for Pitcairn and BIOT, showing the predicted warming under Paris
Agreement (RCP2.6, left) and worst-case scenario (RCP 8.5, right). Data were obtained
from the UKESM1 forecast model, from Sellar et al. (2019). ........................................... 20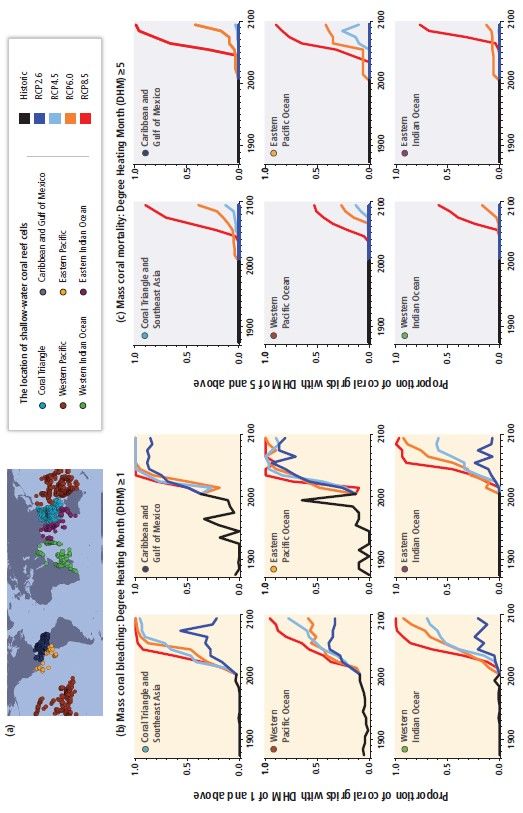
Figure 9. Left: mass coral bleaching in different oceans under different climate change scenarios,
indicated by proportion of coral grids that are subject to at least Degree Heating Month
(DHM) equal to 1 or higher. Right: mass coral mortality under different climate change
scenarios, where mortality is indicated by the proportion of coral grids that are subject to
DHM of 5 or higher. Original source: Figure 30.10 from Hoegh-Guldberg, O., R. Cai, E.S.
Poloczanska, P.G. Brewer, S. Sundby, K. Hilmi, V.J. Fabry, and S. Jung, 2014: The
Ocean. In: Climate Change 2014: Impacts, Adaptation, and Vulnerability. Part B: Regional
Aspects. Contribution of Working Group II to the Fifth Assessment Report of the
Intergovernmental Panel on Climate Change [Barros, V.R., C.B. Field, D.J. Dokken, M.D.
Mastrandrea, K.J. Mach, T.E. Bilir, M. Chatterjee, K.L. Ebi, Y.O. Estrada, R.C. Genova, B.
Girma, E.S. Kissel, A.N. Levy, S. MacCracken, P.R. Mastrandrea, and L.L.White (eds.)].
Cambridge University Press, Cambridge, United Kingdom and New York, NY, USA, pp.
1655-1731. ...................................................................................................................... 21
Figure 10. Outputs from the CMIP5 ensemble showing mean surface water pH in the western
Indian Ocean for the period 1956–2005. The approximate location of BIOT is indicated by
the orange star symbol (NOAA Climate Change Web Portal 2020). ................................ 22
Figure 11. Current and future average sea surface aragonite saturation state (Ωar) for Pitcairn
(Blue) and BIOT (Red), showing the predicted decline in saturation under Paris
Agreement (RCP2.6, left) and worst-case scenario (RCP8.5, right). Data were obtained
from the UKESM1 forecast model, from Sellar et al. (2019). ........................................... 22
Figure 12. Outputs from the CMIP5 ensemble showing mean surface water pH anomaly under high
emissions scenarios (RCP8.5) in the western Indian Ocean for the period 2050-2099
compared to averages in 1956-2005. The approximate location of BIOT is indicated by the
orange star symbol (NOAA Climate Change Web Portal 2020). ...................................... 23
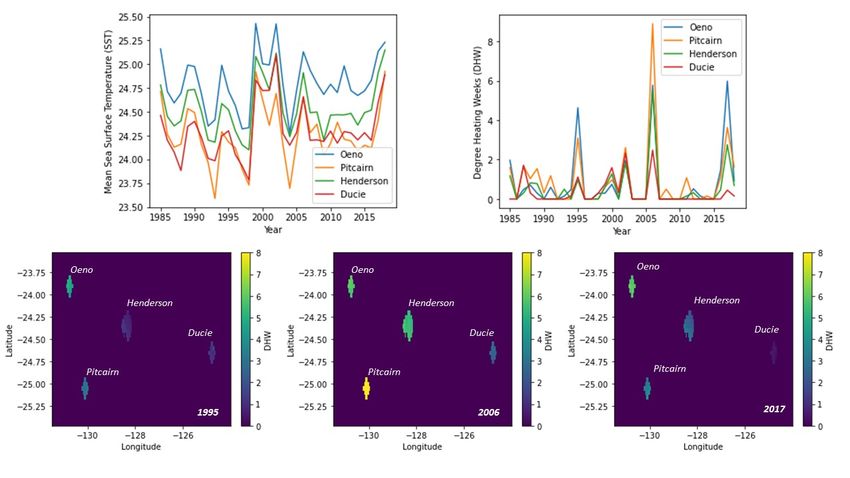
Figure 13. Past thermal stress in the Pitcairn Islands showing: time series of mean annual sea
surface temperature (SST) (top left) and total Degree Heating Weeks (DHWs) (top right)
from each of the islands; and maps of DHWs during strong thermal stress years 1995,
2006, and 2017, around the location of each of the islands. The dark blue areas denote no
data. Data obtained from NOAA Coral Reef Watch (2018). ............................................. 34
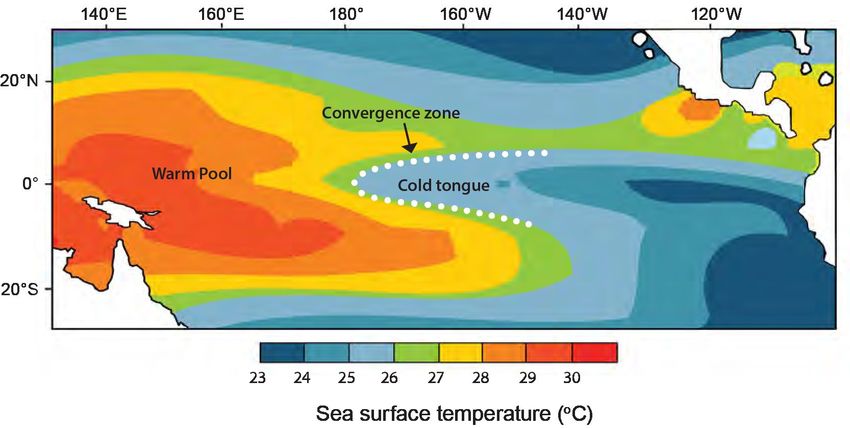
Figure 14. The position of the warm pool in the western Pacific (here shown under La Niña
conditions), and the convergence zone where the warm pool meets nutrient-enriched
waters of the eastern equatorial Pacific. In El Niño years, the warm pool extends further
east, towards Pitcairn. The location of the Pitcairn Islands is shown by the black dot.
Figure copied with permission from Bell et al. (2011a). Original source is the Met Office
Hadley Centre sea-Ice concentration and Sea-Surface Temperature data set (HadISST),
from Chagnaud (2008). ................................................................................................... 35
Figure 15. Outputs from the CMIP5 ensemble showing mean surface water pH in the central South
Pacific Ocean for the period (1956-2005). The approximate location of the Pitcairn Islands
is indicated by the orange star symbol. Figure reproduced from NOAA Climate Change
Web Portal (2020). .......................................................................................................... 36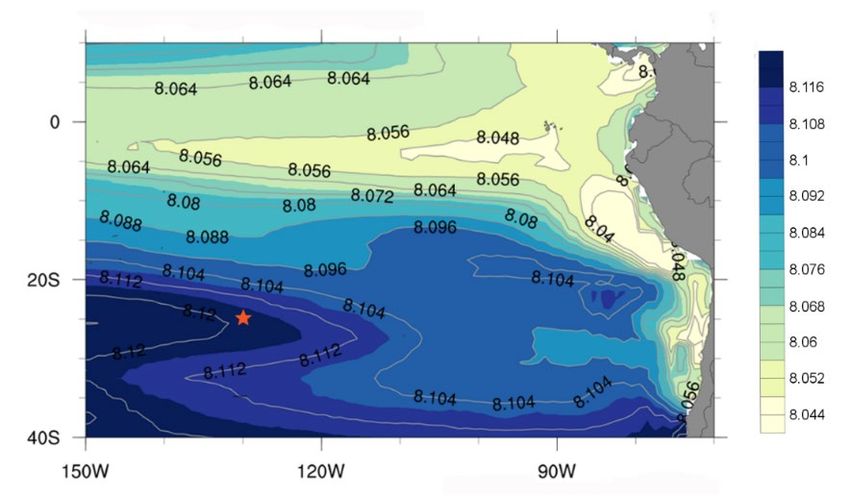
List of Tables
Table 1. Past thermal stress in British Indian Ocean Territory (BIOT), showing the mean SST at the
         start and end of a time-series spanning 1985–2018 and the difference in mean SST, along
         with Degree Heating Weeks (DHWs) levels in potential bleaching years, the cumulative
         DHW, and the number or Alert Level 1 and 2 thermal stress events. Data from NOAA
         Coral Reef Watch (2018). ................................................................................................ 26

Table 2. Past thermal stress in the Pitcairn Islands showing mean SST at the start and end of a
         time series spanning 1985–2018 and the difference in mean SST, along with Degree
         Heating Weeks (DHWs) in potential bleaching years, the cumulative DHW, and the
         number or Alert Level 1 and 2 thermal stress events. Data obtained from NOAA Coral
         Reef Watch (2018). ......................................................................................................... 40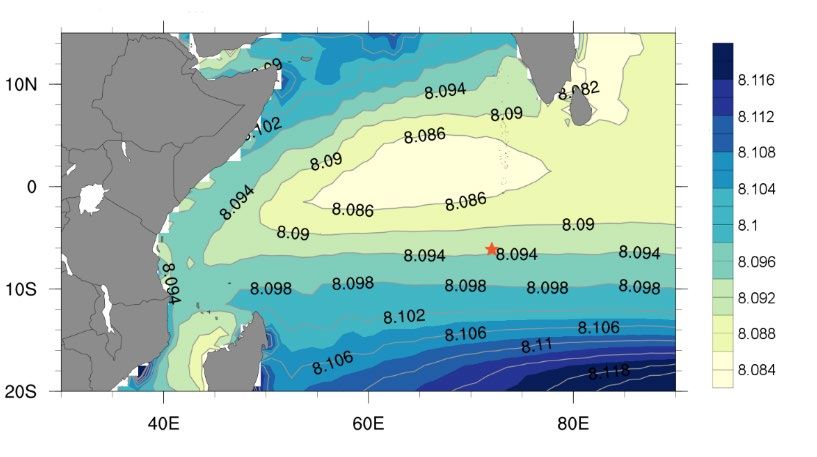
1. Executive summary
British Indian Ocean Territory (BIOT)

BIOT will become less suitable for corals due to future ocean acidification and warming sea
surface waters. By the end of the century and under high emissions scenario, pH will decrease
by more than 0.2 units and saturation of calcium carbonate minerals will become suboptimal for
coral calcification. These conditions will lead to mass coral bleaching and decalcification.

Past marine heatwaves and an increase in average sea surface temperature of more than 0.5°C
since the 1980s have caused substantial coral bleaching and mortality across BIOT, particularly
in shallow reefs.

Islands are suffering erosion due to an estimated sea level rise of more than 5 mm per year,
combined with the degradation of protective fringing reefs due to coral bleaching and mortality.

Protection and management activities in the BIOT Marine Protected Area (MPA), particularly the
limitation of direct human pressures such as fishing and anchoring and monitoring of specific
environmental indicators, could contribute to making corals more resilient to future climate
change impacts to an extent.

Pitcairn

Pitcairn Islands corals grow at unusual depths, below 30 m, where the water is cooler and they
are sheltered from warming surface temperatures, but there is high risk that future ocean
acidification conditions will prevent coral survival: by the end of the century and under high
emissions scenario, pH will decrease by almost 0.3 units and saturation of calcium carbonate
minerals will be too low to support calcification.

The remote location of Pitcairn corals, in terms of the long distance between the islands
themselves and even longer distance from other reefs, is a further challenge as it suggests
limited connectivity and low influx of coral larvae from other healthy reefs that could boost
recolonisation and recovery. Recruitment of juvenile corals in these reefs has yet to be assessed
but it is expected to be heavily reliant on self-seeding.

Sea level rise is projected to rise by 95 cm on average across the South Pacific by the end of the
21st Century. It is unclear whether the Pitcairn Islands will continue to adjust to this accelerating
sea level rise, particularly the low elevation coral islands of Henderson, Ducie and Oeno.

Some ocean and atmospheric processes such as the South Pacific Circulation Gyre may slow
down warming compared to the wider Pacific; however targeted research is needed to fully
understand these future changes.

1|Page
2. Introduction
2.1. Purpose of this document
This document aims to compile the latest scientific information available from observed and future
climate change literature covering the marine and coastal environments of the UK Overseas
Territories of the Pitcairn Islands and the British Indian Ocean Territory (BIOT). This report gathers
current understanding of the expected impacts on the coral reefs, as well as other key marine
species and habitats, and will help to inform potential management actions in support of the
designated Marine Protected Areas of these territories. A summary report card is also available.
The summary report card provides a synthesis of this document to inform policy, decision making
and conservation activities. This work has been funded by the UK Blue Belt Programme 1.

2.2. Background to this document
Warm-water coral species are projected to decline and local extinctions are expected in the coming
decades as climatic and non-climatic stressors are causing a rapid decline worldwide (IPCC
2014a). About one quarter of coral reefs have already died off with a further half impacted to
varying degrees in terms of loss of structural complexity and changes in species composition, and
only one quarter remain in reasonably good condition and retain optimal levels of ecosystem
function and diversity (IPCC 2014a). The composition of coral reefs in the future is expected to be
different to the present day (IPCC 2019), with loss of species from most sites globally by 2050 as a
consequence of global warming (IPCC 2014a). Reef-building or stony corals are keystone species
and have a disproportionately important role, because they are critical for the structure of the entire
ecological reef community, affecting many other organisms and helping to determine the types and
numbers of various other species in the reef. Therefore changes to the species composition of
coral communities can affect the ecological functioning of the reef and all the derived goods and
services that are vital to society and regional economies, such as fisheries, coastal protection and
tourism, and impact the wider marine areas beyond the reef (Fisher et al. 2015; IPCC 2014a;
Baker et al. 2008; Moberg and Folke 1999; Glynn 1993). Any detrimental impact to the corals could
result in a much wider impact to approximately 500 million people and to the associated ecosystem
services that depend on these habitats.

This report provides information on impacts of climate change on corals in BIOT and the Pitcairn
Islands, as well as likely impacts that can be expected over the course of the 21st Century, based
on most up-to-date Representative Concentration Pathways (RCP) climate model projections (Van
Vuuren et al. 2011). Where possible, projections used were based on either of the main
Representative Concentration Pathways (RCP): low (mitigation) emissions scenario (RCP2.6),
medium (stabilization) scenarios (RCP4.5/RCP6) and high (baseline) emission scenarios (RCP8.5;
Van Vuuren et al. 2011). RCP8.5 is also known as the ‘business-as-usual’ scenario as it assumes
that no, or very limited, mitigation will be put in place, while RCP2.6 is more aligned with the
mitigation commitments of the UNFCCC Paris Agreement. RCP2.6 and RCP8.5 are therefore
extreme scenarios, and it is expected that future emission scenarios will likely fall in between these

1   www.gov.uk/government/publications/the-blue-belt-programme

2|Page
projections. This report makes use of available information and focusses on key marine physico-
chemical drivers of climate change in ocean conditions by which organisms are influenced: sea
temperature, ocean acidification, sea level rise and extreme weather events, which provide context
specific to the unique marine species and habitats across these territories. The final sections of this
report discuss potential options in terms of management actions that could potentially enhance the
resilience of the coral reef ecosystems in BIOT and the Pitcairn Islands.

2.3. British Indian Ocean Territory (BIOT)
The British Indian Ocean Territory (BIOT) is an archipelago of 58 islands. It lies between 4°–8°S
and 70°–75°E, about 500 km south of the Maldives archipelago and about 1,800 km east of the
Seychelles (Sheppard et al. 2012). BIOT consists of five atolls, including the largest atoll in the
world: Great Chagos Bank, and many submerged atolls and banks. The islands cover an
aggregated land area of about 60 km2 (about half of which is the atoll Diego Garcia) with 698 km of
coastline. The terrain is flat, and most areas do not exceed 2 m in elevation. The BIOT Marine
Protected Area (MPA) covers the whole maritime zone and coastal waters (Figure 1) with an
approximate area of 640,000 km2 and was first proclaimed as a Fisheries Conservation and
Management Zone (FCMZ) in 1991.

Figure 1. The British Indian Ocean Territory Maritime Boundary and designated Marine Protected Area, which occupies
the entire Fisheries Conservation and Management Zone.

In 2003 this territory was further protected as an Environment Protection and Preservation Zone,
until in 2010 the entire FCMZ was declared as the no-take BIOT MPA 2 with the only exclusion of
the 3 nautical miles territorial waters around Diego Garcia. All commercial fishing and extractive

2   British Indian Ocean Territory (gov.io)

3|Page
activities are prohibited within the MPA, but recreational fishing by residents is however allowed.
Diego Garcia is the only inhabited island, and hosts a joint UK-US military base facility that
includes military personnel, contractors and BIOT Administration staff.

BIOT is home to a rich and diverse marine environment that makes it a unique and a prime
location for science and education programmes; scientific expeditions from a wide range of
disciplines have established BIOT as an observatory for undisturbed ecosystems (BIOTA 2018).
The BIOT MPA includes an unusually large expanse of sublittoral substrate in the photic zone,
around 60,000 km², that consists of shallow limestone covered with live coral, rubble, and
extensive seagrass beds (Sheppard et al. 2012). The archipelago is an important stepping-stone
for many species (Sheppard and Sheppard 2019). It serves as an important breeding ground for
sharks, dolphins, and sea turtles (Hays et al. 2020).

Coral cover measurements since the 1970s have shown some episodes of coral decline
associated with several sea warming events. Some lagoon reefs in the atolls have been less
affected than ocean facing reefs though this is patchy, with some areas appearing heavily
bleached while others show high percentage of live coral cover (above 50%). Most of the shallow
areas are dominated by communities of seagrass or sponges, or are covered by limestone rubble
rather than coral (Sheppard and Sheppard 2019).

2.4. Pitcairn Islands
The Pitcairn Islands include Pitcairn, Oeno, Henderson, and Ducie Island, with an aggregated land
area of only 49 km2 (Irving and Dawson, 2012). They are part of an outcrop situated along the
Foundation Seamount chain, running west northwest to east southeast through the Central South
Pacific between 20°–30°S and 120°–135°W (Figure 2). Pitcairn Island is of volcanic origin, steep
and rocky, and exposed to large ocean swells (Avagliano et al. 2016) and it is also the only
inhabited island with 52 permanent residents as of January 2020 3. Henderson Island is formed
from a raised coral reef, and Oeno and Ducie are low coral atolls (Robinson et al. 2017; Spencer
1995). The Pitcairn Islands Marine Protected Area 4 established in September 2016, covers the
entire Pitcairn Exclusive Economic Zone (EEZ), 841,910 km2, and is a no-take MPA (Figure 2).

The Coastal Conservation Areas (CCAs) consist of the territorial waters around Pitcairn,
Henderson, Ducie and Oeno; the CCA around Pitcairn Island also includes the 2 nautical miles of
the area known as “40-mile reef” on the edge of Adam’s Seamount, and the transit zone between
the island and 40-mile reef, which explains the different elongated shape of the CCA around
Pitcairn compared to the other islands (Figure 2). Subsistence fishing is allowed within these
areas 5. The Pitcairn Islands are considered to be one of the tropical reef regions least impacted by
human activity in the Pacific, but diversity of benthic communities and fish around these islands is
not as high as expected due to their isolation – with Oeno Island scoring the highest amongst them
in terms of fish assemblages diversity index (Shannon-Weaver Diversity Index 2.3; Friedlander et
al. 2014).

3 Pitcairn Miscellany, January 2020 [www.miscellany.pn/]
4 http://www.mpatlas.org/mpa/sites/9178/
5 Revised Laws of Pitcairn, Henderson, Ducie and Oeno Islands, 2017 Rev. Ed. - Volume 2 (government.pn)

4|Page
Figure 2. The Pitcairn Maritime Boundary and designated Marine Protected Area, which occupies the entire Exclusive
Economic Zone. The Marine Protected Area is a no-take area, but subsistence fishing is allowed within the Coastal
Conservation Areas.

Coral reefs are present around all the Pitcairn Islands, with Ducie having the highest coral cover,
56%, and Pitcairn the lowest, 5% (Friedlander et al. 2014). Unique fish assemblages are found in
these islands due to their isolation (Friedlander et al. 2014). Macroalgae are abundant around
Pitcairn Island, and corals are predominantly absent above 10 m water depth, possibly due to the
combined impact of wave action and sediment run off (Duffy 2014; Friedlander et al. 2014). Below
10 m coral reefs are present and occur deeper than usual (below 30 m depth), due to exceptional
water clarity (Duffy 2014; Friedlander et al. 2014; Irving and Dawson 2013).

2.5. Overview of marine climate change in the Indian
    and Pacific Ocean regions

2.5.1. Sea surface temperature change
To understand the potential impact of future climate changes, it is necessary to consider natural
climate variability driven by the interaction of atmospheric and oceanic systems, as sea surface
temperature (SST) conditions in the Pacific and Indian Oceans are strongly affected by natural
interannual variation which drives warmer and cooler conditions in these areas. The El
Niño/Southern Oscillation (ENSO) is defined by a bimodal fluctuation in SST and air pressure
across the eastern equatorial Pacific (NOAA, 2020), typically with a 2- to 7-year cycle. El Niño
events are characterized by positive SST anomalies, and La Niña events exhibit negative SST
anomalies (Figure 3; Santoso and National Center for Atmospheric Research Staff 2020; Stuecker
et al. 2017).

5|Page
Figure 3. SST anomalies during example years of El Niño (top) and La Niña events (bottom). Figure copied with permission from Santoso and National Center for Atmospheric Research Staff (2020). During La Niña conditions, changes in air pressure encourage circulation of air across the Pacific that draws cooler waters towards the surface in the east of the Pacific (Stuecker et al. 2017). During El Niño conditions, this pressure difference weakens, and warm surface water builds to the east of the Pacific. As well as SST, ENSO also influences cyclonic activity, waves, and ocean acidification in the Pacific (Stuecker et al. 2017). It is unclear how the strength and frequency of El Niño and La Niña will change in the future with climate change, but ENSO is expected to remain the dominant mode of interannual climate variation in the region (Stuecker et al. 2017; IPCC 2013). Interannual variation in the SST of the Indian Ocean is driven by the Indian Ocean Dipole (IOD). Positive IOD conditions tend to coincide with a warmer than normal western tropical Indian Ocean, while a negative IOD phase coincides with a cooler than normal western tropical Indian Ocean (Johnson 2020). The IOD is partially linked to the ENSO system. El Niño conditions initiate a positive IOD phase, associated with warm waters in the western tropical Indian Ocean (Johnson 2020). However, the exact amount that the ENSO system drives IOD is unknown, as the phases do not always occur at the same time. As with ENSO, it is unclear exactly how climate change will affect the IOD (Johnson 2020), but there is evidence that extreme positive events (and so warmer western tropical Indian Ocean waters) may occur more frequently in the future (Cai et al. 2014). From the 1850–1900 period until 1986–2005, SST has risen by 0.63°C on average, with marine heatwaves increasing in frequency and intensity since the 1980s (IPCC 2019). Marine heatwaves have been defined as warm events that last for five or more days, during which mean or maximum temperature anomalies are at least 3–5°C above normal and warmer than the 90th percentile based on a 30-year historical baseline period (Hobday et al. 2016). The oceans are expected to continue to warm throughout the 21st Century with more heatwaves that are more intense, last longer and cover larger areas (Benthuysen et al. 2020; Jacox et al. 2020; Laufkötter et al. 2020; Oliver et al. 2020; IPCC 2019). By the end of the 21st Century, SST is projected to rise by a further 6|Page
4°C on average under a high greenhouse gas emissions scenario (IPCC 2019). By the end of
century, marine heatwaves will increase in frequency, duration, spatial extent and intensity
throughout the ocean under future global warming, and on average the probability of marine
heatwave occurring each year will be 20 times or higher than currently (Collins 2019). Some
authors are even pointing to a further acceleration of these changes already taking place (Hu et al.
2020; Shepherd et al. 2020; Cheng et al. 2019; WMO 2019).

Reef recovery relies on new recruitment as well as growth and propagation of surviving colonies,
and full recovery of mature coral assemblages can take 10–15 years for the fastest growing
species and even longer for slower-growing species; therefore, if marine heatwave events intense
enough to trigger mass coral bleaching begin to reoccur with greater frequency it could be
catastrophic for many reefs and prompt an irreversible collapse of the world’s tropical reefs as we
know them (Sheppard 2003), even if some thermal tolerant species or colonies are able to adapt.

2.5.2. Ocean acidification and carbon chemistry
Since pre-industrial times atmospheric CO2 has increased from approximately 277 parts per million
(ppm) to 409.8 ± 0.1 ppm in 2018 (Blunden and Arndt 2020), with oceans acting as sinks for
atmospheric CO2 and absorbing 20–30% of global emissions (Bindoff et al. 2019; Friedlingstein et
al. 2019; Gruber et al. 2019). Absorbed CO2 reacts with seawater and causes a decrease in pH,
referred to as ocean acidification. Organism responses to ocean acidification vary depending on
their life history traits with heavily calcified organisms such as corals, molluscs and echinoderms
being most negatively impacted (Birchenough et al. 2015). This is because besides calcification,
many physiological processes require pH to be tightly controlled including photosynthesis,
neuronal processes, growth, reproduction, and survival (Turk et al. 2019; Henson et al. 2017;
Marshall et al. 2017; Sutton et al. 2016, 2017; Keller et al. 2014; Pörtner et al. 2014; Kroeker et al.
2013; Wittman and Pörtner 2013; Honisch et al. 2012), but there are still gaps in our current
understanding of the impacts of acidification on marine systems (Doo et al. 2020).

Calcifying organisms secrete calcium carbonate-based (CaCO3) minerals, which include calcite
and aragonite. Shells and skeletons of unprotected CaCO3 minerals begin to dissolve when the
saturation level (denoted as Ω) of aragonite (Ωar) or calcite (Ωca) drops below Ω = 1, noting that the
locations of this saturation horizon where Ω = 1 in the water column differ for these two carbonate
minerals (Birchenough et al. 2017; Feely et al. 2009). Thus, the Ω = 1 horizon is a useful indicator
but not a strict criterion for biomineralization and dissolution (Feely et al. 2009). The saturation
states of carbonate minerals naturally decrease with depth as total dissolved CO2 increases
because of biological respiration and cold temperatures in deep seawater (Feely et al. 2009). In
addition, and while perhaps less relevant at large scales, Ω and pH can also vary at local scales
depending on the habitat mosaic present (Liu et al. 2020; Bergstrom et al. 2019; Cyronak et al.
2018a; Pacella et al. 2018) and it can be affected by biological processes like photosynthesis
(Fabricius et al. 2020; Hurd et al. 2018).

The trend of global decline in ocean pH has been estimated to be between 0.017–0.027 pH units
per decade, with variability between ocean basins as well as seasonal changes in seawater pH
(Bindoff et al. 2019; Landschützer et al. 2018; Wu et al. 2018; Lauvset et al. 2015). Ocean pH and
aragonite saturation state are expected to continue decreasing globally (Bindoff et al. 2019) with a
likely significant lag between emissions and oceanic uptake of CO2 (Laruelle et al. 2018). By the
end of the 21st Century, surface ocean pH will decrease by 0.036–0.042 pH units under a low

7|Page
emissions scenario or 0.287–0.291 pH units under a high emissions scenario (Kwiatkowski et al.
2020; Bindoff et al. 2019).

8|Page
Figure 4. (Top and middle rows) CCSM3-modelled decadal mean Ωar (left) and Ωca (right) at the sea surface, centred around the years 1875, 1995, 2050, and 2095 (bottom row)
GLODAP-based Ωar/Ωca at the sea surface, nominally for 1995; the GLODAP-1995 plot shows the difference between the GLODAP-based and CCSM-based 1995 fields. Note the
different range of the difference plots. Deep coral reefs are indicated by darker grey dots; shallow-water coral reefs are indicated with lighter grey dots. White areas indicate regions
with no data. GLODAP denotes carbon system measurements collected from 1990 through 1998, during CO2 survey oceanic cruises. Figure copied with permission from Feely et al.
(2009).

9|Page
For most open-ocean surface waters, model projections suggest that by 2050 aragonite
undersaturation will intensify and spread from the poles, with all of the Southern Ocean and North
Pacific expected to be undersaturated by the end of the century (Figure 4; see also Feely et al.
2009). With respect to calcite, most surface waters across the globe will see a substantial decline
compared to present levels albeit still at a saturated state with the exception of the Arctic, by the
end of the century (Figure 4; see also Feely et al. 2009).

On the other hand, increased levels of dissolved CO2 can also benefit certain photosynthesising
organisms, including macroalgae, seagrasses and diatoms (Brodie and De Ramon N’Yeurt 2018;
Brodie et al. 2014; Kroeker et al. 2013).

2.5.3. Sea level rise
The dominant drivers of sea level rise are thermal expansion of the ocean, and meltwater loss from
land-based ice sheets and glaciers, but regional differences in the relative contribution of each
component of sea level change introduce considerable variability and uncertainty particularly in the
case of long-term estimations (Nauels et al. 2019; Vitousek et al. 2017; Church et al. 2013).

Since the Intergovernmental Panel for Climate Change Fifth Assessment Report (IPCC AR5),
recent studies have attributed chronic coastal flooding to higher mean sea levels and extreme
weather events (Oppenheimer et al. 2019; IPCC 2013). Latest IPCC projections are robust up to
2050 and indicate that global mean sea level will raise 0.24 m (0.17–0.32 m, likely range) under
RCP2.6 and 0.32 m (0.23–0.40 m, likely range) under RCP8.5 (medium confidence; Oppenheimer
et al. 2019). The combined effect of mean and extreme sea levels results in events which are rare
in the historical context (return period of 100 years or larger; probability
Figure 5. Projections of global sea level rise for the three RCPs, calculated based on a global set of local sea level
projections. Solid line = median, dashed = 5th–95th percentile, dotted = 0.5th–99.5th percentiles. Copied with permission
from Kopp et al. (2014).

Long-term sea level and tidal gauge records are still very limited in either the Indian Ocean and the
South Pacific, making it challenging to estimate trends of sea level change with confidence
(Chambers et al. 2012).

2.5.4. Extreme weather events
Changes in ocean wave conditions are governed by changes in the major wind systems, especially
in the main areas affected by tropical and extra-tropical storms (Church et al. 2013). Unusually
large deep ocean swells, generated by extratropical cyclones in the mid and high latitudes, can
also cause considerable damage to small islands thousands of kilometres away in the tropics
(Nurse et al. 2014). Impacts include coastal flooding, damage to coral reefs and severe beach
erosion. As well as the impacts from the direct landfall of severe storms or cyclones, the potential
importance of inter-regional transboundary processes like swells to distant, low-lying coasts
warrants further research, particularly if the climatology of swells is modified under future climate
change (Shope et al. 2016; Nurse et al. 2014; Vassie et al. 2004).

Tropical cyclones exacerbate extreme sea levels by intensifying wind-waves and storm surges
(Church et al. 2013). However, the influence of observed climate change on past tropical cyclone
frequency and intensity is still uncertain. An increase in tropical cyclone activity has been detected
in recent years, but this apparent trend could be the result of changes in observation methods over
time (IPCC 2012; Peduzzi et al. 2012; Knutson et al. 2010).

The Fifth Assessment Report (AR5) of the IPCC concluded that whilst long-term increases in
tropical cyclone activity have been found globally, there was low confidence in any attribution to
particular causes, as natural variability prevented the detection of clear climate change signals
(Collins et al. 2019; IPCC 2013). Since the AR5, there have been further downscaling studies of
tropical cyclones and higher resolution ocean circulation experiments, and the latest findings
generally support those from previous AR5 projections: a general increase in intensity of the most
intense tropical cyclones and a decline in tropical cyclone frequency overall (Collins et al. 2019).

The future influence of climate change on the frequency and intensity of tropical cyclones is not yet
fully understood (Chand et al. 2020; Howes et al. 2018; CSIRO et al. 2015; Christensen et al.

11 | P a g e
2013). Global 21st Century climate projections indicate that the frequency of tropical cyclones is
likely to either remain roughly constant or decrease, whilst their mean intensity is likely to increase,
together with cyclone-related rainfall (Walsh et al. 2019; Peduzzi et al. 2012). There is limited
confidence however in the geographical details of regional projections of future tropical cyclone
track and occurrence (Knutson et al. 2019; Walsh et al. 2019; Ramsay et al. 2018; Nakamura et al.
2017). Global climate models are unable to realistically simulate maximum wind speeds and other
key tropical cyclone features even after downscaling (Strazzo et al. 2015). Further research is
needed to improve the resolution of meteorological data to better model the contribution of tropical
cyclones to extreme sea level events, to better understand these events, validate and ground-truth
computer models and provide robust, regional projections (Wahl et al. 2017; Muis et al. 2016).

Modelling studies of global wave height under future emission scenarios for the end of the 21st
Century suggests increased probability of extreme waves in the Southern and Indian Ocean, and
to a lesser extent the Pacific (Church et al. 2013; Dobrynin et al. 2012). These projections of global
wind-wave climate carry low confidence due to their considerable regional and seasonal variability
(Nurse et al. 2014; Wang et al. 2014). However the projected increase of extreme wave activity in
the Southern Ocean could be of concern for both BIOT and Pitcairn due to their exposure to open
ocean conditions; for example evidence of damage by cold intrusion and waves has been found in
Ducie Island (Dawson and Zhang, 2020; Irving and Dawson 2013; Rehder and Randall 1975),
which could have been caused by long distance waves originated in southern latitudes. Such
waves are known to propagate as deep-ocean swells and northwards into adjoining basins (Hemer
et al. 2013) and can have devastating impacts on coastal margins and shallow coral reefs, for
example causing displacement of sediments and boulders, coastal flooding and damage to
infrastructure and buildings, with implications for biodiversity as well as communities and
livelihoods (Nurse et al. 2014).

2.6. Overview of climate change impacts on corals

2.6.1. Impacts from bleaching
According to the UNEP coral bleaching futures report (2017), in the central Indian Ocean Reef
Area, the average projected timing of the onset of annual severe bleaching events under a high
emissions scenario is 2046, with the earliest projected timing taking place in BIOT by 2041. This
implies that severe bleaching events are expected to occur on an annual basis in that region by
2041 (Van Hooidonk et al. 2016). BIOT corals are already at the upper limits of their thermal
tolerance, and it is doubtful they will persist under projected future SST conditions. Based on
present-day tolerance limits and unless these corals are able to adapt physiologically, the BIOT
region will become largely unsuitable for corals before the end of the 21st Century (Couce et al.
2013). In contrast, the onset of regular severe bleaching in the Pitcairn Islands is projected to be
delayed until the second half of the 21st Century, due to their southerly latitude and an expected
slower SST warming rate in that region of the Pacific Ocean implying that future SST conditions
will likely remain optimal for coral growth for longer compared to other tropical reef areas exposed
to higher SST and faster warming rates (Jones et al. 2019; Van Hooidonk et al. 2016; Couce et al.
2013; Irving and Dawson 2013).

Bleaching is the outcome of a complex biological and ecological response of corals designed to
protect the coral animal against harmful products, such as reactive oxygen and or nitrogen

12 | P a g e
(Suggett and Smith, 2020; Obura 2009; Coles and Jokiel 1978). A large body of evidence has
demonstrated that perturbations to environmental factors underpinning optimum metabolic
functioning can result in bleaching; notably, temperature, light, salinity as well as inorganic
nutrients (see Suggett and Smith, 2020; and references therein). The rate of photosynthesis
increases with temperature and light, hence the corals expel excess zooxanthellae to reduce the
overall rate of photosynthesis during warmer conditions (Baker 2001). Seasonal paling of corals
can occur naturally during summer months with no obvious harm to coral colonies (Obura 2009;
Baker et al. 2008). However, during extreme temperatures corals lose too many of their
zooxanthellae and can no longer obtain food from photosynthesis and eventually die. Without their
symbiotic algae, the tissue becomes transparent, and colonies appear white, or bleached, due to
their white skeletons made of calcium carbonate.

Bleaching of coral reefs is becoming more frequent and severe across the world due to climate
change (Hughes et al. 2017; Heron et al. 2016). However, it is also known that not all corals will
necessarily die during a bleaching event, as some will have lower exposure to the thermal stress
and others may be less sensitive to these events (Obura 2005; West and Salm 2003). Factors
such as location of reef, cloud cover, ocean-facing versus lagoonal (Cowburn et al. 2019; Muir et
al. 2017; Pandolfi 2015; Ateweberhan et al. 2013; Obura and Mangubhai 2011), coral morphology
(Ateweberhan et al. 2013; McClanahan et al. 2007; Loya et al. 2001), previous bleaching
experience and zooxanthellae type (Baker et al. 2004; Brown et al. 2002), as well as the degree of
autotrophy versus heterotrophy – with branching corals tending to be more autotrophic than
massive corals – (Conti-Jerpe et al. 2020; Ferrier-Pagès et al. 2011), appear to determine the
coral’s sensitivity to thermal stress. For example, autotrophic corals appear to have an advantage
in ambient temperature and high irradiance environments, whereas heterotrophic corals appear
more tolerant of increasing temperatures; and similarly, branching corals with thinner tissues
bleach earlier and more extensively compared to massive or encrusting coral species with thicker
tissues (Conti-Jerpe et al. 2020; Hughes et al. 2018; Woolridge 2014; Hughes and Grottoli 2013;
Anthony et al. 2009; Grottoli et al. 2006; Obura 2001). The most likely scenario is that tropical coral
reefs will continue to degrade globally over the 21st Century until climate change stabilizes and
surviving populations reorganize into heat-tolerant reef assemblages, as the effect of the 2016
global bleaching event demonstrated by triggering an initial transition in many reef regions (Hughes
et al. 2018).

There is an extensive body of knowledge about coral bleaching and potential intervention and
management options (Mcleod et al. 2019; Van Oppen et al. 2017) although some of those options
are better explored than others. Some interventions such as selective breeding or genetic
engineering require the use of complex technologies, and further research and understanding of
the genetic, physiological, and ecological processes involved are needed, and therefore need to go
hand in hand with continuing and potentially increasing efforts in conventional management
(Anthony et al. 2017; Anthony et al. 2015).

2.6.2. Impacts from changes in carbon chemistry and ocean acidification
As aragonite depositing organisms, corals are more vulnerable to the effects of ocean acidification
(Pandolfi et al. 2011; Anthony et al. 2008) than calcite depositing organisms and non-calcifying
forms (Kroeker et al. 2013). Aragonite is more soluble than calcite, however recent studies suggest
that this does not necessarily determine an organism’s vulnerability to ocean acidification (Doney
et al. 2020).

13 | P a g e
Evidence from experimental studies simulating a range of pH levels suggests that corals are highly
sensitive to ocean acidification, with decreasing saturation state resulting in impaired calcification
(Langdon and Atkinson 2005; Langdon et al. 2000) and increased dissolution (Andersson et al.
2007). In turn, these effects trigger stress-response mechanisms that affect the rates of tissue
repair, feeding rate, reproduction, and early life-stage survival (Enochs et al. 2015a; D’Angelo et al.
2012; Kroeker et al. 2010; Fabry 2008). Field studies using pH gradients that mimic future
conditions have largely supported these assumptions, finding declines in coral skeletal density,
species composition, colony size, and net calcification, and increases in bioerosion and dissolution
(Dove et al. 2020; Eyre et al. 2018; Mollica et al. 2018; Enochs et al. 2015b; Fabricius et al. 2011;
Shamberger et al. 2011; Silverman et al. 2007).

Many knowledge gaps still remain but as our understanding of the subject progresses, it is clear
that the impacts are less straightforward than first thought and it is clear that they vary
geographically as well as between species (Cyronak et al. 2018b; Shaw et al. 2013; Fabricius et al.
2011). Research is attempting to disentangle the impacts of ocean acidification on coral
calcification as it is a complex process that occurs in several stages over which the organism
maintains a degree of control (Mollica et al. 2018). Like many calcifying organisms, corals can
modulate the pH of fluids during calcification (Venn et al. 2011). This may confound observation of
ocean acidification effects in situ and it has been suggested that corals could buffer some of the
impacts of decreased pH, but at an energetic cost. Despite their ability to elevate the pH of
calcifying fluids, results from experimental observations demonstrate that seawater pH still affects
the corals (Comeau et al. 2017). There is also evidence that ocean acidification induces a loss of
skeletal density rather than slowing down growth (Guo et al. 2020; Mollica et al. 2018), explaining
how some corals have been observed to sustain growth rate under acidic conditions. Some
observations of manipulation experiments and of corals in naturally low pH reefs appear
counterintuitive, but consistent with a two-phase model of coral growth that involves two
fundamentally different processes: extension or upward growth and densification or lateral
thickening (Mollica et al. 2018). Skeletal density is directly sensitive to changes in seawater
carbonate ion concentration and thus, to ocean acidification, whereas extension is not (Mollica et
al. 2018).

There is high confidence that ocean acidification will continue to progress to the end of the century
and beyond, with potential severe effects for corals. Globally, the species composition of coral
reefs and their associated communities are projected to change as a result of future interactions of
multiple climatic and non-climatic hazards (Bindoff et al. 2019), with ocean acidification very likely
exacerbating the effects of warming sea temperatures (Hoegh-Guldberg et al. 2017). The response
of corals to ocean acidification will be species-specific: some warm water corals can continue to
calcify at saturation states below one, though at an energetic cost (Pörtner et al. 2014). Despite
species-specific responses, there is high confidence that, globally, reefs will experience reduced
rates of calcification (Albright et al. 2018), increased dissolution (Andersson et al. 2007); shifts in
species composition, competition and functioning (Johnston et al. 2020; Edmunds et al. 2019;
Agostini et al. 2018; Enochs et al. 2015b; Fabricius et al. 2011), increased erosion (Enochs et al.
2016; Enochs et al. 2015a), reduced recruitment (Fabricius et al. 2017), and loss of skeletal
density (Mollica et al. 2018). In spite of the evidence of the relative adaptive capacity of corals,
their ability to overcome ocean acidification remains uncertain (Langdon et al. 2000).

It is difficult to isolate and identify ocean acidification effects on corals and coral reefs as seawater
pH and net reef calcification are highly variable. Observed changes in seawater pH are still within

14 | P a g e
You can also read