Coral Bleaching Alert System - Technical Document - Indian National Centre for Ocean Information Services (INCOIS) Hyderabad 2011
←
→
Page content transcription
If your browser does not render page correctly, please read the page content below
Coral Bleaching Alert System

                     Technical Document

Indian National Centre for Ocean Information Services (INCOIS)
                           Hyderabad

                            2011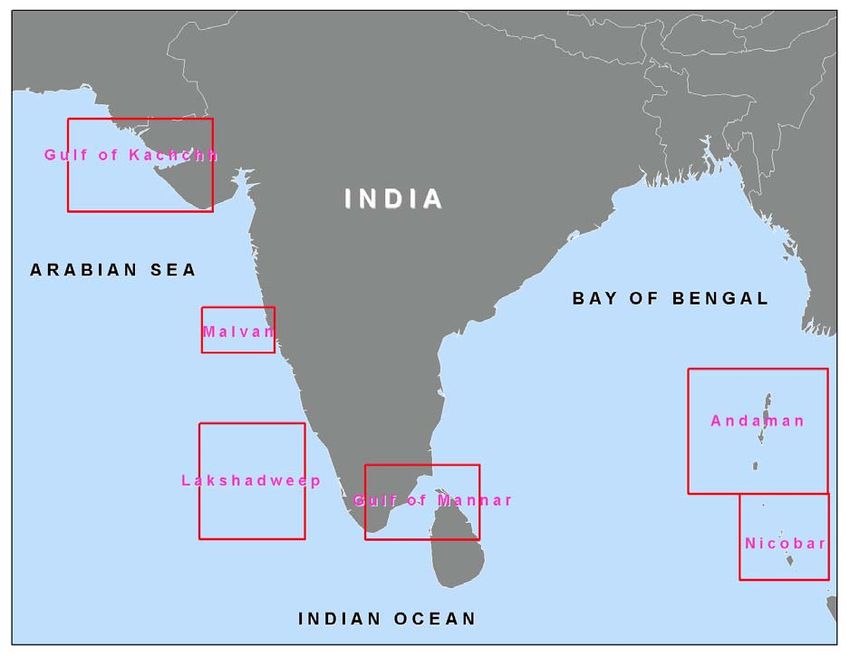
Contents
                                                                                                                               Page No.

1.     Introduction......................................................................................................................1
1.     Objective ...........................................................................................................................2
2.     Study Area ........................................................................................................................2
3.     Data Used..........................................................................................................................3
4.     Methods.............................................................................................................................3
     4.1      Estimation of Monthly Maximum Mean of SST Climatology .............................4
     4.2      HotSpot Analysis......................................................................................................5
     4.3      Calculation of Degree of Heating Week.................................................................5
     4.4      Assessment of Thermal Stress Levels.....................................................................6
     4.5      Warning status .........................................................................................................7
     4.6      Time series graphs ...................................................................................................7
References.................................................................................................................................8
1. Introduction
The coral reefs are massive biological set up in the coastal seas and have taken several
millenniums to attain current form. However, during last decade, worldwide coral reef
ecosystems have been degrading largely that alarming the threat on the vital coral
ecosystems. Coral bleaching has been one of the significant contributors to the increased
deterioration of reef health.
Coral bleaching is a phenomenon that takes place when the symbiotic relationship between
algae (zooxanthellae) and their host corals breaks down under certain environmental stresses.
This result in the host expels their zooxanthellae. In the absence of symbiotic algae, the corals
expose their white underlying calcium carbonate coral skeleton and the affected coral colony
becomes pale in color. Coral bleaching can be activated and persisted during varied
environmental stresses. It was observed a massive coral bleaching world wide due to
increased anomalous warm waters during recent years. Coral bleaching can takes place even
1-2°C increase in ambient water temperature during summer months (Berkelmans and Willis,
1999; Reaser et al., 2000). Prolonged partial/total bleaching events on coral environs can
cause the coral deaths. Stern bleaching events have striking long-term ecological and social
impacts, which includes extinct of reef-building corals, changes in benthic habitat and in
some cases even changes in fish populations. It can take several years for severely bleached
reefs to recover even favorable conditions prevails thereafter the event.
There is a strong need for improved understanding, monitoring, and prediction of coral
bleaching. The application of satellite remote sensing is the important tools to provide
synoptic views of the global oceans in near-real-time and the ability to monitor global reef
areas. Therefore to provide early warnings on the coral bleaching, the nocturnal Sea Surface
Temperature (SST) is an important parameter to assess the thermal conditions and intensity
1of the bleaching. There are several remote sensing satellites revolving around the globe have
an ability to provide SST information during day and night routinely. This facilitates in
development of the coral reef bleaching warning system to generate early warning
advisories/bulletins in near real-time. Earlier studies (Strong et al. 2004; Liu et al. 2005;
Goreau and Hayes 1994 and Montgomery and Strong 1995) were reflecting the impact of
thermal stress on coral reef, their monitoring and assessment over global synoptic view.
2. Objective
The objective of current study is to provide coral bleaching warning based on the thermal
stress. The parameters SST climatology, bleaching HotSpot (HS) and Degree of Heating
Week (DHW) were used for the study. These parameters generated using SST data with 5X5
km grid resolution retrieved from Advanced Very High Resolution Radiometer (AVHRR)
sensor on-board National Oceanic and Atmospheric Administration (NOAA) satellites.
3. Study Area
The bleaching alerts/warnings were generated for the Indian coral environs (Figure 1). The
individual geographic areas were selected based on the coral environs. These selected areas
are coral environs from Andaman, Nicobar, Lakshadweep, Gulf of Kachchh (GOK), Gulf of
Mannar (GOM) and Malvan.
2Fig. 1 Map showing the areas of the coral environs of India
4. Data Used
Sea Surface Temperature (SST) data from NOAA, AVHRR or data from the GHRSST was
used in the current study.
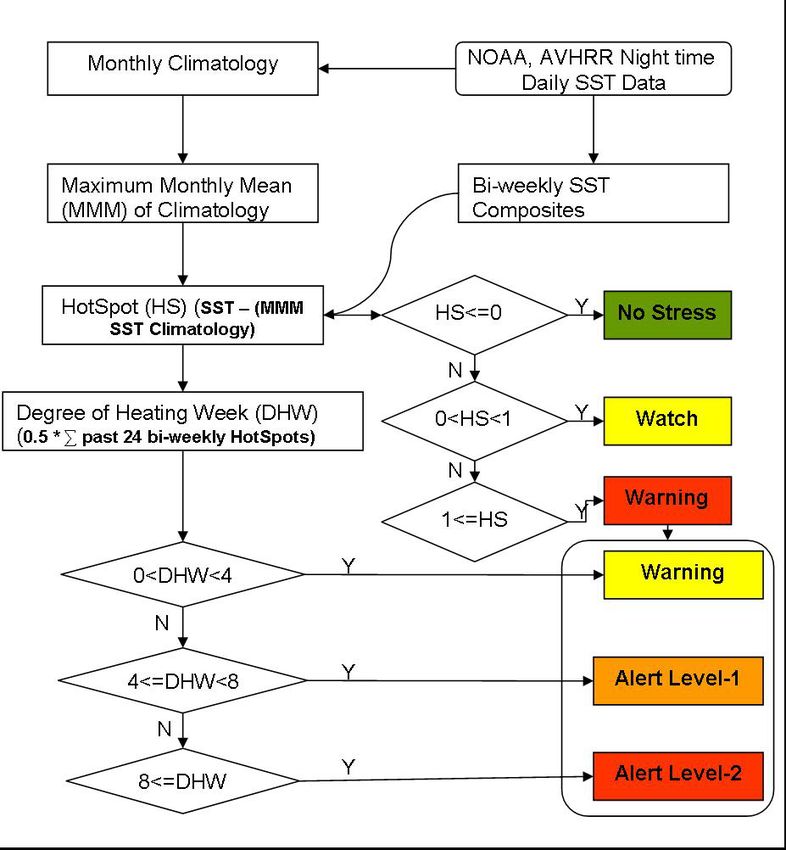
5. Methods
The calculation of thermal stress similar to NOAA coral reef watch (URL:
coralreefwatch.nooa.gov). According to Coral Reef Watch (CRW) the scheme of the coral
reef bleaching warning levels presented in flow-chart (Fig. 2).
3Fig. 2 Flow Chart depicting the methodology and the decision criteria for the coral bleaching status
5.1 Estimation of Monthly Maximum Mean of SST Climatology
The estimation of MMM of SST climatology using night time SST data retrieved using
NOAA, AVHRR. The night time images are used because, to eliminate the effect of solar
glare and reduce the variation in SST caused by the heating during day time. The daily night
time SST data were used to generate monthly mean composites. Monthly SST climatology
was calculated and Maximum Monthly Mean is defined as the warmest monthly mean value
for each pixel around the area.
45.2 Coral Bleaching HotSpot (HS) Analysis
Corals are vulnerable to bleaching when the SST exceeds the temperatures they would
normally experience in the hottest month. This reveal in the coral bleaching HS product,
which highlights regions where the SST is currently warmer than the highest MMM of SST.
The HS value lesser then or equal to zero were categorized as “No Stress” condition, the HS
value with in the range of 0 to 1°C it categorized as “watch” and values above 1.0°C was a
threshold for thermal stress leading to coral bleaching updated twice-weekly (Fig. 2).
Coral bleaching HS is a measure of the occurrence of thermal stress approaching conducive
to coral bleaching for a location. The HS anomaly is based on the climatological mean SST
of the hottest month (Liu et al., 2003; Liu et al., 2005; Skirving, 2006). The calculation of
MMM SST climatology is simply the highest of the monthly mean SST climatology showed
that temperatures exceeding 1°C above the usual summertime maximum are sufficient to
cause stress on corals. Based on this study, MMM SST climatology was derived as a
threshold for monitoring coral bleaching. The value of HS gives the difference between the
measured near-real time SST and the MMM SST climatology as given in equation1.
HotSpot (°C) = SST – (MMM SST Climatology) …… (1)
Only positive values are derived as the HS is designed to depict the incidence and distribution
of thermal stress conducive to coral bleaching.
5.3 Calculation of Degree of Heating Week (DHW)
It was observed to be cause coral bleaching if the thermal stress persists for the prolonged
duration. The DHW product that sums up HotSpots greater than 1°C recorded over past 12
weeks, this showing stressful condition prevails in corals environs for the previous three
months. It is a cumulative measurement of the intensity and duration of thermal stress is
expressed in the unit °C-weeks. The areas recorded DHWs up to 4°C-weeks depicts
5“Warning” status which will cause stress on corals. DHWs 4-8°C-weeks depicts the “Alert
Level-1” and these have been shown to cause significant coral bleaching. The DHWs above
8°C-weeks depict the “Alert Level-2” and this can cause widespread bleaching (Fig. 2).
While the Coral Bleaching HotSpot provides an instantaneous measure of the thermal stress
conducive to coral bleaching, there is evidence that corals are sensitive to an accumulation of
thermal stress over time. In order to monitor this cumulative effect, a thermal stress index
termed as Coral Bleaching Degree Heating Week (DHW) was developed by Liu et al., 2003;
Liu et al., 2005. Glynn and D'Croz (1990) reported that temperatures exceeding 1°C above
the usual summer time maximum are sufficient to cause stress on corals. This is commonly
known as the temperature threshold for coral bleaching.
A half-week approach is used because near-real-time coral bleaching monitoring products are
updated twice-weekly. With this approach, the DHWs are accumulated based on twice-
weekly HotSpots using the following equation 2.
DHWs (°C-week) = 0.5 * ∑ preceding 24 bi-weekly HotSpots ...... (2)
HS values more than or equal to 1.0°C-week required to be accumulated for the calculation of
the DHW.
5.4 Assessment of Thermal Stress Levels
The coral bleaching warning status was estimated based on the thermal stress levels using the
threshold HotSpot and DHW values (Fig. 2). The warning status categories “No Stress” and
“Watch” were estimated using only HotSpot values zero or less and more than zero
respectively. The categories Warning, Alert Level1 and Alert Level2 were estimated based on
both HotSpot and DHW. The warning status will be assessed as “Warning” when the
conditions of HotSpot => 1°C and 0satisfied. Where as “Alert Level-2” was assessed when conditions of HotSpot => 1°C and
DHW >=8°C-week was satisfied. A DHW accumulation of 4°C-weeks is triggers a
significant bleaching which is Alert Level-1 and bleaching is expected at the site within a few
weeks. An accumulation of 8°C-weeks triggers a strong bleaching with warning status Alert
Level-2 causes widespread bleaching with likely coral mortality.
5.5 Warning status
The warning status has been assessed based on the criteria mentioned in the following table 1
Table 1. Criteria of the coral bleaching warning/alert
HotSpot (oC) Degree of Heating Weeks(oC-week) Alert Status
HSReferences
Berkelmans R, Willis BL (1999) Seasonal and local spatial patterns in the upper thermal limits of corals on the
inshore Central Great Barrier Reef. Coral Reefs 18:219-228.
Glynn, PW, D'Croz L (1990) Experimental evidence for high temperature stress as the cause of El Nino
coincident coral mortality. Coral Reefs 8:181-191.
Goreau TJ, Hayes R (1994) Coral Bleaching and Ocean "Hot Spots”. Ambio 23:176-180.
Liu G, Strong AE, Skirving W, Arzayus LF (2005) Overview of NOAA coral reef watch program's near-real
time satellite global coral bleaching monitoring activities. Proc 10th Int Coral Reef Symp, Okinawa, Japan,
2004. 1:1783-1793.
Liu G, Strong AE, Skirving W (2003) Remote sensing of sea surface temperature during 2002 Barrier Reef coral
bleaching. EOS 84(15):137-144.
Montgomery RS and Strong AE (1995) Coral bleaching threatens ocean, life, EOS, 75, 145- 147.
Reaser JK, Pomerance R, Thomas PO (2000) Coral bleaching and global climate change: Scientific findings and
policy recommendations, Conservation Biology, 14, 1500-1511.
Skirving WJ, Strong AE, Liu G, Liu C, Arzayus F, Sapper J, Bayler E (2006) Extreme events and perturbations
of coastal ecosystems: Sea surface temperature change and coral bleaching. Chapter 2 in Remote Sensing of
Aquatic Coastal Ecosystem Processes, Richardson LL and LeDrew EF (Co-Eds), Kluwer publishers. January,
2006.
Strong AE, Liu G, Meyer J, Hendee JC, Sasko D (2004) Coral Reef Watch 2002. Bul of Mar Sci 75(2):259-268.
URL: coralreefwatch.nooa.gov, http://coralreefwatch.nooa.gov/satellite/methodology (assessed June 18, 2009)
8You can also read