Flood-resilient waterfront development in New York City: Bridging flood insurance, building codes, and flood zoning
←
→
Page content transcription
If your browser does not render page correctly, please read the page content below
Ann. N.Y. Acad. Sci. ISSN 0077-8923

ANNALS OF THE NEW YORK ACADEMY OF SCIENCES
Issue: Flood-Resilient Waterfront Development in New York City

Flood-resilient waterfront development in New York City:
Bridging flood insurance, building codes, and flood zoning
Jeroen C.J.H. Aerts and W.J. Wouter Botzen
Institute for Environmental Studies, Vrije Universiteit, Amsterdam, the Netherlands

Address for correspondence: Jeroen C.J.H. Aerts and W.J. Wouter Botzen, Institute for Environmental Studies (IVM), De
Boelelaan 1087, 1081 HV Amsterdam, the Netherlands. jeroen.aerts@ivm.vu.nl.

Waterfronts are attractive areas for many—often competing—uses in New York City (NYC) and are seen as multi-
functional locations for economic, environmental, and social activities on the interface between land and water.
The NYC waterfront plays a crucial role as a first line of flood defense and in managing flood risk and protecting
the city from future climate change and sea-level rise. The city of New York has embarked on a climate adaptation
program (PlaNYC) outlining the policies needed to anticipate the impacts of climate change. As part of this policy,
the Department of City Planning has recently prepared Vision 2020: New York City Comprehensive Waterfront Plan
for the over 500 miles of NYC waterfront (NYC-DCP, 2011). An integral part of the vision is to improve resilience to
climate change and sea-level rise. This study seeks to provide guidance for advancing the goals of NYC Vision 2020
by assessing how flood insurance, flood zoning, and building code policies can contribute to waterfront development
that is more resilient to climate change.
Keywords: waterfront; flood; New York City; building codes; flood zoning; insurance; NFIP

Lists of Abbreviations: ASCE, American Society of Civil Engineers; BFE, base flood elevation; BFL, base floor
level; CEDS, Cadastral-based Expert Dasymetric System; CRS, Community Rating System; CWP, comprehensive
waterfront plan; CZM, Coastal Zone Management Act; DCP, New York City Department of City Planning; DEC,
New York State Department of Environmental Conservation; DEM, digital elevation model; DFE, design flood
elevation; DoITT, Department of Information Technology and Telecommunications; FAR, floor area ratio; FEMA,
Federal Emergency Management Agency; FIRMs, flood insurance rate maps; LIRR, Long Island Rail Road; MNRR,
Metro-North Railroad; MOMA, Museum of Modern Art; MTA, Metropolitan Transportation Authority; NFIP,
National Flood Insurance Program; NYC, New York City; NYS, New York State; OEM, Organization for Emergency
Management; OSR, open space ratio; PAD, property address directory; SEQRA, State Environmental Quality Review
Act; SFHA, special flood hazard area; SOC, structural occupancy category; TDRs, transfer of development rights;
TFA, tradable floor area

Extended Summary                                                     Insurance Program (NFIP) coordinated by the Fed-
                                                                     eral Emergency Management Agency (FEMA), the
The main outcome of this study is that flood-zoning
                                                                     NYC Department of Buildings, and the NYC De-
policies, flood insurance, and building codes are
                                                                     partment of City Planning to ensure that all existing
powerful tools for controlling changing future land
                                                                     regulations are applied with maximum efficiency.
use, and hence the potential vulnerability of land
                                                                     International examples of such cooperation are pre-
use to flood risks. Waterfronts are already subject to
                                                                     sented together with how such cooperation would
many more zoning and insurance regulations than
                                                                     apply to the situation in New York City.
landward areas, and waterfronts with a mixed use are
more complex to design. This study has, therefore,
focused on recommendations that are rooted in ex-                    The NFIP and climate change
isting legislation on flood insurance, zoning policies,              The federal government provides flood insurance
and building codes. It also illustrates the need for                 through the NFIP in the United States, which
improved cooperation among the National Flood                        insures a value of about US$31.6 billion in New
doi: 10.1111/j.1749-6632.2011.06074.x
                                      c 2011 New York Academy of Sciences.
Ann. N.Y. Acad. Sci. 1227 (2011) 1–82 !                                                                                   1
Flood-resilient waterfront development in New York City                                                            Aerts & Botzen

York State (NYS) and US$8 billion in New York City                ning is to take into account future flood-risk maps
(NYC). FEMA administers the program, sets flood                   (e.g., the future 1/100 year floodplain) in flood in-
insurance premiums, and sets minimum building                     surance, zoning, and building code policies. Cur-
standards on the basis of the special flood hazard                rently, FEMA produces flood hazard maps that show
areas (SFHA: the 1/100 flood zone). The NFIP is                   the 1/100 year flood zone. This task consists of de-
an important program for achieving risk reduction                 lineating flood hazard areas, mapping floodways,
because it imposes the minimum requirements for                   flood elevations, and flood velocity. These studies
local governments’ flood zoning and flood building                form the basis for creating flood insurance rate maps
codes, and it provides incentives to homeowners                   (FIRMs).
to invest in risk reduction beyond these minimum                      In view of climate change, the geographical ex-
standards. The NFIP sets the minimum building re-                 tent of the 1/100 year flood zone is likely to in-
quirements in the 1/100 flood zone, and the local                 crease, and insurance and zoning regulations could
governments are allowed to impose zoning regula-                  be made applicable to what is expected to be the
tions and building codes in addition to these min-                future 1/100 year floodplain. Knowing the future
imum standards. For example, the base flood el-                   1/100 flood zone offers the possibility to impose the
evation (BFE) level of the 1/100 flood is used to                 same requirements that apply to the current 1/100
determine the minimum height of the ground floor                  year flood zone, such as the elevation of new build-
of new structures in the SFHA.                                    ings and floodproofing measures, to the future 1/100
   The NFIP has been quite successful in providing                year flood zone. Such a policy could ensure that ad-
flood insurance to many households in the United                  equate mitigation measures be undertaken in what
States to which flood insurance would otherwise                   is expected to be the future floodplain. Each new de-
not be available. Furthermore, the NFIP has been                  velopment or revitalization program could then be
rather effective in limiting the vulnerability of new             overlaid with the future 1/100 flood zone maps, and
constructions to flood hazards through floodproof-                the current NFIP regulation with BFE requirements
ing measures. By contrast, the program is generally               could be applied to these future flood zones. Cur-
evaluated as being ineffective in limiting new                    rently, freeboard is added for certain new construc-
developments in high-risk areas and in reducing the               tions in the current 1/100 year flood zone, which
vulnerability of existing buildings to flood hazards.             means additional elevation of the base floor level
In addition, many buildings that are exposed to                   (BFL) above the BFE level determined by FEMA.
flooding but are located outside the 1/100 year flood             Freeboard is, however, not required for buildings
zone are not covered by the NFIP. This indicates                  currently outside this zone that are expected to be
that there is a need for an assessment of how zoning              within the 1/100 year flood zone in the future. Al-
policies can be better geared toward reducing flood               lowing for freeboard in the future 1/100 zones an-
risk.                                                             ticipates future climate risk. Apart from mapping
   Climate change or other future developments,                   future flood zones, it is also recommended that ex-
such as urban development, are not addressed in                   pected damage be mapped, using catastrophe mod-
the NFIP. The general recommendation for the NFIP                 els, and the expertise of insurance companies and
program is the need for a thorough assessment of                  academics in these risk assessments.
how the NFIP can be geared toward accommo-                            An alternative policy to mapping the future 1/100
dating and ameliorating the impact of increased                   flood zone is to regulate not only the current 1/100
flood risk. Moreover, there seems to be consider-                 flood zone, but also other flood zones, such as the
able scope to improve the current program even if                 current 1/500 year flood zone. The advantage of do-
flood risk would not increase as a result of climate              ing this is to avoid a discussion on the selection of
change.                                                           a climate change scenario that determines the cal-
                                                                  culation of the future 1/100 flood zone. Regulating
Cooperation between the NFIP and NYC                              the current 1/500 year flood zone may be justified
zoning policies                                                   by the high number of flood losses that have already
An important recommendation for improved co-                      occurred in that zone, and the arbitrary nature of
operation among the NFIP, the NYC Department of                   the decision of the NFIP to regulate only the 1/100
Buildings, and the NYC Department of City Plan-                   year flood zone.

2                                                                                               c 2011 New York Academy of Sciences.
                                                          Ann. N.Y. Acad. Sci. 1227 (2011) 1–82 !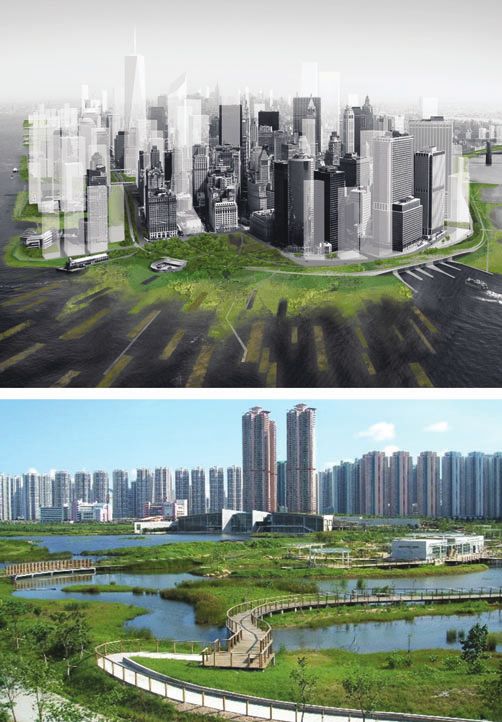
Aerts & Botzen                                                               Flood-resilient waterfront development in New York City

Flood insurance rate maps                                            NFIP. It seems unlikely, however, that the current
FIRMs are often inaccurate, which results in pre-                    grant programs will free up sufficient financial re-
miums that do not completely reflect actual risk.                    sources to finance the required climate adaptation
Moreover, the decision not to map certain risks,                     policies for the NYC waterfronts. Moreover, the
such as the failure of flood protection, results in an               grants mainly focus on mitigating flood damage to
underestimation of flood risk and premiums that are                  existing buildings.
too low, which contributes to the operating losses
                                                                     Increasing the market penetration of the NFIP
experienced by the NFIP and distorts incentives for
                                                                     The market penetration of flood insurance is rather
damage mitigation measures. Moreover, the lack of
                                                                     low, which is an impediment for using insurance
detail of the maps is problematic for local govern-
                                                                     to stimulate flood-risk reduction measures, such as
ments if they wish to implement stricter building
                                                                     premium discounts. The low market penetration
codes than the NFIP regulations and regulate land
                                                                     has, moreover, the adverse effect of impairing the
use in floodplains.
                                                                     spread of risk, which generally results in higher pre-
   A continuous process of updating maps may be
                                                                     miums for the remaining pool of insured. If climate
especially important not only if risk changes over
                                                                     change increases flood risk, then this would im-
time because of socioeconomic developments in
                                                                     ply that more uninsured households would suffer
floodplains, as has been the case in the past, but
                                                                     flood damage, which would either increase the need
also if there are changes in the frequency and inten-
                                                                     for federal disaster assistance or leave many house-
sity of the flood hazard due to changes in precipi-
                                                                     holds uncompensated and in financial distress. This
tation, storms, and sea-level rise. The availability of
                                                                     problem can be resolved in three main ways: (1)
accurate and up-to-date FEMA flood hazard maps
                                                                     more strictly enforce the mandatory purchase re-
is important in steering appropriate waterfront de-
                                                                     quirement for homeowners with federally backed
velopment in NYC.
                                                                     mortgages who live in the 1/100 year flood zone; (2)
Premiums and base flood elevation                                    make insurance compulsory in the expected future
The NFIP provides homeowners an incentive to in-                     1/100 year zone or a current flood zone with a larger
vest in elevation of their property above the BFE level              flood return interval, such as the 1/500 year zone,
because this can lower their premiums. It is recom-                  given that the 1/100 year flood zone is expected
mended, however, that the NFIP should reevaluate                     to increase in the future; (3) alternatively, cover-
flood insurance premium discounts for buildings in                   age against flooding could be made compulsory in
A zones, because A zone discounts effectively cease                  all existing building and home contents insurance
at 1 to 2 ft above the BFE, but a higher elevation                   policies that, for example, cover fire risks.
is desirable owing to climate change. Furthermore,
                                                                     Setting risk-based insurance premiums
increasing flood risk coverage because of climate
                                                                     In general, the premiums of the NFIP do not com-
change requires updates of FIRMs over time and
                                                                     pletely reflect risk. Incentives for homeowners to
will imply a shift in the zone classification for many
                                                                     implement risk reduction measures are distorted
properties. The current regulation for such prop-
                                                                     if premiums do not accurately reflect risk, which
erties is that property owners who are remapped
                                                                     can be especially troublesome if more investments
to a more costly zone classification are charged the
                                                                     in mitigation are needed in the future because of
lower insurance premium of the former flood zone,
                                                                     increased risk. The NFIP could set actuarially fair
which is also referred to as grandfathering. It may,
                                                                     premiums that are high enough to not only cover
therefore, be considered necessary to abolish this
                                                                     losses in an average loss year, but that are also, on
grandfathering mechanism, since it would result in
                                                                     average, capable of covering losses of catastrophic
an increase in subsidized policies over time.
                                                                     floods, and could better differentiate premiums
FEMA mitigation grants                                               according to the actual flood risk faced by poli-
FEMA has been actively involved with funding flood                   cyholders. Moreover, the current subsidies given to
prevention through state and local governments in                    premiums of pre-FIRM buildings could be phased
their efforts to mitigate potential flood damage to                  out over time. Changing the premium structure
structures. The availability of the grant programs                   of the NFIP by charging homeowner’s premiums
is often a motivation for communities to join the                    that fully reflect risk raises important equity and

                                      c 2011 New York Academy of Sciences.
Ann. N.Y. Acad. Sci. 1227 (2011) 1–82 !                                                                                           3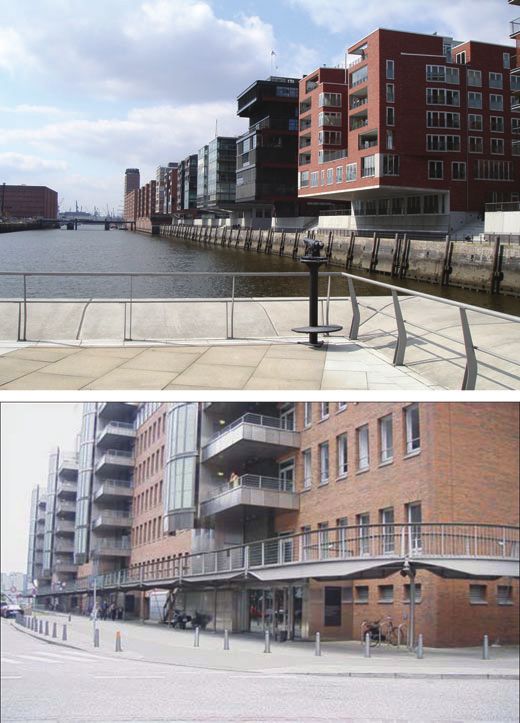
Flood-resilient waterfront development in New York City                                                            Aerts & Botzen

affordability issues. Some form of income support                 limits, which prohibits buildings from increasing
or compensation could be given to low-income                      their elevation above a maximum height. A logical
households that would face large rate increases.                  next step would be to eliminate this zoning penalty.
However, in order to provide adequate incentives                  To eliminate it requires a zoning text amendment,
for risk reduction, any treatment should come from                which must go through a public review process. The
public funding, for example, in the form of tax in-               public might be concerned about allowing high-rise
centives or insurance vouchers and not from subsi-                buildings on the waterfront. It would ultimately be
dies on insurance premiums.                                       up to the City Planning Commission and then the
                                                                  City Council to approve the text amendment.
Long-term insurance
The short-term nature of the current flood insur-                 Existing buildings: restrictions and
ance policies of only one year may restrain active                enforcement
collaboration between insurers and policyholders                  For existing buildings, set-back, relocation, or ele-
in reducing exposure to flooding. Several scientific              vation in areas at danger of flooding is perceived as
experts have suggested introducing long-term flood                infeasible. There are, however, a few policies relating
insurance contracts with a duration of, for example,              to existing buildings that could enhance flood re-
5, 10, or 20 years that are tied to properties instead of         silience. First, additional regulation could stimulate
individuals. Such a long-term contract would estab-               homeowners to implement measures to floodproof
lish a long-term relationship between insurers and                telephone and electricity switchboards, and heating
policyholders, which gives both parties incentives to             and gas installations above the BFE level. Second, al-
implement cost-effective risk-reducing measures. A                terations of buildings in certain high-risk areas can
challenge for long-term policies is how to price fu-              be limited (e.g., V zones—high risk coastal areas),
ture risk if the risk landscape changes as a result               although this is difficult to implement.
of climate change. Further research could examine
whether climate change projections are currently                  Lowering urban density
sufficiently reliable to price future flood risk.                 An option is to preserve—or encourage—open
                                                                  space on lots in order to reduce flood risk by limiting
Restrictions for vital infrastructure                             the buildings’ footprints. For this, zoning controls
Infrastructure damage is not adequately addressed                 such as the open space ratio (OSR) and lot cover-
by the NFIP, although potential flood damage is,                  age exist, which are now only applied to residential
for the most part, determined by the infrastructure               areas. The option of further stimulating a market-
at risk. The NFIP only recommends restrictions for                based system of tradable floor area (TFA) in order to
the development of critical infrastructure through                shift the potential new floor area to nearby landward
the Community Rating System (CRS), but these rec-                 lots is not seen as a feasible option. In NYC, density
ommendations are not strictly enforced. The reason                can be traded between high-risk waterfront proper-
for the limited involvement of the NFIP in reducing               ties and lower-risk properties further inland if the
the vulnerability of infrastructure to flooding is that           properties are adjacent to one another. The prob-
infrastructure is not covered in its flood insurance              lem with that approach is that it is uncertain which
policies. Additional zoning policies could describe               properties will accept the increased density; hence
which type of infrastructure can be assigned as crit-             this mechanism does not lend itself to controlled
ical, and clearly divide responsibilities between the             flood risk–reducing measures.
NFIP and NYC concerning the enforcement of zon-
ing restrictions.                                                 Infrastructure
                                                                  Large parts of the infrastructure system in NYC (e.g.,
Adjusting zoning controls
                                                                  rail, subway, airports, naval bases) lie within the cur-
Eliminating the zoning building height penalty                    rent 1/100 and 1/500 flood zones and determine for
The zoning resolution could provide additional flex-              a large part the potential flood damage of a coastal
ibility for buildings in flood-risk areas to allow for            storm surge. Zoning policies and especially build-
freeboard, indicating the additional elevation of the             ing codes should, therefore, better address flood risk
BFL above the FEMA BFE level in order to earn a                   for at least critical infrastructure projects. This is
discount on insurance premiums. However, these                    sometimes a difficult issue because infrastructure
elevated buildings are also subject to zoning height              planning often does not involve a formal role for

4                                                                                               c 2011 New York Academy of Sciences.
                                                          Ann. N.Y. Acad. Sci. 1227 (2011) 1–82 !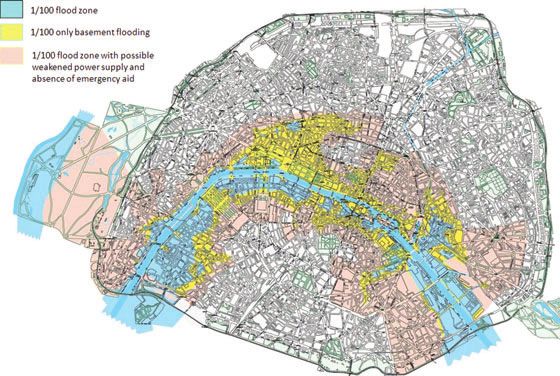
Aerts & Botzen                                                               Flood-resilient waterfront development in New York City

government agencies. However, there is scope for the                 open water for waterfront development or protec-
improved fine-tuning and cooperation among agen-                     tion in exchange for creating (added) environmental
cies involved in developing zoning policies and NFIP                 values elsewhere through new wetlands or artificial
policies and transportation authorities; for example,                reefs.
tunnel entrances and ventilation grates can be pro-                     Recent research supports the notion that modifi-
tected and/or elevated. Furthermore, NFIP restric-                   cations in the open water zone and intertidal wet-
tions for the development of critical infrastructure                 land area should be evaluated to determine whether
are only encouraged through the CRS but are not                      waterfront activities can enhance the resilience to
enforced. A common policy could aim at describing                    climate change. Many such modifications, however,
what infrastructure can be assigned as critical.                     require discretionary permits. Currently, the man-
                                                                     ner in which NYS environmental regulations have
Waterfront development and environmental                             been administered has effectively prohibited any wa-
legislation                                                          terfront development into open water space.
Climate change and sea-level rise place an additional
burden on waterfront developments and policies,                      Building codes
and the challenge is to create a greener waterfront                  The NFIP determines minimum building code stan-
that is more resilient to climate change and attrac-                 dards, but, in addition, NYC has designed its own
tive for business and residents. One issue is that both              building codes that can go beyond these mini-
urban development and flood protection measures                      mum standards. The building codes apply to new
(e.g., levees and flood walls) are often perceived as                structures and substantial improvements to existing
activities that disturb environmental values. Hence,                 structures. Building regulations apply only to resi-
the challenge is to develop the waterfront in such                   dential properties, commercial properties, and sport
a way that it enhances flood protection levels by                    stadiums, for example, but not to public infrastruc-
applying measures that also improve environmen-                      ture, such as the subway. The additional flood build-
tal values. This study, therefore, recommends that                   ing code regulation for NYC consists of three main
those waterfront areas should be prioritized where                   components: (1) building above the BFE level (free-
coastal flood protection and nature preservation can                 board) required by the NFIP, (2) dry as well as wet
be co-developed, and, hence, where local govern-                     floodproofing, and (3) requirements per flood zone
ment and the state and federal environmental and                     for four different types of buildings. These specific
coastal zone policies have mutual interests. Such                    requirements apply to the 1/100 year flood zones,
an approach could be addressed through better in-                    but differ between A and the coastal V flood zone.
tegrating federal and state coastal zone protection                  Moreover, building codes are stricter for certain cat-
into local waterfront revitalization programs. The                   egories of buildings (up to four categories exist) that
support for environmentally based flood protection                   have a higher hazard of human life in case of failure,
to anticipate climate change receives support from                   such as hospitals.
communities, as has been communicated during the                        In A zones, elevation is needed in low-lying areas
borough workshops initiated for the City Council’s                   except for storage, parking, the building access, or a
Vision 2020.                                                         crawlspace. The design flood elevation (DFE) equals
   The rationale for such an approach is that these                  the BFE level of the 1/100 year flood for building cat-
multifunctional land use developments need new                       egories I and II, while it is, respectively, 1 ft and 2
planning regulations and urban designs that allow                    ft higher for building categories III and IV. Below
for a less rigid boundary between land and water.                    this DFE level, wet floodproofing is required for all
This implies that, in some instances, to compen-                     building categories according to their specific DFE
sate for the loss of urban space, the land–water                     level. Instead of wet floodproofing, dry floodproof-
boundary should be moved landward and in some                        ing is possible in certain cases for all building cate-
instances seaward. Moreover, most environmental                      gories according to their specific DFE level, except
values are found in creating (shallow) gradients be-                 for residential buildings for which dry floodproof-
tween land and water. International examples show                    ing is not allowed. Building requirements are stricter
how the mechanism of “environmental compensa-                        in V flood zones because these are coastal areas that
tion” is applied in cases where it is permitted to use               are subject to high-velocity wave action. The waves

                                      c 2011 New York Academy of Sciences.
Ann. N.Y. Acad. Sci. 1227 (2011) 1–82 !                                                                                           5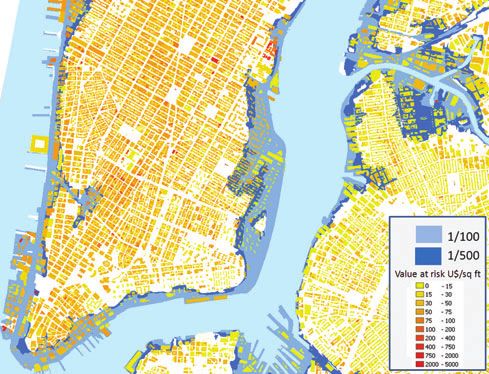
Flood-resilient waterfront development in New York City Aerts & Botzen
have to be able to flow underneath the buildings, be further examined how ease of accessibility to
which can be done by building on adequately an- these elevated buildings can be guaranteed for dis-
chored pilings or columns. The DFE is the same as abled persons, for example, by making ramps or
the BFE of the 1/100 year flood for building cate- elevating streets. Moreover, design and public realm
gories I and II, while it is, respectively, 1 ft higher for considerations for adding freeboard need to be
building categories III and IV if the flood is located explored.
parallel to the direction of waves, and 2 ft higher
Cost of damage mitigation
if it is perpendicular. Only flood damage–resistant
Jones et al. (2006) conducted an extensive study
materials and finishes can be used below the DFE,
for estimating the costs of flood damage mitigation
and dry floodproofing is not allowed.
measures. They concluded that for new residential
Current regulations could be made stricter on
buildings, the additional costs of adding freeboard
the basis of the existing flood hazard maps. For ex-
to the at-BFE building cost are estimated to be be-
ample, it would be useful to explore more strict
tween 0.8% and 1.5% per foot of freeboard in a ma-
foundation standards, especially in the current A
sonry wall with an interior pier (crawlspace) foun-
flood zones. For example, some of the foundation
dation, between 0.8% and 3.0% per foot of free-
standards that currently exist in the stricter regu-
board in a fill foundation, and between 0.25% and
lated V zones could be made applicable to A zones.
0.5% per foot of freeboard in a pile or masonry pier
Moreover, all buildings in the 1/100 year A flood
foundation.
zones can be elevated, with the bottom of the low-
est horizontal supporting structural member above Flood protection and architecture
the flood protection level, as currently applies to Several examples exist where waterfront develop-
the V flood zones. Furthermore, in NYC it would ment has been combined with flood protection
be useful to add additional freeboard to the current measures. For example, the city of Tokyo (Japan)
elevation requirements. For example, currently no has been experimenting with a fail-proof, low-
freeboard is required for category II buildings, while maintenance levee for the protection of urban areas.
this is advised by the American Society of Civil Engi- These “super-levees” improve on the typical levee by
neers’ (ASCE) 24 standard (+1 ft) and NYS building widening its footprint and reducing the backslope
codes (+2 ft). This would improve protection for to a low gradient. The stabilized and strengthened
many buildings against floods, since these category sides can be developed, extending the urban devel-
II building regulations cover most residential build- opment area to the top of the levee and allowing
ings. The city government could adopt the ASCE easier visual and physical access to the water. In
standard for category II buildings, which is more Japan, these developments are high rise and inter-
stringent than the federal regulations. For the eval- woven with parks, open spaces, and wetlands that
uation of the NFIP, Jones et al. (2006) conducted are scarce throughout much of the city. There are
cost–benefit analyses of adding freeboard up to 4 problems with finding space to develop such wide
feet. The analyses have been performed for various levees and with the demand for large amounts of
discount rates, flood conditions, elevation methods, fill material. Some of the fill can be offset by in-
and damage functions. The results show that most cluding parking and service structures in the body
of the time, the benefits of freeboard in terms of re- of the levee. For the NYC area, this would imply a
duced flood vulnerability exceed its costs, especially joint effort among local, state, and federal govern-
for coastal V flood zones. This analysis has been ments, especially the U.S. Army Corps of Engineers.
conducted for single-family homes, and further re- However, the Japanese example shows that protect-
search needs to determine whether similar results ing cities from floods with super-levees is feasible
apply to other building types. Therefore, it is ad- and affordable. Waterfront developments on super-
visable that NYC adopt the freeboard requirement levees are technically feasible and this does not nec-
of NYS of at least 2 ft above BFE and also consider essarily mean that they are shut off from the water,
adding freeboard up to 4 feet. Adding freeboard as is often perceived.
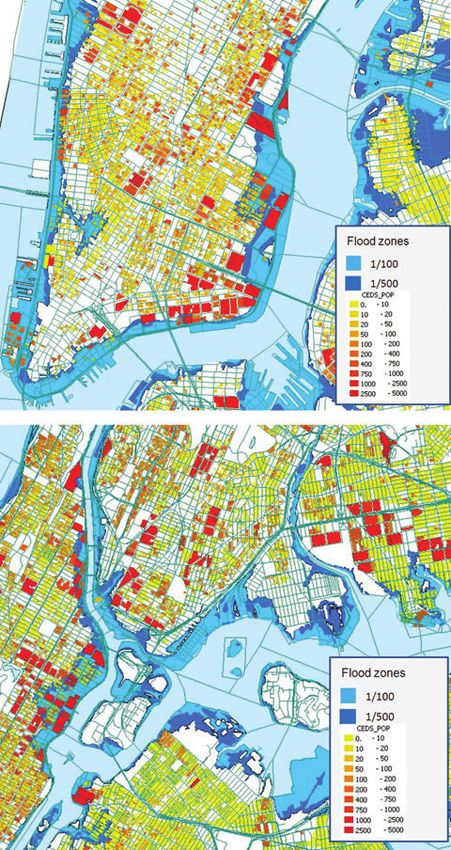
to the building regulations of waterfront develop- In the city of Hamburg (Germany), an old port
ment could be a fruitful measure to make water- facility has been rebuilt and an entire new waterfront
fronts more resilient to climate change. It should has been elevated to a height of about 20 feet. Above
6 c 2011 New York Academy of Sciences.
Ann. N.Y. Acad. Sci. 1227 (2011) 1–82 !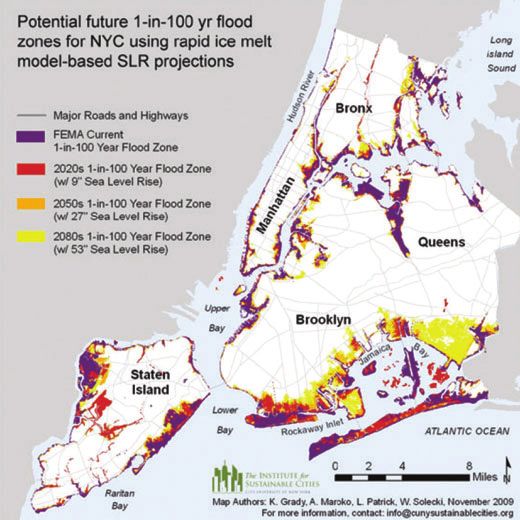
Aerts & Botzen                                                               Flood-resilient waterfront development in New York City

this elevation, residential housing is permitted, and                with government experts in NYC have revealed that
a service and emergency road system exist at 20 ft to                the CRS is not attractive for a highly densely popu-
maintain accessibility in case of a flood. The ground                lated area such as NYC.
floors are occupied by parking lots and businesses                      A coordinated effort is needed between insurers
that can be sealed off with steel doors in case of                   and governmental planners to develop a more com-
a flood. High-rise waterfront development can be                     prehensive flood management plan, which would
promising for NYC in some locations, as visualized                   outline the effects of climate change, alternative so-
in the Museum of Modern Art (MoMA) exhibition                        lutions, and costs and benefits of the different strate-
on flood risk-only architectural innovations, such                   gies. Internationally, examples can be found in the
as evacuation routes, public access to the shore, and                city of Paris, where an integrated flood manage-
the combination of flood protection and housing,                     ment plan is being developed, showing how the
all of which can be illustrative for redeveloping old                vulnerability of properties and infrastructure can
port facilities in NYC.                                              be reduced; the implementation of these measures
                                                                     is linked to the level of the deductibles for flood
Toward an integrated flood management plan                           insurance. The city of London has conducted an ex-
The complexity of the issue and the inherent un-                     tensive study (Thames 21) on climate change and
certainty associated with future projections, such as                flood risk that discusses different adaptation strate-
climate change, requires an integrated approach to                   gies and their costs and benefits.
flood management in NYC. Currently, only the CRS                        The NYC Mayor’s Office of Long-Term Planning
coordinated by the NFIP encourages communities                       and Sustainability, with its established relationships
to develop a community-based flood management                        with multiple stakeholders, is well-positioned to co-
plan for implementing mitigation measures in re-                     ordinate, explore, and foster the implementation of
turn for premium discounts. However, discussions                     such a plan.

                                                           Contents
1. Introduction                                                      6. Flood-resistant building codes for New York City
2. Climate change and flood risk in New York                            6.1. Introduction
     City                                                               6.2. Existing flood-related building code policies
3. Flood damage estimations for New York City                                in New York City
   3.1. Available data and data preparation                             6.3. Strengths and weaknesses: challenges for the
   3.2. Analysis of buildings in flood zones                                 future
   3.3. Analysis of the value at risk of properties and                 6.4. Suggestions for improvements
       population at risk                                            7. Urban waterfront architecture and planning: an
   3.4. Potential damage to the NYC transport                           international perspective
     system                                                             7.1. Super-levees: Tokyo
   3.5. Lessons for flood-risk management                               7.2. Elevated residential areas: old port facility,
4. The National Flood Insurance Program (NFIP)                               Hamburg
    and New York City                                                   7.3. Environmental aspects: using open water and
   4.1. Description of the current NFIP and federal                          nature compensation (the Netherlands)
         mitigation policies                                         8. Recommendations: climate-resilient waterfronts
   4.2. Strengths and weaknesses of the NFIP                             in New York City
   4.3. Suggestions for improving the NFIP and                       Appendix A. Interviewed experts
        international examples                                       Appendix B. Zoning glossary
5. Flood zoning policies in New York City                            Appendix C . Databases
   5.1. Introduction                                                 Appendix D. Vital facilities per flood zone
   5.2. Zoning policies for waterfronts                              Appendix E. Value of tax lots without buildings
   5.3. How are flood risks addressed in NYC                         Appendix F. Classification of “other land use”
        zoning policies?                                             Appendix G. Flood damage to subway systems
   5.4. Suggestions for improvements                                 Appendix H. Population at risk per borough

                                      c 2011 New York Academy of Sciences.
Ann. N.Y. Acad. Sci. 1227 (2011) 1–82 !                                                                                           7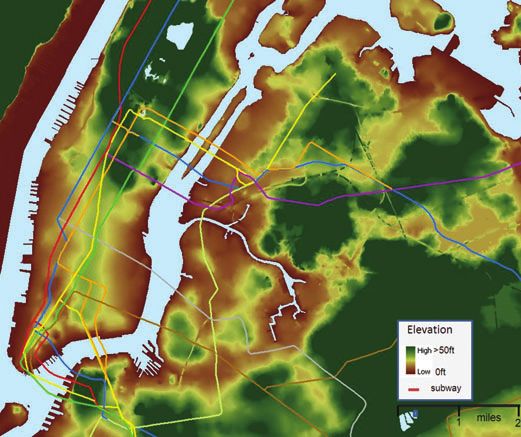
Flood-resilient waterfront development in New York City                                                            Aerts & Botzen

Acknowledgments                                                   floods can cause considerable losses (Aerts et al.,
                                                                  2009).
We gratefully acknowledge the support from
                                                                     Human exposure to flood hazards is caused by
the NYC Department of City Planning: Amanda
                                                                  settlement and other development in flood-prone
M. Burden, Michael Marrella, Samuel Hornick,
                                                                  areas, such as floodplains and coastal areas. Since
Howard Slatkin, Wilbur Woods, Tom Wargo, Clau-
                                                                  the beginning of human civilization, people have
dia Herasme, and Winston von Engel; the NYC De-
                                                                  realized the benefits of these areas, and urbaniza-
partment of Buildings: James Colgate and Joseph
                                                                  tion near the waterfront continues today because
Ackroyd; the NYC Mayor’s Office: Aaron Koch and
                                                                  of the attractiveness of locating near the water for
Adam Freed; the NYC Department of Informa-
                                                                  recreational and economic activities (Rosenzweig
tion Technology and Telecommunications: Colin
                                                                  et al., 2010). The question that arises is how to de-
Reilly; the NYC Office of Emergency Management:
                                                                  velop these areas so that vulnerability to flooding
James McConnell and Joshua Friedman; the Federal
                                                                  is managed in a way that limits risks to human life
Emergency Management Agency: Mary Colvin, Scot
                                                                  and physical structures? In this respect, flood zon-
Duel, and Patricia Griggs; Swiss RE: Fabrice Felden,
                                                                  ing policies and building codes are powerful tools
Megan Linkin, and Aurel Schwerzmann; Columbia
                                                                  for controlling changing future land use, and hence
University: David Major, Klaus Jacob, and George
                                                                  the potential vulnerability of land use to flood risks
Deodatis; the Hudson River Foundation: Clay Hiles
                                                                  (Sussman and Major, 2010). The NYC waterfront
and Dennis Suszkowski; the Metropolitian Trans-
                                                                  plays a crucial role in this context as a first line
portion Authority: Ernest Tollerson; and City Uni-
                                                                  of flood defense and in managing flood risk and
versity of New York: Juliana Maantay and Andrew
                                                                  protecting NYC for future challenges like climate
Maroko.
                                                                  change. Therefore, the way zoning policies are ap-
   We thank the following organizations and per-
                                                                  plied to waterfronts will directly determine future
sons for the use of their photos and figures:
                                                                  vulnerability to flood risks; hence, new (re-) zon-
nArchitects, Julia Chapman; dlandstudio LLC
                                                                  ing policies for waterfronts can be perceived as an
and Architecture Research Office, Carissa Azar;
                                                                  option for climate adaptation in NYC.
the Metropolitan Transportation Authority, Lester
                                                                     The federally operated NFIP is an important pro-
Freundlich and Ernest Tollerson; UNESCO-IHE,
                                                                  gram for zoning policies near the waterfront, as it
William Verbeek; RPS, Bianca Stalenberg; and Asso-
                                                                  sets the basic requirements for zoning and build-
ciation Sauvegarde Petite Ceinture (ASPCRF), Paris,
                                                                  ing codes in flood-prone areas. For example, the
Bruno Bretelle.
                                                                  ground floor of new structures in flood zones has
   All errors or opinions remain ours.
                                                                  to comply with a certain flood elevation level, the
                                                                  BFE. Although the NYC zoning policies and build-
1. Introduction
                                                                  ing regulations incorporate information and regu-
The recently published report of the New York                     lations from the NFIP, there is scope for improved
City Panel on Climate Change (NPCC) indicates                     cooperation between the NFIP and zoning regula-
that climate change poses a challenge for water-                  tions in order to better anticipate the challenges of
front development in NYC, given the uncertain                     climate change (Burby, 2006; Sussman and Major,
risks of sea-level rise and more flooding (Rosen-                 2010).
zweig and Solecki, 2010). The NPCC states that                       Currently, parts of the waterfront in NYC are be-
NYC is vulnerable to coastal storm surges, which                  ing assessed for rezoning procedures in order to in-
are associated with either late summer/autumn                     crease the attractiveness of these areas for residents,
hurricanes or extratropical cyclones in the win-                  to increase environmental values, and to stimulate
ter period (nor’easters). Climate change and sea-                 economic activities. NYC is planning new develop-
level rise is projected to increase the frequency                 ment on these sites, given the increasing demand
and intensity of flood events, and, although these                for attractive and spacious housing and economic
events are relatively rare, it is relevant to address             activities near the water. In order to address climate
flood risks in current and planned urban devel-                   change in waterfront development, NYC has em-
opment activities, such as waterfronts, because                   barked on a climate adaptation program (PlaNYC)

8                                                                                               c 2011 New York Academy of Sciences.
                                                          Ann. N.Y. Acad. Sci. 1227 (2011) 1–82 !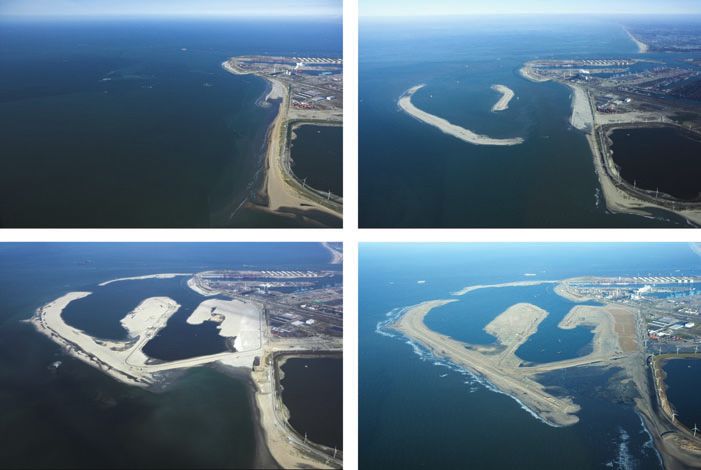
Aerts & Botzen                                                               Flood-resilient waterfront development in New York City

outlining the policies needed to anticipate the im-                  mental regulation of the use of waterfronts. Section 8
pacts of climate change. As part of this policy, the                 concludes.
Department of City Planning has recently prepared
                                                                     2. Climate change and flood risk in New
Vision 2020: New York City Comprehensive Water-
                                                                     York City
front Plan for the over 500 miles of NYC water-
front, defined as New York Harbor and its tribu-                     Climate change projections indicate that by the end
taries, creeks, and bays. Vision 2020 sets long-term                 of the century, NYC may face an increase in mean
goals to guide waterfront development. An integral                   annual temperature of 4–7.5◦ F, an increase in base-
part of the vision is to improve resilience to cli-                  line rainfall of 5–10%, and a rise in sea level of at least
mate change and sea-level rise. The plan articulates                 12–23 inches (Horton et al., 2010). The rise in sea
a general strategy for creating a more flood-resilient               level is very uncertain and sea-level rise may be con-
city, including studies of global best-management                    siderably higher if ice caps, such as the Greenland Ice
practices for coastal management, shoreline pro-                     Sheet, melt more rapidly than current model studies
tection, flood-resistant building design, and other                  project.
climate change adaptation strategies in dense urban                     The two types of storms that can strike NYC are
areas.                                                               hurricanes and nor’easters, and both of these storms
   This study seeks to provide guidance for NYC’s                    can cause storm surges and flooding. It has been
Vision 2020 by assessing how flood insurance, flood                  recorded that since 1815, 15 hurricanes have struck
zoning, and building code policies can contribute                    NYC with a maximum strength of Category 3 on
to waterfront development that is more resilient                     the Saphir-Simpson scale. A direct hit of a Cate-
to climate change. Botzen and van den Bergh                          gory 3 hurricane in New York may cause huge eco-
(2009) propose that a resilient risk-management                      nomic losses, but nor’easters can also have high wind
strategy comprise risk prevention, damage miti-                      speed and cause considerable damage (LeBlanc and
gation, and efficient risk-spreading mechanisms,                     Linkin, 2010). The storm surges and related coastal
such as insurance. Along these lines, this study                     flooding are mainly caused by strong winds that
reviews the current NFIP, and flood zoning and                       pile up water along the shore and generate large
building code policies of NYC, by identifying fu-                    waves. For example, the current 1/100 year coastal
ture challenges and by giving recommendations to                     flood causes a surge of about 8.5 ft at the Battery
deal with a future change in the risk landscape.                     in Lower Manhattan (Horton et al., 2010). Sea-level
Several examples of international practice will be                   rise is expected to increase the intensity, frequency,
provided to give suggestions for resilient water-                    and duration of coastal flooding in NYC. Projec-
front development in NYC, including policies in                      tions of the NPCC indicate that the 1/100 year flood
the UK, France, Germany, and the Netherlands.                        event may occur approximately four times as often
Information for this study has been gathered us-                     in 2080, while the 1/500 year flood event may occur
ing interviews and discussions with experts in NYC                   on average once in 200 years (NPCC, 2009). The
and abroad (see Appendix A), which are comple-                       current flood height associated with the 1/100 and
mented with an in-depth literature review and data                   1/500 flood zone is, respectively, 8.6 ft and 10.7 feet.
analyses.                                                            This may increase to 9.4 ft and 11.5 ft for the 1/100
   The remainder of this study is structured as fol-                 and 1/500 flood zones, respectively, in 2080 (NPCC,
lows. Section 2 provides information on flood risk                   2009; Horton et al., 2010).
and climate change in NYC. Section 3 provides flood                     In addition to climate change, socioeconomic
damage estimations for NYC. Section 4 presents an                    developments, such as population and economic
assessment of the NFIP with a special focus on                       growth in hazard-prone areas, are likely to have
flood-resilient urban development. Section 5 ex-                     a major impact on future flood risks. An upward
amines flood zoning policies in NYC and provides                     trend in worldwide natural disaster losses can be
suggestions for improving flood zoning to accom-                     observed. This has been mainly caused by socioe-
modate potential future increase in risks. Section 6                 conomic developments, such as increased urban-
conducts a similar analysis for building code reg-                   ization in coastal zones, which are likely to con-
ulations. Section 7 discusses (other) international                  tinue in the future (Aerts et al., 2009). NYC has
examples of waterfront development and environ-                      been no exception to this global trend and has

                                      c 2011 New York Academy of Sciences.
Ann. N.Y. Acad. Sci. 1227 (2011) 1–82 !                                                                                           9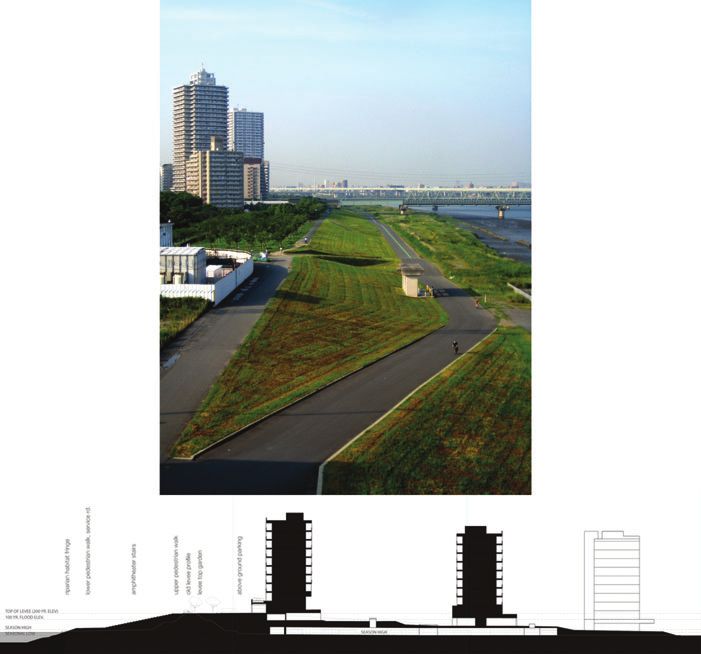
Flood-resilient waterfront development in New York City                                                            Aerts & Botzen

experienced a considerable increase in concentra-                 Exposed assets
tions of population and economic activities over                  Several studies exist that provide rough estimates of
time that have heightened flood risk (Gornitz et al.,             potential flood losses due to hurricanes and win-
2001). According to the NYC Department of City                    ter storms in New York. Nicholls et al. (2008) use
Planning (NYC-DCP, 2006), NYC’s population is                     a relatively simple method to estimate the popula-
projected to continue to grow from over 8 million                 tion and assets at risk from floods in 135 port cities
in 2000 to 9.1 million in 2030, which is an increase              around the globe, including the NYC–Newark re-
of 1.1 million or 13.9%.a These projections indi-                 gion. They estimate the current potential damage for
cate a need to create new housing and public in-                  the NYC–Newark region at US$320 billion. Using a
frastructure, including a further concentration of                scenario for population growth, this may increase to
economic values and recreation opportunities near                 US$1,739 billion in the year 2070. They also com-
waterfronts.                                                      bined a sea-level rise scenario of 50 cm in 2070 with
    For the consequences of flooding, most flood-                 the scenario for population growth, which yields
risk assessments are limited to the detrimental ef-               potential damage of as much as US$2,147 billion in
fects (damage). The term flood damage refers to all               the year 2070.
varieties of harm caused by flooding. Flood dam-                     LeBlanc and Linkin (2010) state that a direct hit
age can be divided into several categories: usually               of a Category 3 hurricane in New York may cause
it is divided into direct and indirect flood damage,              huge economic losses of more than US$200 bil-
both of which are often further divided into tangi-               lion (Table 2.1). In addition, nor’easters can have
ble and intangible damage (Smith and Ward, 1998;                  high wind speed and cause considerable damage, as
Penning-Roswell et al., 2003). Direct damage can                  demonstrated by, for example, the nor’easter in De-
include damage to buildings and economic assets,                  cember 1992 with damage of over US$1 billion in
loss of crops and livestock, immediate health im-                 NYC and the flooding of Lower Manhattan (LeBlanc
pacts, loss of lives, and loss of ecological goods and            and Linkin, 2010). Furthermore, a report on climate
objects (Smith and Ward, 1998; Merz et al., 2004;                 change and adaptation by NYS (NYS, 2010) pro-
Büchele et al., 2006). Indirect damage is damage                 vides some estimates on the potential damage of a
that is induced by the direct impact but that oc-                 1/100 flood in the metropolitan area of NYC. They
curs outside of the space and/or time of the flood                currently estimate the combined direct and indirect
event. Examples of indirect damage include disrup-                losses to be US$58 billion, of which, US$48 bil-
tion of traffic, trade, and public services (Büchele             lion would be attributed to indirect losses. Indirect
et al., 2006). Tangible damage refers to damage that              losses were calculated as the cost for recovering from
can be relatively easily evaluated in monetary terms              a flood. This is expressed as a percentage from the
(e.g., damage to assets or loss of production). In-               daily gross metropolitan product, which currently
tangible damage, such as social and environmental                 is estimated at US$4 billion. Using two sea-level
impacts of floods (Smith and Ward, 1998), is more                 rise scenarios of 2 ft and 4 ft, respectively, these to-
difficult to evaluate in monetary terms (Lekuthai                 tal losses could increase to US$70–84 billion, from
and Vongvisessomjai, 2001), as is loss of human                   which US$57 billion and US$68 billion would be
lives.                                                            attributed to indirect losses.
    To obtain some more insight into the role of wa-
terfronts in flood-risk management and the value                  People at risk
at risk, we focus here on two potential conse-                    The estimate by Nicholls et al. (2008) of the pop-
quences of a flood in NYC: exposed assets (di-                    ulation at risk in the 1/100 flood zone in the NYC
rect damage) and population at risk (number of                    metropolitan area is 1.54 million people. This could
people).                                                          increase to 2.37 million people in the year 2070 be-
                                                                  cause of a population increase. When combining
                                                                  the latter scenario with a sea-level rise scenario of 50
                                                                  cm, the number of exposed people could increase to
a
 In 2006, New York City’s population had already grown            2.93 million. A newly developed mapping method
to an estimated 8.2 million, according to the U.S. Census         (Cadastral-based Expert Dasymetric System, CEDS)
Bureau.                                                           was applied by Maantay and Maroko (2009) to

10                                                                                              c 2011 New York Academy of Sciences.
                                                          Ann. N.Y. Acad. Sci. 1227 (2011) 1–82 !
Aerts & Botzen Flood-resilient waterfront development in New York City
Table 2.1. Existing estimates of the potential storm surge damage (direct and indirect damage) for the metropolitan
area of NYC in billion US$
1992 1/100 1938 Category 3 Maximum Maximum
Winter Flood Hurricane hurricane damage damage
storm (current) (2080)
Nicholls et al. (2008)a 320 2147
Pielke et al. (2008) 37–39
LeBlanc and Linkin (2010)b 0.72 >200
NYS (2010)c 58
a
NYC–Newark region.
b
Based on other sources, such as ISO/PCS, AIR Worldwide, RMS, Eqecat, Insurance Information Institute.
c
Based on calculations by K. Jacob and G. Deodatis, Columbia University.
estimate the population in NYC who are at risk census tract boundaries, ZIP codes, postal zones, or
from flooding (Fig. 2.1). Using the CEDS method, any other administrative boundaries. These data are
Maantay and Maroko (2009) estimated the number often much too aggregated to provide the necessary
of people affected by the 1/100 flood in NYC to be detail and assume the population to be “distributed
approximately 400,000 people. evenly throughout the zone, when, in fact, popula-
tion distribution is generally much more heteroge-
Uncertainties and need for improved risk neous” (Maantay and Maroko, 2009).
estimates Flood- and climate change–resilient development
The amount of potential damage and number of increased in importance on the research and policy-
population at risk should be interpreted with care. makers’ agenda after the destructive Hurricane Kat-
Nicholls et al. (2008) state that they have only used rina in 2005 that caused insured losses of more than
flood depth as an indicator for the hazard using US$71 billion, according to Swiss Re (2010). It has
a digital elevation model (DEM) with a relatively been argued that this unprecedented damage was
coarse resolution. The impact of a flood hazard is largely caused by unsafe socioeconomic develop-
obviously also dependent on many other factors, ment during the decades before the disaster, which
such as flood velocity and inundation propagation. provides important lessons for future development
Furthermore, the specific nature of NYC buildings in coastal zones. Burby (2006) has identified two
and infrastructure is not explicitly considered in main paradoxes that caused an increase in hurricane
their study, and people and assets in skyscrapers exposure: the “safe development paradox,” which
are valued the same as people and assets in single means that the federal government substantially in-
story buildings. creased the potential for catastrophic damage by
Maantay and Maroko (2009) show the influence encouraging urban development in the floodplain,
of uncertainties in data and geographical methods while it tried to make hazardous areas safer by fund-
to estimate a population at risk in the 1/100 flood ing the building of levees and providing flood insur-
zone. They applied the aforementioned new map- ance; and the “local government paradox,” which
ping method of the CEDS and compared this with means that local governments gave insufficient at-
existing methods, such as the conventional areal tention to the flood hazard in urban development.
weighting of census data and centroid-containment These are important lessons for future urban de-
selection. The kernel of this method is to disaggre- velopment in areas that can potentially be affected
gate spatial data to a finer unit of analysis, using by hurricanes, such as waterfront development in
additional (or ancillary) data to better locate pop- NYC. Therefore, a main part of this study will assess
ulation. The main advantage is that the analysis is how the federally run flood insurance program and
not restricted to using the locations of, for instance, the NYC building code and flood zoning policies
c 2011 New York Academy of Sciences.
Ann. N.Y. Acad. Sci. 1227 (2011) 1–82 ! 11Flood-resilient waterfront development in New York City Aerts & Botzen
Figure 2.1. Population at risk (in number of people per tax lot) in the 1/100 and 1/500 flood zones in Lower Manhattan (top) and
the Harlem River area (bottom) (after: Maantay and Maroko, 2009).
12 c 2011 New York Academy of Sciences.
Ann. N.Y. Acad. Sci. 1227 (2011) 1–82 !Aerts & Botzen Flood-resilient waterfront development in New York City
can be geared toward providing adequate protec- 3.1. Available data and data preparation
tion against flooding and its consequences. The MapPLUTO database has been made available
by the NYC DCP.b This database contains data by
3. Flood damage estimations for tax lot and information about the principal build-
New York City ing and the number of structures on it. For example,
Although some studies have made a global analy- MapPLUTO has information on the number of sto-
sis of flood risk in NYC, little information exists ries and the building class of the principal building
on the potential flood damage for individual build- on a lot, the estimated year of building, the year(s)
ings, tax lot levels, or infrastructure (e.g., LeBlanc in which the building was renovated, the build-
and Linkin, 2010). Therefore, we conducted several ing’s assessed value, and the square footage for all
analyses using spatial information on, for exam- structures on the lot. The data dictionary describes
ple, zoning lots, individual buildings, infrastructure, the variables and some of the limitations of the
and flood zoning. The purpose of these analyses is data.
to derive more insight into the number and types of The NYC Department of Information Technol-
buildings that are currently located in the different ogy and Telecommunications (DoITT) provides a
flood zones. In addition, the value at risk of build- database on building footprints.c These building
ings in the 1/100, 1/500, and the other four hurri- perimeter outlines usually have a building identi-
cane flood zones has been estimated using different fication number (BIN) that is associated with them.
catastrophe-modeling approaches (e.g., Grossi and This database can be used with the property address
Kunreuther, 2005; De Moel et al., 2009; De Moel directory (PAD) to link the building perimeter to the
and Aerts, 2010). The results of these analyses can MapPLUTO database and assign MapPLUTO char-
be used to underpin some of the recommendations acteristics to individual buildings. Other databases
made in this study, and to identify possible hotspots include a DEM, which was kindly provided by the
on the NYC waterfront where new flood-resilient Organization for Emergency Management (OEM)
regulations should be implemented with priority. (Fig. 3.1).
This detailed information on buildings and zoning Information on flood hazard zones is shown on
lots at risk could, moreover, be useful for a follow- FIRMs, which can be downloaded from the map
up study that estimates the costs and the benefits service part of the FEMA website.d A FIRM is a
of flood management measures or regulations (e.g., product of the flood insurance study conducted for
Ward et al., 2010). In addition, we also calculate the a community and is available in both paper and
potential damage to the subway and tunnel systems digital form. FIRMs delineate special flood hazard
in NYC in order to derive the total potential flood areas (SFHAs), which are land areas subject to in-
damage (buildings + infrastructure), and how flood undation by a flood that has a probability of 1/100
damage to buildings compares with the damage to or lower. SFHAs are divided into different flood-
transport facilities. hazard zones, depending on the nature and severity
The databases used in this study and their sources of the flood hazard (see Table 3.1). For this study, the
are listed in Appendix C. Section 3.1 describes the 1/100 flood zone is divided in A and V zones, and the
main features of the databases that were available for 1/500 flood zone is used as a rough approximation
this study. The subsequent sections proceed with the of the potential future flood zone.
analyses. The software programs ARCGIS 9.3, Grass The first step in the data preparation was to assign
6.4.0RC6, Quantum GIS 1.5, a PostGIS backend, tax lot information with details on zoning character-
and MATLAB have been used to perform spatial istics from the MapPLUTO database to individual
and statistical analyses. Please note that most data
on buildings in NYC, such as those used in this study,
have generally been developed for tax, planning, b
It can be accessed via http://www.nyc.gov/html/dcp/
inspection, and zoning purposes. Therefore, some html/bytes/applbyte.shtml
approximations from the data are necessary for use c
This data can be downloaded from www.nyc.gov/
in flood damage models, and these are identified datamine
d
throughout the section. See http://msc.fema.gov
c 2011 New York Academy of Sciences.
Ann. N.Y. Acad. Sci. 1227 (2011) 1–82 ! 13Flood-resilient waterfront development in New York City Aerts & Botzen
Figure 3.1. Elevation map for part of Manhattan, Brooklyn, and Queens and a projection of subway lines.
buildings. The number of unique building foot- zoning classes, all buildings on a lot were assigned
prints in the building data is 1,049,871. Of those, to the class that most likely used the ground floor. In
only 950,921 have a proper BIN assigned to them. this respect, it is assumed that industrial use takes
Of those proper BIN numbers, 950,919 appeared to first priority for the ground floor, then commer-
be actually unique and only 945,669 matched with cial use, and finally residential use. In addition to
the PAD data. Conversely, 39,407 unique BIN num- the categories residential (R), commercial (C), and
bers that are in the PAD data have no match in the manufacturing (M), we introduced a category other
footprint data. Of those with a match, 90,852 build- (O) for built-up structures that could not qualify as
ings are not clearly identified, in the sense that they R, C, or M, such as public buildings, military sites,
have multiple entries in the PAD data, with the same utilities, and large infrastructure (see Appendix F).
BIN appearing in 2 up to 35 PAD records. Finally, A further distinction has been made within the
only 854,817 buildings could be unambiguously as- O category in order to differentiate between lots
signed to lots. This implies that 195,054 buildings— that consist mostly of buildings (e.g., museums,
roughly 19% of all buildings—cannot be assigned schools, and churches) and those where buildings
and need to be excluded from the analysis if the BIN are only a small part (e.g., parking lots, airfields, and
is used to combine buildings’ characteristics across marinas).
the data sets.
Because the approach using the BIN number 3.2. Analysis of buildings in flood zones
would result in a loss of 19% of our database, we Table 3.2 shows the number of buildings within
decided to follow an alternative approach. For this, the 1/100 and 1/500 flood zones in NYC. About
the DCP’s own efforts are used to assign lots to a 33,122 buildings are located in the 1/100 flood zone,
dominant land use. It is assumed that the buildings and 66,249 buildings are located in the 1/500 flood
on a given lot are homogeneous in type and num- zone. Note that those buildings listed in the 1/500
ber of floors. All buildings on a lot were assigned to zone also include buildings in the 1/100 flood zone.
this dominant zoning type. If a lot contained mixed Table 3.2, moreover, shows the number of vital
14 c 2011 New York Academy of Sciences.
Ann. N.Y. Acad. Sci. 1227 (2011) 1–82 !You can also read