Bulletin JUNE 2020 - Reserve Bank of Australia
←
→
Page content transcription
If your browser does not render page correctly, please read the page content below

Bulletin JUNE 2020

Bulletin
                                                                JUNE 2020

Contents
1. Transactional Banking at the RBA in Extraordinary Times                  1
2. Economic Effects of the Spanish Flu                                      8
3. News Sentiment and the Economy                                          18
4. Why Study (or Not Study) Economics? A Survey of High School Students    26
5. Bank Fees in Australia                                                  37
6. Cash Use in Australia: Results from the 2019 Consumer Payments Survey   43
7. Quality Change and Inflation Measurement                                55
8. Household Wealth prior to COVID-19: Evidence from the 2018 HILDA
   Survey                                                                  61
9. China’s Residential Property Sector                                     67

   Copyright and Disclaimer Notices                                        79
The Bulletin is published under the direction of the Bulletin Editorial Committee: Luci Ellis (Chair), Lynne Cockerell, Ellis Connolly,
Darren Flood, Judy Hitchen, Carl Schwartz and Paula Drew (Secretary).

The Bulletin is published quarterly in March, June, September and December and is available at www.rba.gov.au. The next Bulletin is
due for release on 17 September 2020.

The graphs in this publication were generated using Mathematica.

ISSN 1837–7211 (Online)

© Reserve Bank of Australia 2020

Apart from any use as permitted under the Copyright Act 1968, and the permissions explicitly granted below, all other rights are
reserved in all materials contained in this publication.

All materials contained in this publication, with the exception of any Excluded Material as defined on the RBA website, are provided
under a Creative Commons Attribution 4.0 International License. The materials covered by this licence may be used, reproduced,
published, communicated to the public and adapted provided that the RBA is properly attributed in the following manner:

Source: Reserve Bank of Australia 2020 OR Source: RBA 2020

For the full copyright and disclaimer provisions which apply to this publication, including those provisions which relate to Excluded
Material, see the RBA website.
Transactional Banking at the RBA in
Extraordinary Times

Talina Leung[*]

Photo: Stefan Mokrzecki – Getty Images

Abstract
The Reserve Bank of Australia (RBA) is the banker to the Commonwealth of Australia, supporting
the Australian Government in its daily banking needs. During extraordinary times, such as the
bushfires of the 2019/20 summer season or the current COVID-19 pandemic, demands on
banking services are heightened as additional payments are made to Australians who require
funds immediately. By modernising its products and service offerings and the underlying
technology, the RBA has ensured payment and banking systems are fit to perform these tasks
securely and reliably. In the past, additional payments during extraordinary times required
additional effort and at times unconventional means. Today, government payments can be made
seamlessly, even during crisis situations, ensuring funds are received without unnecessary delays.

Introduction                                            Account held at the RBA. This happens regardless of
The RBA’s Banking Department provides two key           which financial institution the various government
banking functions to the Australian Government          agencies bank with. The RBA also provides the
and its agencies: core banking services and             government with a term deposit facility as well as
transactional banking services. Banking and registry    an overdraft facility in the event of unexpected
services are also provided to a number of overseas      demand for government cash balances.
central banks and official institutions. Core banking   Transactional banking services are similar to
services are derived from the RBA’s role as a central   traditional banking and payment services offered by
bank and its main function is the daily consolidation   other commercial financial institutions.[1] The RBA
of account balances held by Australian Government       provides a range of products and services that allow
agencies into the government’s Official Public          government agencies to make and receive

                                                                                          BULLETIN – JUNE 2020   1
T R A N S A C T I O N A L B A N K I N G AT T H E R B A I N E X T R A O R D I N A R Y T I M E S

    payments. Around 90 Australian Government                                                        While direct entry payments are suitable for regular,
    agencies use these transactional banking services                                                recurring payments, there are other payment
    and around 350 million payments are processed                                                    options available when there is an element of
    annually, with a total value of $1.1 trillion. This                                              urgency.
    includes payments received by government
    agencies and payments made such as welfare,                                                      High-value Payments System (HVPS)
    health, payroll and vendor payments.                                                             In urgent situations, the government may make
    In recent years, the RBA completed a program of                                                  payments via the High-value Payment System
    work to modernise its banking systems. It also                                                   (HVPS), which settles on a real-time gross
    participated in the build and launch of the New                                                  settlement (RTGS) basis using the Reserve Bank
    Payments Platform (NPP), a payment system to                                                     Information and Transfer System. These payments
    facilitate fast, data-rich payments. These                                                       are irrevocable and in most cases funds are available
    improvements mean that the RBA is well equipped                                                  in the recipient’s account within 15 minutes. RTGS
    to support the Australian Government when                                                        payments are suitable for high-value transactions or
    circumstances require agencies to deliver either                                                 where funds need to be received urgently and with
    small or large targeted payment programs to the                                                  certainty on the same business day. However, the
    community.                                                                                       processing of government payments using this
                                                                                                     system is limited due to its settlement hours being
    Domestic Payment Systems                                                                         more restrictive and only available Monday to
                                                                                                     Friday. This system has been available since 1998.
    The key objective of the RBA’s transactional banking
    function is to deliver secure and efficient services
                                                                                                     The New Payments Platform (NPP)
    that meet the banking and payment needs of
    Australian Government agencies. This ensures                                                     A newer and more convenient fast payment option
    government payments can be delivered in a                                                        is the NPP, where government agencies can make
    reliable, timely and secure manner. Underpinning                                                 fast, data-rich payments 24 hours a day, every day of
    this are a number of payment systems and infras-                                                 the year (Fitzgerald and Rush 2020). NPP payments
    tructure that has been built specifically to handle                                              are settled irrevocably in real-time using the RBA’s
    the high volume and specific requirements of the                                                 Fast Settlement Service. Funds are available in the
    government.                                                                                      recipient’s account almost immediately. NPP
                                                                                                     payments can be made between bank accounts
    Direct Entry                                                                                     held at different financial institutions, provided both
                                                                                                     institutions are NPP participants.[3] In addition to
    Almost all government payments are processed via
                                                                                                     speed of the payments, the NPP also provides richer
    the domestic, low-value direct entry system. The
                                                                                                     data with the option of including up to
    majority of payments are regular social welfare and
                                                                                                     280 characters of information, compared with the
    pension payments administered by Services
                                                                                                     18 characters allowed for direct entry payments.
    Australia.[2] Direct entry payment instructions are
    received in files and are processed in batches.                                                  The NPP was introduced in February 2018 and is still
    Multiple batches are processed each business day. A                                              a new service offering in the payments industry.
    large proportion of regular payments are processed                                               Initial uptake was slower than expected due to
    through the Government Direct Entry System                                                       delays from some financial institutions in delivering
    (GDES). The GDES leverages the industry’s direct                                                 core functionality to their account holders
    entry system but with specific rules for government                                              (Fitzgerald and Rush 2020). Consequently, rollout
    payments, including the early delivery of payments                                               activities of some major banks were not completed
    to banks ahead of the payment value date. This                                                   until 2019. Since then, usage of the NPP has picked
    makes government funds available in recipients’                                                  up as the number of reachable bank accounts has
    accounts by 9.00 am (AEST/DT) on the value date.                                                 increased substantially.

2    R E S E R V E B A N K O F AU S T R A L I A
T R A N S A C T I O N A L B A N K I N G AT T H E R B A I N E X T R A O R D I N A R Y T I M E S

                               Table 1: Cheques as a Percentage Share of Total Payments
                                                                                                      2013                     2016                      2019
Consumer Payments Survey(a)                                                                               0.4                      0.2                          0.2
Government Payments                                                                                       3.5                      1.7                          0.6
(a) Source: 2019 Consumer Payments Survey (Caddy et al 2020)

While some financial institutions have started                         Cheques
migrating direct entry payments to the NPP, it is                      The RBA’s Consumer Payments Survey results show
expected regular payments, especially those with a                     that Australian consumers have been switching to
recurring nature, will continue to be made via direct                  electronic payment methods for several years. The
entry until the equivalent functionality for making                    share of government payments made via cheque is
frequent, recurring payments is available in the NPP                   now at a similarly low level as the government
(Fitzgerald and Rush 2020). This is also the case with                 implemented substantial policy changes over the
government payments, where the majority are                            past decade (Table 1).
regular payments made via direct entry and only a
                                                                       Since 2009/10, cheque payments have declined by
very small number of payments are currently
                                                                       more than 85 per cent (Graph 2). The most notable
processed via the NPP (Graph 1).[4]
                                                                       falls were in 2013/14 when the Australian Taxation
Despite the low volumes, it is important to note the                   Office stopped issuing cheques for personal income
NPP has provided significant changes to the                            tax refunds, and in 2016/17 when Medicare stopped
payments landscape in Australia. There is now more                     issuing cheques for paid claims. Instead, these
choice for making payments than ever before and                        payments are now made more quickly via direct
payments are faster and more flexible (Lowe 2019).                     deposits using the direct entry system with cleared
An example of how the NPP is directly benefiting                       funds received in recipient accounts.
Australians was evident during the recent Australian
                                                                       There is general acknowledgement that it will be
bushfires where the government was able to
                                                                       appropriate to wind up the cheque system at some
provide immediate funds to people who were
                                                                       point in the future (Lowe 2019). However, industry
impacted.
                                                                       must provide an alternative payment method for
                                                                       those people who still rely on cheques. It is possible
                                                                       the alternative may be a new payment solution that
                                                                       makes use of the NPP infrastructure.

                                Graph 1
                                                                                                            Graph 2
               NPP Payments by Government
               Agencies Banking with the RBA                                          Cheque Payments by Government
                                                                                       Agencies Banking with the RBA
  '000                                                          '000                                     2009/10 to 2018/19
                                                                              M                                                                             M

    60                                                          60
                                                                             15                                                                             15

    40                                                          40
                                                                             10                                                                             10

    20                                                          20
                                                                              5                                                                             5

     0                                                           0
            Apr    Jul   Oct    Jan   Apr   Jul   Oct   Jan   Apr             0                                                                             0
            18     18    18      19   19    19    19     20   20                        10 / 11       12 / 13        14 / 15        16 / 17       18 / 19
         Source: RBA                                                              Source: RBA

                                                                                                                                    BULLETIN – JUNE 2020                3
T R A N S A C T I O N A L B A N K I N G AT T H E R B A I N E X T R A O R D I N A R Y T I M E S

    System Modernisation                                                                             government programs in response to crises, such as
    Transactional banking services offered by the RBA                                                natural disasters, bushfires or pandemics. To
    have evolved over the years with the emergence of                                                demonstrate the progress made, this section
    new technology and payment capabilities. A key                                                   describes how the government provided urgent
    milestone is the recent completion of the RBA’s                                                  financial relief following some of the country’s
    program of work to upgrade its banking systems                                                   natural disasters.
    and infrastructure. The objective was to migrate                                                 For Cyclone Larry in 2006 and the Black Saturday
    mainframe-based systems to a more contemporary                                                   bushfires in 2009, eligible claimants were provided a
    and flexible platform using modern programming                                                   cashable cheque or authorised claim form in order
    language and architecture. The seven-year upgrade                                                to receive urgent funds. For Cyclone Larry, the
    took place through several major releases and was                                                claimant and a Services Australia staff member had
    completed in August 2019.[5]                                                                     to both be physically present at a bank branch in
    In addition to system improvements, the RBA has                                                  order to complete and authorise the claim before
    also been involved in other projects to adopt new                                                the claim form was presented to the bank teller and
    payment capabilities, including those offered by the                                             cashed. For Black Saturday, the recovery centres
    NPP. Significant effort was devoted to the build, test                                           established near the disaster zones were used by
    and implementation phases to ensure the govern-                                                  Services Australia staff members to issue cheques
    ment was in a position to process and receive                                                    for approved claims, which were negotiated for
    payments using the new platform from day one.                                                    cash at the nearest bank branch or at a mobile cash
    The RBA expects the NPP to provide further                                                       unit trucked into the disaster zone.
    capabilities that can provide efficiencies and other                                             These cash and cheque arrangements were
    benefits for government payments. An example is                                                  cumbersome, inefficient and created security risks.
    the ‘Mandated Payments Service’, which is                                                        As such, the government was frustrated at the lack
    scheduled for early 2022 and is expected to operate                                              of an electronic payment system that would meet
    in a similar way to existing direct debit                                                        the needs of the community in times of disruption.
    arrangements (NPPA 2019).[6]                                                                     This frustration led to Services Australia expanding
    Banking Department has also worked closely with                                                  their use of the RBA’s RTGS service. While RTGS is
    government agencies to support their payment                                                     designed for large value market transactions and
    modernisation initiatives and programs of work.                                                  priced accordingly, there were no technical or legal
    This includes digital transformations that are taking                                            limitations precluding low-value transactions by
    place across the government and providing better-                                                Services Australia. At that time, it was the only
    integrated solutions. One example is the use of                                                  payment system that could provide payments to a
    Application Programming Interface capabilities for                                               beneficiary’s bank account on the same business
    government payments. These capabilities enable                                                   day. In 2009, Services Australia and the RBA
    full integration with government systems,                                                        undertook systems development work to enable
    facilitating real-time payments. The new                                                         Services Australia’s welfare system to generate RTGS
    technologies and 24/7 capabilities introduced by                                                 payments. Later that year, Services Australia was
    the RBA ensures the government can meet the                                                      able to use the RTGS system to make urgent
    growing expectations of the community around                                                     payments during crises as well as urgent welfare
    reliability and speed of payments.                                                               payments in normal times.
                                                                                                     In January 2010, in response to fires in Western
    Crisis and Disaster Relief Payments                                                              Australia and floods in Queensland, Services
    The improvements to the business architecture and                                                Australia used RTGS to make urgent disaster relief
    technologies that underpin the RBA’s banking and                                                 payments; making almost 13,000 payments using
    related payment systems provide greater choice to                                                RTGS on 17 January. While this was a significant
    agencies in the implementation of extraordinary                                                  improvement on cash and cheque payment
                                                                                                     methods, the hours at which the RTGS system

4    R E S E R V E B A N K O F AU S T R A L I A
T R A N S A C T I O N A L B A N K I N G AT T H E R B A I N E X T R A O R D I N A R Y T I M E S
operates restricted Services Australia to business total value of around $163 million approved by
days between the hours of 9.00 am and 4.00 pm Services Australia (Graph 3). Almost one in four
(AEST/DT). At that time, Australia did not have a payments were made via the NPP and only a small
payment system that could deliver funds handful of payments were made via RTGS. It is
electronically and quickly to bank accounts outside worth noting more than 3,600 NPP payments were
of business hours observed on the country’s south- processed on a weekend or public holiday, which is
eastern seaboard. something that was not possible only a couple of
The launch of the NPP in February 2018 addressed years ago. All of these payments were processed
significant gaps within the payments landscape within the existing business as usual payment
including the ability to send funds to bank accounts arrangements.
within seconds – 24 hours a day, 365 days a year.
Services Australia commenced sending emergency Conclusion
welfare payments through the NPP in October The emergence of new payment system capabilities
2018, including Australian Government Disaster has enabled the government to make immediate
Recovery Payments, and has acknowledged the payments at any time on any day. This has made a
service has transformed the way financial assistance difference to many Australians in need of urgent
is provided to people facing emergency situations financial assistance. This was evident during the
(Services Australia 2019). An individual can now see recent Australian bushfire disaster, which affected
the funds in their bank account via their online many households and businesses. The new
banking service or mobile app before leaving the payment infrastructure used to process govern-
Services Australia office or ending their phone call, ment payments has also ensured the seamless
providing a vastly improved experience to those processing of additional stimulus payments relating
most in need. to the COVID-19 pandemic, along with other
regular government payments to support the
The Australian Government also uses the NPP to
community.
make real-time disaster relief payments, including
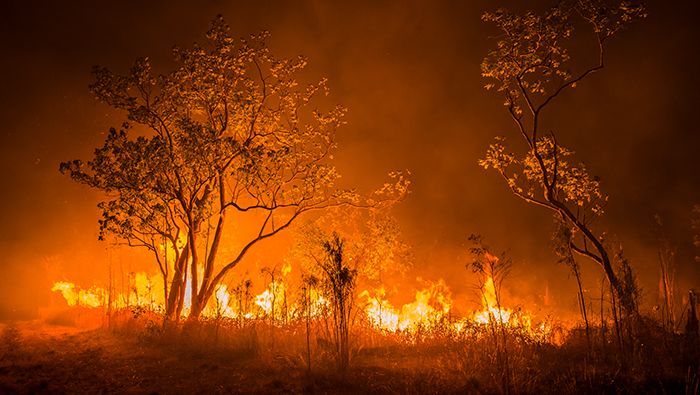
during recent bushfires. The 2019/20 bushfires
caused extensive damage across several Australian
states and territories. More than 10 million hectares
of land were destroyed in southern Australia, which
is greater than the combined area burned in the
Black Saturday and 1983 Ash Wednesday bushfires
(CSIRO 2020). The impact was unprecedented and
widespread with thousands of homes lost,
33 deaths and many communities were severely Graph 3
affected. The bushfire smoke was extensive and 2019/20 Bushfire Disaster
Weekly Payments
caused hazardous air quality levels across New '000 Volumes '000
South Wales, Victoria and the Australian Capital 15 15
Territory, resulting in increased health issues being 10 10
reported. 5 5
The number of bushfire relief payments processed $m Values $m
was much higher than previous natural disasters. 15 15
Payment volumes were more than the total number 10 10
of disaster recovery payments made in the 2018/19 5 5
financial year, which included the far north 0 0
Oct Nov Dec Jan Feb Mar
Queensland floods and Northern New South Wales 19 19 19 20 20 20
bushfires.[7] During this period, the RBA processed Direct Entry NPP
more than 136,000 bushfire relief payments with a Source: RBA
BULLETIN – JUNE 2020 5T R A N S A C T I O N A L B A N K I N G AT T H E R B A I N E X T R A O R D I N A R Y T I M E S
Box: COVID-19
The Australian Government is providing a number of stimulus measures to support households and
businesses during the COVID-19 pandemic, which includes two $750 Economic Support Payments (ESP).
Between 30 March and 29 May 2020, Services Australia paid out close to $5.3 billion during Phase 1 of the
ESP. The highest daily volumes were processed the week before Easter, with ESP payments accounting for
more than 50 per cent of regular payments. Graph 4 demonstrates payments made between 30 March
and 30 April, the period in which most of the Phase 1 payments were made. Similar to previous relief
payments, the RBA’s upgraded systems were able to process the additional payments as part of normal
business activities and deliver payments to people affected by the economic slowdown due to COVID-19.
Graph 4
Economic Support Payments
30 March 2020 to 30 April 2020
M Payment value $b
Payment volume
1.5 1.2
1.0 0.8
0.5 0.4
0.0 0.0
30/03 02/04 07/04 14/04 17/04 22/04 27/04 30/04
Source: RBA
Footnotes
[*] The author is from Banking Department and thanks [4] The increase in NPP payments from December 2019 to
Stephanie Connors and Kristin Langwasser for their March 2020 reflects additional payments processed as
valuable assistance and contributions. part of the Australian bushfire relief.
[1] The provision of these services is consistent with the RBA’s [5] The program’s significance to the government and
responsibilities under the Reserve Bank Act 1959 and are broader community has been recognised at an industry
provided in line with the government’s competitive level, including being awarded a ‘Project of National
neutrality guidelines. This means the RBA competes with Significance’ at the 2020 ITnews Benchmark Awards.
commercial financial institutions for business at tenders. [6] The ‘Mandated Payments Service’ will allow account
[2] Services Australia was formerly known as the Department holders to establish and manage standing authorisations
of Human Services and includes the Centrelink, Medicare (or consents) for payments to be initiated from their
and Child Support programs. account by third parties.
[3] Bank accounts include accounts held at Authorised [7] Based on the number of claims finalised for the Australian
deposit-taking institutions such as banks, credit unions Government Disaster Recovery Payment (Services
and building societies. Australia 2019).
6 R E S E R V E B A N K O F AU S T R A L I AT R A N S A C T I O N A L B A N K I N G AT T H E R B A I N E X T R A O R D I N A R Y T I M E S
References
Caddy J, L Delaney, C Fisher and C Noone (2020), ‘Consumer Payment Behaviour’, RBA Bulletin, March, viewed
27 April 2020. Available at .
CSIRO (2020), ‘The 2019-20 bushfires: a CSIRO explainer’. Available at .
Fitzgerald E and A Rush (2020), ‘Two Years of Fast Payments in Australia’, RBA Bulletin, March, viewed 13 April 2020.
Available at .
Lowe P (2019), ‘A Payments System for the Digital Economy’, Address to the 2019 Australian Payments Network
Summit, Sydney, 10 December.
NPPA (New Payments Platform Australia) (2019), ‘New Payments Platform Roadmap 2019’, October. Available at
.
Services Australia (2019), Annual Report. Available at .
BULLETIN – JUNE 2020 7Economic Effects of the Spanish Flu
James Bishop[*]
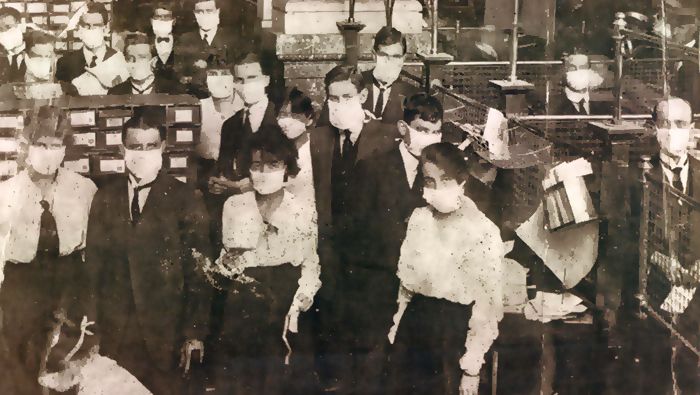
Photo: Reserve Bank of Australia – PN-006877
Abstract
The Spanish flu reached Australia in 1919 and remains the country’s most severe pandemic in
terms of health outcomes. At the peak of the pandemic, sickness due to influenza temporarily
incapacitated 2 per cent of the labour force. However, despite the social distancing measures
used by governments to contain the virus, few job losses in this period were due to a lack of
available work. The labour market also recovered quickly, but it is not clear how relevant this
experience is for the modern economy.
Introduction provides a useful case study, its usefulness is
The outbreak of COVID-19 infections and the tempered by the differences in the economy and its
associated containment measures have significantly institutions in 1919 compared with the same in
affected the Australian economy. When faced with a 2020. Using the Spanish flu period to draw lessons
shock like COVID-19, economists usually look to the on the economic effects of pandemics is
historical record for a guide as to how things might additionally challenging because it also coincided
play out. Although there have been a number of with a period of major economic adjustment after
pandemics since the turn of the 20th century, the the end of the war. I begin by providing a brief
most severe in terms of health outcomes was the overview of the timeline and epidemiology of the
Spanish flu, which began in 1918 and lasted until Spanish flu and the measures used by authorities to
1920. contain the virus.
This article discusses the effects of the Spanish flu
The Spanish flu was less deadly in Australia
on the labour market and GDP in Australia. It does
than other countries
this by analysing the economic data and other
evidence for the period. While the Spanish flu Globally, the Spanish flu pandemic occurred in
three main waves – the first in early 1918, the
8 R E S E R V E B A N K O F AU S T R A L I AE C O N O M I C E F F E C T S O F T H E S PA N I S H F LU
second and most deadly from September 1918 to had multiple waves of infections, although the
January 1919, and the third from February imposition and removal of social distancing
1919 through the remainder of the year.[1] measures is a leading explanation.[3]
Graph 1 shows estimates of mortality rates over Mortality rates for Spanish flu were highest for those
time.[2] According to these estimates, 2.1 per cent of aged 18 to 40. In NSW, more than half of all deaths
the world’s population died from Spanish flu. The were in this age group. This stands in sharp contrast
mortality rates were particularly high in countries to most other influenza pandemics, such as the
with large populations (notably India), which 1891 influenza pandemic (and the current
explains why the ‘weighted’ mortality rate exceeds COVID-19 pandemic), where the majority of deaths
the ‘unweighted’ rate in Graph 1. were in people aged over 60 (Curson and
Because of Australia’s remoteness and rapid McCracken 2014). These differences in the age
quarantine response, it was one of the few distribution of mortality should be kept in mind
countries to avoid Spanish flu during 1918 when attempting to draw parallels between the
(Graph 1). The first case appeared in Melbourne, on labour market implications of Spanish flu to those of
9 or 10 January 1919, before spreading to Sydney COVID-19.
and South Australia by the end of the month
(Graph 2; Graph 3) (National Museum of Australia
2020). In Perth, the combination of the city’s relative
isolation and effective state border quarantine Graph 2
control meant that Spanish flu did not arrive there Flu-related Deaths in Australia
Share of population, annualised, monthly
until June 1919. Similarly, the virus did not reach % %
Tasmania until August. By the end of 1919, the First case in WA
pandemic was over. 0.6 0.6
Some regions experienced multiple waves of First case
in Tas
infections and mortality. For example, Sydney – 0.4
First case in Qld
0.4
which had the highest mortality rate of any
metropolitan area in Australia – experienced two 0.2 0.2
First cases in
waves of the epidemic characterised by rapidly Vic, NSW & SA
rising then falling infections. Epidemiologists 0.0 0.0
M J S D M J S D
continue to debate the reasons why some regions 1918 1919
Source: Commonwealth Bureau of Census and Statistics (1920)
Graph 1
Deaths from Spanish Flu* Graph 3
Share of population
% % Flu-related Deaths in Australia
By state and metro, share of population, 1919
% %
1.0 1.0 0.4 0.4
0.3 0.3
0.5 0.5
0.2 0.2
0.1 0.1
0.0 0.0
World average World average Australia
(unweighted) (weighted)**
0.0 0.0
NSW Vic Qld SA WA Tas NT*
1918 1919 1920
*
Metropolitan areas Rest of state
Estimates based on excess flu and flu-related deaths over 1918–20
** Weighted by population of country * NT did not have a metropolitan area in 1919
Source: Barro e t a l (2020) Source: Commonwealth Bureau of Census and Statistics (1920)
BULLETIN – JUNE 2020 9E C O N O M I C E F F E C T S O F T H E S PA N I S H F LU
The containment measures were similar to department stores. At the same time, sales of
that being implemented today medical drugs and mattresses were surging. The
The economic effects of a pandemic depend in Commercial Appeal (Memphis) was reporting that
large part on the measures used to contain the severe labour shortages were affecting industrial
spread of the virus. Many of those measures output.
implemented during the Spanish flu pandemic are More recent studies released since COVID-19 have
remarkably similar to those used in the current found evidence of large and statistically significant
pandemic. For example, on 28 January 1919 – the effects of the Spanish flu on economic activity. For
day after NSW was proclaimed to be ‘infected’ – all example, Barro et al (2020) found that the Spanish
libraries, schools, churches, theatres, halls and flu reduced real GDP per capita by around
indoor entertainment venues were shut down. Six 6 per cent in the typical country over the period
days later, racecourses and hotels were closed and 1918–21. Correia, Luck and Verner (2020) found that
people on public transport and in public places Spanish flu reduced US manufacturing output by
were required to wear masks. NSW schools 18 per cent, though their findings have been
remained closed throughout February (McQueen challenged (Rinaldi, Lilley and Lilley 2020).
1976).[4] Other states implemented similar measures
The paper by Correia et al (2020) also emphasises
to contain the virus. Movement by public transport
the important link between government
was restricted and state borders were closed. Streets
containment measures and economic outcomes. In
were sprayed with the disinfectant phenyl and the
theory, the economic effects of containment
public were urged to practice cough etiquette,
measures could be positive or negative. They are
regular handwashing, ventilation and disinfection
also hard to separately identify. For example, while
(Curson and McCracken 2014). These travel bans,
containment measures do restrict any economic
quarantine and social distancing measures are
activity that relies on social interactions, many
similar to those used by governments today.[5]
households would have reduced social interactions
While various containment measures were regardless of government intervention in order to
employed, most were not in place for the duration reduce their risk of becoming infected. Furthermore,
of the pandemic, and each state and region had a government restrictions can help solve
different response. For example, in early March ‘coordination problems’ associated with containing
1919 the low rate of infection led NSW authorities the virus, and thus can, in theory, reduce the overall
to assess that the threat had passed and so most economic disruption caused by a pandemic in the
containment measures were lifted (Caley et al 2008). medium term. Interestingly, Correia et al found US
However, these measures were reinstated later in cities that implemented early and extensive
the month following a sharp rise in infections. interventions in response to the Spanish flu
Containment measures then remained in place until experienced stronger economic growth after the
mid May when they were lifted for a second time, pandemic subsided relative to those that did not.
and were not again reinstated despite another wave But as noted above, the accuracy of their
of infections (NSW State Archives & Records 2020). methodology has been questioned by Rinaldi et al
(2020) and further work in this area is needed.
Research on the economic effects is limited In the remainder of the article I discuss the evidence
Research on the economic effects of the Spanish flu on the economic effects of the Spanish flu in
is limited by the lack of economic statistics for this Australia. To do so, I draw on a range economic data
era. Garrett (2008) instead uses historical newspaper and qualitative information from newspapers and
reports to gauge the effects of the pandemic on US government reports from the time.
businesses. The effects were large. For example, the
Arkansas Gazette in October 1918 was reporting a
30 per cent fall in grocery sales and a
40–70 per cent fall in sales at merchants and
10 R E S E R V E B A N K O F AU S T R A L I AE C O N O M I C E F F E C T S O F T H E S PA N I S H F LU
Figure 1 : Newspaper Clipping
Source: ‘Shop Trade Hit’, The Sun, 6 February 1919, p 5, viewed 1 June 2020. Available at .
Newspapers and reports from the time economy (DLISS 1919). The first mention of Spanish
paint a mixed picture about the economic flu was in the March 1919 edition, where it was
effects … reported that there had been a decline in job search
The Victorian factory inspectors’ report for and hiring activity in February that was due in part
1919 paints a mixed picture about the effects of to ‘the restrictive effect on certain industries of the
Spanish flu on manufacturing activity (CIFS 1920). impending epidemic’. Newspapers from the time
Output was reported to be ‘well maintained’ during also reported that retail trade in Sydney was ‘hit
1919 with ‘plentiful’ orders. But it was also reported badly’, with the volume of sales falling by
that 1919 would have been a ‘record year’ had 25–40 per cent for several ‘large, representative’
business not been ‘dislocated’ and ‘progress retailers due to a sharp decline in foot traffic
retarded’ by several factors, one of which was the (Figure 1).[6] Retailers responded by ramping up
Spanish flu. The influenza ‘not only considerably mail order facilities, which were in strong demand
reduced the number of employees temporarily, but due to the epidemic. The entertainment industry
the regulations prescribed to prevent its spread was also affected, with reports that between
restricted the movement of purchasers’. 5,000 and 6,000 cinema employees were ‘thrown
Nonetheless, the report notes that ‘retail out of work’ in metropolitan Sydney due to the
shopkeepers had a very good year’, particularly compulsory closure of cinemas.[7]
those selling high-quality goods. Although the removal of government restrictions in
The NSW Industrial Gazette also painted a mixed early March meant employees could resume work
picture of the effects of influenza on the NSW in cinemas and theatres, restrictions were soon
BULLETIN – JUNE 2020 11E C O N O M I C E F F E C T S O F T H E S PA N I S H F LU
reimposed (Department of Labour and Industry and Labour market impacts
Social Services 1919). In addition, even after the The most reliable source of labour market data for
restrictions were lifted for a second time, voluntary the period are those reported by trade unions to
social distancing by households meant theatres the Commonwealth Bureau of Census and
were ‘playing to half empty houses’.[8] In June, there Statistics.[11]
were some reports of businesses being ‘paralysed’
These data show that the unemployment rate for
by the pandemic, such as in Maitland NSW where
union members rose by 3 percentage points during
offices, shops and factories were ‘practically at a
the Spanish flu (Graph 5). It is likely that most of this
standstill’.[9]
increase was caused by the pandemic. The peak in
There were reports of ‘slackness’ in some trades in unemployment in the June quarter 1919 coincided
mid 1919 due to the influenza, with caterers, with the peak in the flu-related death rate in that
waitresses, jewellers and theatrical employees being year. Moreover, the increase in unemployment
most affected (Department of Labour and Industry during the first half of 1919 was driven by an
and Social Services 1919). On the other hand, it was increase in unemployment due to sickness, which
reported that ‘labour demand exceeded supply’ in the Commonwealth Bureau of Census and Statistics
the construction sector and for female labour in (1922) directly attributed to the flu epidemic. It is
domestic services.[10] While the incapacitation of important to note that the statistics reported by
employees left some firms with labour shortages, trade unions did not require a person to be ‘actively
businesses in some sectors were able to manage seeking work’ and ‘available for work’ in order to be
these labour shortages through greater use of classified as unemployed, in contrast to current ABS
overtime hours. definitions.[12] In the Labour Force Survey (LFS),
people who are not currently in work due to illness
… while quantitative data point to are classified as ‘not in the labour force’ or
reasonably large economic effects ‘employed’ (but working zero hours), depending on
In this section I discuss some quantitative estimates whether they retain their job during their period of
of the effect of Spanish flu on the labour market and illness. All things considered, we should think of this
activity. A complicating factor in this analysis is the rise in ‘unemployment’ due to illness during the
difficulty in distinguishing the effects of the Spanish Spanish flu as a decline in some broader concept of
flu from those of the war. When Spanish flu began labour supply, rather than a rise in the rate of
transmitting through the Australian community in unemployment. At its peak the epidemic appears to
early 1919, the war was well and truly over; have temporarily incapacitated 2 per cent of
however, there were lingering effects of the war on employees.
economic activity. In particular, the Australian
economy was in a period of transition from the
public-led demand growth during the war to Graph 4
private-led growth thereafter. The subtraction from Domestic Final Demand*
$b $b
GDP due to the removal of the wartime stimulus
Private demand
was considerable, and is likely to have had a large 4 4
influence on economic outcomes during the period
in which the Spanish flu was spreading (Graph 4). In 3 3
terms of the labour market, returning veterans also
2 2
needed to be re-absorbed into the labour market Public demand
and it is unclear from the aggregate data how
1 1
smoothly this transition went. Where possible, this
article tries to disentangle the separate effects of 0 0
1902 1906 1910 1914 1918 1922
the Spanish flu from the effects of the war, although * 1966/67 constant prices
Source: Butlin (1977)
in many cases I was not able to do this convincingly.
12 R E S E R V E B A N K O F AU S T R A L I AE C O N O M I C E F F E C T S O F T H E S PA N I S H F LU
Unemployment due to ‘a lack of work’ also rose Differences in the timing of the epidemic across the
during the Spanish flu, contributing 1 percentage states also supports the conclusion that the rise in
point to the overall increase (Graph 5). This at least unemployment (broadly defined) in 1919 was
partly reflects the effect of containment measures mainly due to the Spanish flu rather than other
used by governments, which significantly restricted factors, such as the tapering of wartime stimulus.
economic activity, as well as the effect of the The unemployment rate in the ‘first-infected states’
pandemic on aggregate demand. However, the size (NSW, Victoria and South Australia) peaked one
of this increase in unemployment was very modest quarter before the ‘last-infected states’ (Western
and within the usual range of quarterly changes in Australia and Tasmania), consistent with the timing
the series. Unemployment due to other reasons also of the virus spread (Graph 6). Although the
rose during the pandemic, which may be due to unemployment rate rose sharply, it also fell sharply
more people taking time off work to care for sick once the pandemic abated in late 1919. The speed
relatives (which, again, would be classified as not in of recovery in the labour market and absence of any
the labour force or employed in the LFS). obvious scarring effects is noteworthy.
The muted rise in unemployment owing to a lack of In some industries, Spanish flu also led to industrial
work is surprising given the extent of the social unrest. The Seamen’s Union, whose members lived
distancing responses. It is unclear why this is the in cramped quarters on ships, organised one of the
case. One possibility is that the decline in labour most protracted set of strikes in Australian history in
demand (due to social distancing) was matched by an attempt to improve the safety of their living
a decline in labour supply (due to illness). Another conditions (McQueen 1976). Waterside workers
possibility is that the union survey is not refused to unload ships for fear of infection and
representative of the broader labour market. While some public workers demanded ‘epidemic pay’
the high degree of unionisation meant the survey (Curson and McCracken 2014).
covered half of the total labour force, the sample
was weighted towards industries like building and Effect on GDP
metal trades. Unskilled casual labour, agriculture, The seminal collection of historical GDP data for
and the self-employed were not captured in the Australia is that compiled by Matthew Butlin (1977).
survey (Forster 1965). It is possible that the Butlin’s data suggest that GDP rose by 2¼ per cent
containment measures had a different (i.e. larger) in 1918/19 and fell by 5½ per cent in 1919/20,
effect on those sectors that were not surveyed than which are the two financial years that spanned the
those that were. Spanish flu outbreak in Australia (Graph 7). Average
Graph 5 Graph 6
Unemployment Rate* Unemployment Rate*
By cause of unemployment, quarterly By state
% % % %
8 8 8 8
First-infected states**
6 6 6 6
4 4 4 4
Last-infected states***
2 2 2 2
0 0 0 0
1916 1917 1918 1919 1920 1917 1918 1919 1920
* Union members only
Lack of work Sickness Other
** Vic, NSW and SA (first cases in January 1919)
* Union members only *** WA and Tas (first cases in June and August, respectively)
Source: Commonwealth Bureau of Census and Statistics Source: Commonwealth Bureau of Census and Statistics
BULLETIN – JUNE 2020 13E C O N O M I C E F F E C T S O F T H E S PA N I S H F LU
growth for these two years was similar to that in the A recent study by Barro et al (2020) does a better job
two years leading up to the epidemic. At face value, of controlling for ‘third factors’, and specifically the
this might lead one to think that Spanish flu had a effect of the war. They look at the variation in
small effect on GDP. The strong growth in the years Spanish flu intensity across 42 countries and over
following the epidemic may also lead us to believe time to estimate the effect of the Spanish flu on
that any effects of Spanish flu on the level of output GDP. Their regressions control for the effects of the
were quickly reversed, with the recovery exhibiting war using a variable that captures the intensity of
a ‘V-shaped’ pattern. each country’s participation in the conflict.[13] They
However, we do not know the counterfactual. As find that Spanish flu reduced real GDP per capita by
discussed earlier, it is difficult to isolate the effects of 6 per cent in the typical country. However, applying
the Spanish flu from other shocks, such as the their model estimates to the Australian mortality
removal of the wartime stimulus. Indeed, much of rates implies that the pandemic reduced Australian
the decline in GDP growth during this period is GDP by only ¾ per cent. Their models do not fit the
accounted for by a large subtraction from public data well and it is unclear whether mortality is a
demand, while private demand was resilient good proxy for the disruption in Australia so there is
(Graph 8). significant uncertainty around this estimate.
Overall, the effects of the Spanish flu on Australian
GDP are very hard (if not impossible) to pin down
Graph 7 due to the inability to control for other factors that
Real GDP Growth* influenced economic growth.
Financial-year average
% %
Does this help with our analysis of
10 10 COVID-19?
The Australian economy is markedly different today
0 0 than it was in 1919. In 1919, agriculture and manu-
facturing each accounted for one-quarter of total
-10 -10 employment, compared with 2½ per cent and
7 per cent nowadays. In 1919 the exchange rate
-20 -20
was pegged to the pound sterling and the world
1906 1911 1916 1921 1926
* Spanish flu period shaded
was less globalised. Two-thirds of Australia’s exports
Source: Butlin (1977) were rural and half of all Australia’s exports were to
the United Kingdom. Industrial disputes were
pervasive and most employees were paid award
Graph 8
wages. Female labour supply (in the market sector)
Contributions to Real GDP Growth*
Financial-year average
was far lower than it is today, and the technology to
% %
work from home was obviously far more limited.
20 20 The response of fiscal policy in 1919 was also
different than that used in response to COVID-19. A
10 10
simple measure of the fiscal impact – the change in
the consolidated fiscal balance as a share of GDP –
0 0
suggests that fiscal policy in Australia was broadly
-10 -10 neutral, or slightly contractionary during the
Spanish flu (though this simple metric is distorted
-20 -20 by the war), while being highly expansionary in
1914 1916 1918 1920 1922
Private demand Inventories 2020.[14] Government support for households
Public demand Net exports
* Spanish flu period shaded
during Spanish flu generally took the form of in-
Source: Butlin (1977)
kind transfers of food, blankets, clothing and rent
14 R E S E R V E B A N K O F AU S T R A L I AE C O N O M I C E F F E C T S O F T H E S PA N I S H F LU
assistance, rather than cash transfers (NSW State on GDP will be larger now than in the past. Given
Archives & Records 2020). Support for businesses these many differences, it is unclear how useful
often took the form of partial compensation for Australia’s Spanish flu experience is for the current
losses sustained due to the restrictions, although in situation.
many cases this compensation was paid out many The Spanish flu period highlights how disruptive a
months after the pandemic had passed. pandemic can be to economic activity. In saying
Most importantly, more of household consumption that, and being mindful of how different the
is ‘social’ these days than it was in the past Australian economy is now, the Spanish flu period
(although it was hard to find data on spending and the strong economic growth that followed
patterns in 1919) (Keogh‐Brown et al 2010). Social shows that rapid recoveries from pandemics are
consumption can be more easily postponed or possible if the public health aspects are not too
abandoned relative to the type of consumption prolonged. A surprising feature of the Spanish flu
common in 1919 (e.g. food, housing and clothing). episode was how quickly the labour market appears
All else being equal, a larger share of ‘social’ to have recovered.
consumption in the basket means that any effects
Footnotes
[*] The author is from Economic Research Department. Trade Hit’, The Sun, 6 February 1919, p 5, viewed 1 June
[1] The 1918–19 pandemic is often called the ‘Spanish flu’, not 2020. Available at ).
widely reported there. [7] ‘Showmen’s Troubles’, The Sydney Morning Herald,
[2] These estimates are from Barro, Ursúa and Weng (2020), 29 January 1919, p 11, viewed 1 June 2020. Available at
which draw on many sources and cover more than .
90 per cent of the world’s population in 1918. [8] ‘Our Sydney Letter’, Newcastle Morning Herald and Miners’
[3] The beginning of both epidemic waves in Sydney Advocate, 16 June 1919, p 4, viewed 1 June 2020. Available
followed a lifting of social distancing measures, which has at .
led some epidemiologists to conclude that those [9] ‘Business Paralysed in Maitland’, Singleton Argus, 21 June
measures played an important role in the dynamics of 1919, p 6, viewed 1 June 2020. Available at
infection (Caley, Philp and McCracken 2008). Similar .
conclusions have been drawn using data for US cities, [10] While advertisements for domestic help had earlier called
with studies finding that social distancing measures for a ‘trained nurse’ (who could command any wage), the
during the Spanish flu flattened the curve in the sense of market for domestic help became so tight that requests
reducing peak mortality rates (Bootsma and Ferguson were simply for ‘someone who has some knowledge of
2007; Hatchett, Mecher and Lipsitch 2007; Markel et al household duties’.
2007; Barro 2020). There are other possible explanations
for the two epidemic waves in Sydney, such as seasonal [11] These data are available in the Commonwealth Year Books.
changes in virus transmissibility and multiple circulating Excluded are unions whose members had permanent
viruses (see Caley et al (2008) for a discussion). employment (e.g. rail workers and public servants) or
those employed on a casual basis (e.g. wharf labourers).
[4] In other states, schools were closed for at least part of Although few unions paid unemployment benefits, most
1919 either because of government decree or because kept unemployment registers. A useful discussion of the
teachers were sick. value and reliability of the trade union data is in Forster
[5] The shortage of hospital beds in NSW led to the creation (1965).
of hundreds of temporary hospitals in private houses, [12] According to Forster (1965), to be regarded as
schools, showground buildings, churches, gaols, bowling unemployed in the union reports a person had to be out
clubs, tearooms, drill halls and courthouses. With many of work for three or more days in the specified reference
health workers incapacitated with influenza, these week.
temporary hospitals were often staffed by lay volunteers
(Curson and McCracken 2014). [13] The authors measure war intensity as the ratio of military
combat deaths to total population. Some of the variation
[6] The declines were 30–40 per cent at David Jones and used to identify the effects of the Spanish flu on GDP
25 per cent at Marcus Clark & Co. (department stores) and
Nock & Kirby (hardware and general goods) (source: ‘Shop
BULLETIN – JUNE 2020 15E C O N O M I C E F F E C T S O F T H E S PA N I S H F LU
growth comes from countries that experienced the automatic stabilisers were also not operating very
Spanish flu but were not involved in the war. strongly, as progressive income taxes were a smaller share
[14] The smaller fiscal response during Spanish flu likely of tax revenue (more than half of all revenue was from
reflects the large debt burden accumulated during the indirect taxes like customs and excise duties) and because
war and a lack of understanding about countercyclical 1919 preceded the introduction of unemployment and
fiscal policy (the Spanish flu occurred before Keynesian sickness benefits in the 1940s. The public sector was also a
economic ideas became mainstream in the 1930s). The smaller part of the economy in 1919, with tax revenue
being below 10 per cent of GDP.
References
Barro RJ (2020), ‘Non-Pharmaceutical Interventions and Mortality in U.S. Cities’, NBER Working Paper No. 27049.
Barro RJ, JF Ursúa and J Weng (2020), ‘The Coronavirus and the Great Influenza Pandemic: Lessons from the
"Spanish Flu" for the Coronavirus’s Potential Effects on Mortality and Economic Activity’, NBER Working Paper No.
26866.
Bootsma M and N Ferguson (2007), ‘The Effect of Public Health Measures on the 1918 Influenza Pandemic in U.S.
Cities’, Proceedings of the National Academy of Sciences, 104(18), pp 7588–7593.
Butlin MW (1977), ‘A Preliminary Annual Database 1900/01 to 1973/74’, RBA Research Discussion Paper No 7701.
Caley P, DJ Philp and K McCracken (2008), ‘Quantifying Social Distancing Arising from Pandemic Influenza’, J R Soc
Interface, 5(23), pp 631–639.
CIFS (Chief Inspector of Factories and Shops) (1920), ‘Report of the Chief Inspector of Factories and Shops: For the
Year Ended 31st December, 1919’, Victoria.
Commonwealth Bureau of Census and Statistics (1920), ‘Official Year Book of the Commonwealth of Australia, No.
13. - 1920’.
Commonwealth Bureau of Census and Statistics (1922), ‘Prices, Purchasing-Power of Money, Wages, Trade Unions,
Unemployment, and General Industrial Conditions, 1921’, Labour and Industrial Branch Report, July.
Correia S, S Luck and E Verner (2020), ‘Pandemics Depress the Economy, Public Health Interventions Do Not:
Evidence from the 1918 Flu’, March, unpublished manuscript.
Curson P and K McCracken (2014), ‘An Australian Perspective of the 1918–1919 Influenza Pandemic’, NSW Public
Health Bulletin, 17(7–8), pp 103–107.
DLISS (Department of Labour and Industry and Social Services) (1919), ‘The New South Wales Industrial Gazette’,
XV No. 1 to XVI No 6.
Forster C (1965), ‘Australian Unemployment 1900–1940’, Economic Record, 41(95), pp 426–450.
Garrett TA (2008), ‘Economic Effects of the 1918 Influenza Pandemic: Implications for a Modern-Day Pandemic’,
Federal Reserve Bank of St. Louis Review, 90(2), pp 75–93.
Hatchett RJ, CE Mecher and M Lipsitch (2007), ‘Public Health Interventions and Epidemic Intensity during the
1918 Influenza Pandemic’, Proceedings of the National Academy of Sciences, 104(18), pp 7582–7587.
Keogh‐Brown MR, S Wren-Lewis, WJ Edmunds, P Beutels and RD Smith (2010), ‘The Possible Macroeconomic
Impact on the UK of an Influenza Pandemic’, Health Economics, 19(11), pp 1345–1360.
Markel H, HB Lipman, JA Navarro, A Sloan, JR Michalsen, AM Stern and MS Cetron (2007), ‘Nonpharmaceutical
Interventions Implemented by US Cities During the 1918–1919 Influenza Pandemic’, Journal of the American
Medical Association, 298(6), pp 644–654.
McQueen H (1976), ‘The ‘Spanish’ Influenza Pandemic in Australia, 1912–19’, in J Roe (ed), Social Policy in Australia
– Some Perspectives 1901–1975, Cassell Australia, Stanmore NSW, pp 131–147.
16 R E S E R V E B A N K O F AU S T R A L I AE C O N O M I C E F F E C T S O F T H E S PA N I S H F LU
National Museum of Australia (2020), ‘Defining Moments: Influenza Pandemic’, viewed 1 June 2020. Available at
.
NSW State Archives & Records (The State Archives and Records Authority of New South Wales) (2020),
‘Pneumonic Influenza (Spanish Flu), 1919’, State Archives and Records Authority of New South Wales site, viewed
1 June 2020. Available at .
Rinaldi G, A Lilley and M Lilley (2020), ‘Public Health Interventions and Economic Growth: Revisiting the Spanish
Flu Evidence’, Harvard University Economics Department and Harvard Business School, May, unpublished
manuscript.
BULLETIN – JUNE 2020 17News Sentiment and the Economy
Kim Nguyen and Gianni La Cava[*]
Photo: Allkindza – Getty Images
Abstract
The large and immediate effect of the COVID-19 pandemic on economic activity has increased
the need for more real-time indicators of the economy. This article discusses a new indicator of
`news sentiment’, which uses a combination of text analysis, machine learning and newspaper
articles. The news sentiment index complements other timely economic indicators and has the
advantage of potentially being updated on a daily basis. The news sentiment index captures key
macroeconomic events, such as economic downturns, and typically moves ahead of survey-
based measures of sentiment. Related indicators, such as the news uncertainty index, similarly
help to better understand real-time developments in the Australian economy.
Real-time Economic Indicators and the such as survey-based measures of consumer and
COVID-19 Pandemic business sentiment, as well as financial and labour
Policymakers need to assess the state of the market data. But even these measures are published
economy in a timely manner to devise appropriate with lags of weeks or months, and some rely on
policy responses. The COVID-19 pandemic has samples of the population, which introduces
disrupted daily life and economic activity and its sampling variability.
rapidly evolving nature has increased the need for This article discusses a real-time indicator for the
real-time indicators of the Australian economy. The Australian economy developed using an alternative
most common measure of economic activity, GDP approach based on text analysis of news articles. A
growth, is not observed in real time as it is compiled `news sentiment index’ (NSI) is constructed that
on a quarterly frequency and published with a lag. measures the net balance of positive and negative
Policymakers also closely monitor a range of partial words used by journalists in news articles about the
indicators of the economy that are more timely, economy. In making decisions, consumers and
18 R E S E R V E B A N K O F AU S T R A L I ANEWS SENTIMENT AND THE ECONOMY
business managers are likely to rely on high- Measuring News Sentiment
frequency information that is broadcast through the Sentiment is hard to measure as it is not directly
news media. To the extent that the information in observed. Common survey-based measures of
news media captures a broad audience, it could be sentiment typically ask respondents about their
more representative than survey data provided by beliefs about current economic conditions as well
professional data providers (Thorsrud 2018). This as expectations for future economic conditions. This
indicator can be used to track economic conditions article takes a different approach and constructs a
on a daily basis (Shapiro, Sudhof and Wilson 2017). proxy for sentiment based on the language used by
The text-based approach used in this article is journalists in news reports on the economy.
flexible; not only can it proxy for sentiment but also There are two general approaches for quantifying
the level of uncertainty in the economy. Broadly sentiment in text – the dictionary (or lexicon) and
speaking, ‘sentiment’ captures people’s beliefs the machine learning-based approaches. The
about the mean of the distribution of future dictionary-based approach relies on pre-defined
economic outcomes (the first moment) while lists of words with each word either classified as
‘uncertainty’ captures the variance of people’s positive, negative, neutral, or indicating uncertainty.
beliefs (the second moment) (Haddow et al 2013). The machine learning approach predicts sentiment
There is now extensive research showing that both of any given set of text after training models with a
more negative sentiment and higher uncertainty large set of text that has been assigned sentiment
are associated with lower spending and investment, ratings by human readers. For example, models
and hence can predict weaker economic conditions have been developed using social media data, such
(for example Moore (2017); Bloom (2014); Shapiro, as Twitter, that provide text that is combined with
Sudhof and Wilson (2017); Barsky and Sims (2012); user feedback to identify the sentiment of the posts.
Benhabib and Spiegel (2019)). However, some This approach is better able to capture the nuances
research suggests that survey-based sentiment in human language but it is more complex and less
indicators provide limited new information about transparent.
the state of the economy (Roberts and Simon 2001).
This article follows the simpler dictionary-based
It is possible, though, that alternative sources of
approach to construct an NSI. The NSI measures the
information about sentiment, such as the news
net balance of words used by journalists that are
media, are useful for nowcasting the economy –
considered to be `positive’ and `negative’. When
that is, understanding the present or very recent
journalists use more positive words and/or fewer
past. The news media might offer new information
negative words, this is an indicator that sentiment is
that household and business surveys do not or the
rising in the economy. This type of index has been
same information earlier.
used before for other countries, such as the United
The text-based approach can be extended to States, Japan and Europe (see, for instance, Scotti
develop sectoral measures of both sentiment and (2016); Shiller (2017); Buckman et al (2020); Larsen
uncertainty. This includes estimates of news and Thorsrud (2018); and Fraiberger (2016)).
sentiment for housing markets in each capital city,
The raw data used in constructing the NSI consist of
as well as measures of uncertainty that are more
daily news extracted from the Dow Jones
closely tied to financial markets. The article also
Newswires Archive (DNA). Each article listed in the
presents some novel estimates of sentiment about
database includes metadata such as publication
monetary policy news, which appear to help
time, language, region and category. After
predict changes in the cash rate even after
removing duplicates and selecting only articles that
accounting for other important factors, such as the
are written in English by Australian media outlets to
RBA’s forecasts for the economy.
cover the Australian economy, the resulting dataset
includes around 300,000 articles. The data span the
period from September 1987 to April 2020 and the
BULLETIN – JUNE 2020 19You can also read