CANADIAN JEWISH POPULATION, 2019 - BERMAN JEWISH DATABANK
←
→
Page content transcription
If your browser does not render page correctly, please read the page content below
Berman Jewish DataBank

Canadian Jewish
Population, 2019
                         Number 27 - 2019

                         CURRENT
                         JEWISH
                         POPULATION
                         REPORTS
                         Reprinted from the American
                         Jewish Year Book 2019

Charles Shahar
The Jewish Community     Edited by
Foundation of Montreal   Arnold Dashefsky
                         University of Connecticut

                         Sergio DellaPergola
                         The Hebrew University of
                         Jerusalem

                         Ira Sheskin
                         University of Miami

                         Published by

                         Berman Jewish DataBank

                         in cooperation with

                         Association for the Social
                         Scientific Study of Jewry
DataBank Staff:

                                                       Laurence Kotler-Berkowitz, Director

                                                       Ron Miller, Senior Research Consultant

                                                       Arnold Dashefsky, Director Emeritus and
Berman Jewish DataBank                                 Senior Academic Consultant

A project of The Jewish Federations of North America
                                                       Graphic Designer:
in collaboration with
                                                       Carla Willey
The Berman Jewish Policy Archive @ Stanford

The Center for Judaic Studies and
Contemporary Jewish Life at the                        Berman Jewish DataBank
University of Connecticut                              The Jewish Federations of North America
                                                       Wall Street Station
and
                                                       PO Box 157
The Mandell and Madeleine Berman Foundation            New York, NY 10268

                                                       Web: www.jewishdatabank.org

                                                       Email: info@jewishdatabank.org

                                                       copyright Berman Jewish DataBank 2020
Canadian Jewish Population, 2019

                                             Charles Shahar

                       The Jewish Community Foundation of Montreal

                                           Montreal, Canada

                                  Charles.Shahar@jcmontreal.org

Recommended Citation:

Charles Shahar. “Canadian Jewish Population, 2019,” in Arnold Dashefsky and Ira M. Sheskin. (Editors) The
American Jewish Year Book, 2019, Volume 119 (2019). Cham, Switzerland: Springer, pp. 233-245 (as found
at the Berman Jewish DataBank: www.jewishdatabank.org).
The American Jewish Year Book 2019
     The Annual Record of the North American Jewish Communities Since 1899

This Report derives from Chapter 6 of the American Jewish Year Book, 2019.

The American Jewish Year Book is "The Annual Record of the North American Jewish
Communities Since 1899." This volume is a very important and prestigious annual
publication because it has acted as a major resource for academic researchers,
researchers at Jewish institutions and organizations, practitioners at Jewish institutions
and organizations, the media, both Jewish and secular, educated leaders and lay
persons, and libraries, particularly University and Jewish libraries, for up-to-date
information about the American and Canadian Jewish communities. For decades, the
American Jewish Year Book has been the premiere place for leading academics to
publish long review chapters on topics of interest to the American Jewish community.

                  Obtaining The American Jewish Year Book, 2019

Hard bound and Kindle copies are available at www.amazon.com.
Persons with access to University libraries that offer Springer’s eBook Collection can
obtain a soft cover copy or an electronic copy. In addition, copies at a special bulk
discount are available at www.contemporaryjewry.org in December of each year.

           Table of Contents from the American Jewish Year Book, 2019

                                 Part I: Review Articles

1.   Jews in the United States and Israel: A Comparative Look upon Israel's 70th
     Anniversary (Uzi Rebhun, Nadia Beider, and Chaim I. Waxman)

2.   The Presidential Voting of American Jews (Herbert F. Weisberg)

3.   American Jews and the Domestic Arena: Focus on the 2018 Midterm Elections
     J. J. Goldberg

4.   American Jews and the International Arena (August 2018 - July 2019): The US,
     Israel, and the Middle East (Mitchell Bard)

5.   United States Jewish Population, 2019 (Ira M. Sheskin and Arnold Dashefsky)

6.   Canadian Jewish Population, 2019 (Charles Shahar)

7.   2018 Survey of Jews in Canada: Executive Summary (Robert Brym, Keith
     Neuman, and Rhonda Lenton)

8.   World Jewish Population, 2019 (Sergio DellaPergola)

                                             1
Part II: Jewish Lists

9.   Local Jewish Organizations: Jewish Federations; Jewish Community Centers;
     Jewish Human Service Agencies (Jewish Family Services, Jewish Vocational
     Services, Jewish Free Loans); Directories of Synagogues, College Hillels, and
     Jewish Day Schools; Israeli Embassies and Consulates (Ira M. Sheskin, Arnold
     Dashefsky, and Sarah Markowitz)

10. Jewish Museums and Holocaust Museums, Memorials, and Monuments (Ira M.
Sheskin, Arnold Dashefsky, and Sarah Markowitz

11. Jewish Overnight Camps (Ira M. Sheskin, Arnold Dashefsky, and Sarah Markowitz)

12. National Jewish Organizations (Ira M. Sheskin, Arnold Dashefsky, and Sarah
    Markowitz)

13. Jewish Press: National Jewish Periodicals and Broadcast Media; Local Jewish
    Periodicals (Ira M. Sheskin, Arnold Dashefsky, and Sarah Markowitz)

14. Academic Resources: Programs in Jewish Studies, Holocaust and Genocide
    Studies, Israel Studies, Professorships of Israel Studies, and Jewish Social
    Work; Major Books on the North American Jewish Communities; Academic
    Journals in or about the North American Jewish Communities; Scholarly
    Articles on the Study of the North American Jewish Communities; Websites
    and Organizations for Research on North American Jewish Communities;
    Major Judaic Research and Holocaust Research Libraries (Arnold Dashefsky, Ira
    M. Sheskin, and Pamela J. Weathers)

15. Transitions: Major Events, Honorees, and Obituaries (Ira M. Sheskin, Arnold
    Dashefsky, Ben Harris, Roberta Pakowitz, and Pamela J. Weathers)

              AJYB 2019 was produced with the generous support of:

● The College of Liberal Arts and Sciences at the University of Connecticut (Interim Dean
Davita Silfen Glasberg and Dean Juli Wade)

● Center for Judaic Studies and Contemporary Jewish Life at the University of
Connecticut (Sebastian Wogenstein, Interim Director and Avinoam Patt, Director)

● The Sue and Leonard Miller Center for Contemporary Judaic Studies (Haim Shaked,
Director) and its Jewish Demography Project (Ira M. Sheskin, Director); and The George
Feldenkreis Program in Judaic Studies (Haim Shaked, Director)

● College of Arts and Sciences at the University of Miami (Dean Leonidas Bachas and
Senior Associate Dean Kenneth Voss)

                                           2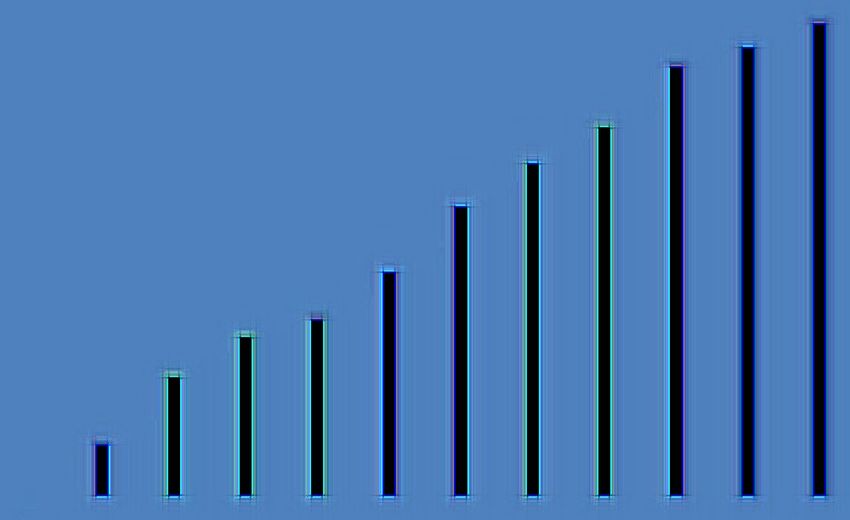
● Provost's Office at the University of Miami (William Scott Green, Senior Vice Provost
and Dean of Undergraduate Education)

● Mandell "Bill" Berman (z"l) and the Mandell and Madeleine Berman Foundation

We acknowledge the cooperation of:

● Berman Jewish DataBank, a project of The Jewish Federations of North America
(Mandell Berman (z"l), Founding Chair; Laurence Kotler-Berkowitz, Director).

● The Association for the Social Scientific Study of Jewry (Leonard Saxe, President)

           For more information about the American Jewish Year Book:

http://en.wikipedia.org/wiki/American_jewish_year_book
http://www.springer.com/series/11193

                                   Citing this Report

Springer is permitting us to post this Report on line with open access, but requests that
the citation be to the American Jewish Year Book itself:

Charles Shahar. “Canadian Jewish Population, 2019,” in Arnold Dashefsky and Ira M.
Sheskin. (Editors) The American Jewish Year Book, 2019, Volume 119 (2019).
Cham, Switzerland: Springer, pp. 233-245.

                                            3
Canadian Jewish Population, 2019
Charles Shahar
The Jewish Community Foundation of Montreal
Montreal, Canada
Charles.Shahar@jcmontreal.org
Recommended Citation:
Charles Shahar. “Canadian Jewish Population, 2019,” in Arnold Dashefsky and Ira M. Sheskin. (Editors) The
American Jewish Year Book, 2019, Volume 119 (2019). Cham, Switzerland: Springer, pp. 233-245 (as found
at the Berman Jewish DataBank: www.jewishdatabank.org).
4Canadian Jewish Population, 2019
For many decades, the census of the Canadian population has provided an important
opportunity to obtain a demographic "snapshot" of the Canadian Jewish community. A
major census is distributed at the start of every decade and contains a wealth of
information related to the social, cultural, and economic characteristics of Canadian Jews.
The two questions used to identify Jews, namely religion and ethnicity, are located on the
census "long-form."
A census is also distributed in the middle of every decade, but it does not contain a
religion question and, therefore, is much less useful for identifying Jews. However, the
most recent mid-decade census (2016) has alarmed those who rely on census data for
gaining important information about Jewish populations in Canada.
“Jewish” was not included as a sample response choice among the 28 ethnic
categories listed as examples in the 2016 Census. Examples were based mostly on the
most frequent single ethnic origins reported in the 2011 National Household Survey.
Unfortunately, the number of ethnic Jews fell below the threshold in 2011.
The omission of the "Jewish" ethnicity sample choice, and the fact that the actual
choices represented only national or aboriginal groups, rather than cultural groups,
resulted in a severe response bias among Jews. The numbers of Canadians who
indicated a Jewish ethnicity diminished by 54% between 2011 and 2016, from 309,650 to
only 143,660 individuals.
This has implications for the next major census in 2021. Although those who will say
they are Jewish by religion will be identified as being Jewish in 2021, there is concern
that those who say they have "no religion," but who may identify as Jews on a cultural
(ethnic) level, may not do so if they do not have a prompt upon which to base their
response.
The number of Jews who say they have no religion has been rising steadily. If the
ethnicity variable is thus compromised, it may be difficult to maintain a definition of
Jewishness that is as inclusive as possible for the 2021 Census, thus limiting the ability
of community leaders and planners to make informed decisions that will ultimately impact
their constituents in profound ways. As of July 2018, discussions are underway with
Statistics Canada to see what options might be available to address this issue.
The current report is based on the 2011 National Household Survey (NHS). Citing
privacy issues, the Federal government decided to make the census long form voluntary
in 2011, and a survey methodology was employed. 1 The 2011 NHS was distributed to
one-third of Canadian households, compared to the 20% who receive the long-form in the
case of the 2001 or 2016 censuses. Whereas the response rate for the census was nearly
universal, it was 73.9% for the NHS. Moreover, because the sample was voluntary, it was
difficult to know whether certain populations were less inclined to respond, such as
economically disadvantaged individuals, the less educated, and recent immigrants. 2
1
Statistics Canada reverted to using a census methodology with a change in national governments in
2015.
2 In the case of Jewish communities, it is possible that the ultra-Orthodox were also under-represented in
the final count.
5Statistics Canada applied rigorous statistical treatments to deal with possible gaps in
the data and assured users that it would only release information if it had confidence in
its reliability. An examination of the final data sets related to Jewish communities, along
with such key variables as poverty and intermarriage, seemed to indicate that the data
did "make sense" in light of statistical trends extrapolated from previous censuses.
Respondents were identified as Jews according to the "Jewish Standard Definition,"
formulated by Jim Torczyner of McGill University in 1971, which used a combination of
religious and ethnic identification. However, because the ethnicity variable has been
slowly eroding in terms of its usefulness in identifying Jews, the Jewish Standard
Definition was revised in 2011 and expanded to include a further set of variables, such
as having an Israeli ethnicity and having knowledge of Hebrew or Yiddish. 3 All in all, this
"Revised Jewish Standard Definition" did not result in a substantial increase to the final
count of Canadian Jews as it only added about 6,300 persons.
Despite the limitations of the 2011 NHS, this instrument nonetheless represents an
important opportunity for academic researchers as well as community leaders and
planners to understand the demographic situation of the Canadian Jewish population
better. We are fortunate to have a national survey that includes questions related to
ethnicity and religion (as the American census does not). 4 Also, the NHS has a much
larger scope than the Canadian Jewish community can undertake on its own. 5
Section 1 Basic Demographics
According to the NHS, the Jewish population of Canada numbered 391,665 persons in
2011. 6 This represented an increase from 2001, when there were 374,060 Jews.
Between 2001 and 2011, the Canadian Jewish population thus increased by 17,605
persons, or 4.7% (Table 1 and Figure 1).
The gain between 2001 and 2011 was slightly larger than that between 1991 and
2001. In the latter decade, the community increased by 14,950 persons, or 4.2%. In short,
at least for the past twenty years, the growth rate of the Canadian Jewish population has
not been remarkable but compares well with growth rates in European countries and also
with the United States.
3 For a more comprehensive description of the erosion of the utility of and the problems associated with
using both the ethnicity and religion variables in identifying Canadian Jews, see Weinfeld and Schnoor
(2015).
4 Specifically, the US Census asks only one ethnicity-related question identifying respondents of Hispanic
or Latino descent. The American Community Survey, an annual demographic study of the US population,
does ask questions on “ancestry” and language spoken at home.
5 The NHS did not ask specific questions such as denominational affiliation, levels of religious
observance, attitudes toward Israel, etc. For these data, the Jewish community needs to develop its own
survey tools.
6 All 2011 NHS data cited in this chapter were derived from Statistics Canada, special order tabulations for
Jewish Federations of Canada - UIA, CO-1421. Most of the descriptions related to the data were adapted
from Shahar (2014a, b, 2015).
6Table 1 Jewish Population of Canada: A Historical Summary
Jewish Change %
Population Change
From
From
Previous
Previous
Census
Census
2011 391,665 17,605 4.7%
2001 374,060 14,950 4.2%
1991 359,110 45,245 14.4%
1981 313,865 27,315 9.5%
1971 286,550 32,182 12.7%
1961 254,368 49,532 24.2%
1951 204,836 36,251 21.5%
1941 168,585 12,819 8.2%
1931 155,766 30,321 24.2%
1921 125,445 50,685 67.8%
1911 74,760 58,267 353.3%
1901 16,493 -- --
Note: 1991 to 2011 are based on the Revised Standard Jewish Definition
described in the methodological discussion above. The rest of the figures
are based on the Jewish Standard Definition (1971 and 1981) or were
derived from either the religion or ethnicity variables individually (1901 to
1961). For information on the Jewish population of Canada from 1851 to
1941, see Rosenberg (1946).
7500
Thousands
392
374
400
359
314
287
300
254
205
200
169
156
125
100
75
16
0
1901 1911 1921 1931 1941 1951 1961 1971 1981 1991 2001 2011
Sources: Statistics Canada
Fig. 1 Growth of the Canadian Jewish population
8A more pronounced increase for the Canadian Jewish community was evident
between 1981 and 1991 when it increased by 45,245 persons, or 14.4%. This is likely
related to the beginning of significant immigration to Canada by Jews from the former
Soviet Union (FSU), and to a lesser extent from South Africa. In fact, this gain of 45,245
persons was the largest increase experienced by the national Jewish population since
the large influx of immigrants in the 1950s.
All in all, the number of Canadian Jews has been rising steadily since the turn of the
past century. In the 1930s, restricted Jewish immigration to Canada slowed some of the
growth experienced in previous decades. Significant levels of immigration then resumed
immediately after World War II.
Jews constituted 1.2% of the total Canadian population of 32.9 million in 2011,
compared to 2.1% for the US (see Chapter 5). The total Canadian population has been
increasing at a faster pace than the Jewish population. For instance, between 1991 and
2011, the Jewish population grew by 9.1%, compared to 21.7% for Canada's total
population.
According to the 2011 NHS, the Jewish community, including single and multiple origin
responses, ranked seventeenth among ethnic groups in Canada. The ten largest ethnic
affiliations were British (6.5 million), Canadian (6.0 million), French (3.7 million), German
(2.4 million), Aboriginal (1.8 million), Chinese (1.5 million), Italian (1.4 million), East Indian
(1.1 million), Ukrainian (1 million), and Polish (644,700). It is noteworthy that the Jewish
population ranked twelfth among ethnic groups in 2001, five rankings above its current
status.
In 2011, the Jewish community ranked seventh with respect to religious identity. The
five largest religious groups in Canada were Catholics (12.8 million), Protestants (8.7
million), Muslims (1.0 million), Christian Orthodox (550,690), and Hindus (497,965).
Almost one-quarter (23.9%) of the total Canadian population, or about 7.9 million
persons, indicated that they had no religious identity. This category included persons who
defined themselves as agnostics, atheists, or humanists or who did not identify with any
religion at all. It is not clear to what extent highly secular Jews said they had no religious
identity. It is thus possible that these individuals were under-represented in the final count
of Jews (unless they indicated a Jewish ethnicity).
Finally, the Canadian Jewish community was the fourth largest Jewish community in
the world in 2012 (using the year closest to the Canadian census, but see Chapter 8 for
current figures). Israel had the largest Jewish population followed by the US, France
(480,000), and Canada (391,665). The Jewish populations of the United Kingdom and
the Russian Federation numbered 291,000 and 194,000, respectively.
The Canadian Jewish community constituted 2.8% of the total 13,746,100 Jews in the
world in 2012 and 5.0% of the 7,845,000 Jews living in the Diaspora in 2012. The Jewish
population of Canada comprised 6.8% of the Jews residing in North America.
9Section 2 Provincial and Metropolitan Population Distributions
Table 2 and Map 2 show the distribution of Jewish populations across provinces and
territories. More than half (57.9%, or 226,610 persons) of Jews in Canada reside in
Ontario.
Quebec has 93,625 Jewish residents and about a quarter (23.9%) of the total Jewish
population of Canada. British Columbia has 35,005 Jews, or 8.9% of the total Jewish
population of Canada.
All other provinces have less than 5% of the national Jewish population. Alberta has
15,795 Jewish residents, or 4% of the country’s Jewish population. Manitoba has 14,345
Jews, or 3.7% of the total. The Atlantic Provinces have 4,175 Jews, or 1.1% of the
country’s total Jewish population. Saskatchewan has 1,905 Jews, or 0.5% of the country’s
total.
There are 145 Jews in the Yukon, 40 in the Northwest Territories, and 20 in Nunavut.
Although these last numbers are small, it is nonetheless instructive that Jews populate
every region of the country, including the northern territories.
Table 3 and Map 1 present the 20 largest Jewish communities in Canada, which
account for 95% of Canada’s Jewish population. The Toronto metropolitan area is home
to 188,710 Jews and includes about half (48.2%) of Canada's Jewish population. The
Montreal community numbers 90,780 Jews and constitutes about a quarter (23.2%) of
the Jewish population of Canada. Vancouver has a Jewish population of 26,255,
representing 6.7% of the national Jewish population.
The rest of the Jewish communities in Canada each number less than 15,000 persons.
For instance, Ottawa has 14,010 Jews, Winnipeg has 13,690, Calgary has 8,335,
Edmonton has 5,550, and Hamilton has 5,110.
Section 3 Focus on the Age of the Jewish Population
The Canadian Jewish population has a somewhat larger proportion of children (age 0-14)
than the total population (18.2% and 17.0% respectively). The Jewish population has a
similar percentage in the age 15-24 cohort compared with the total Canadian population
(13.4% and 13.2% respectively).
In the economically productive age 25-44 cohort, the discrepancy between the two
distributions is more marked. Less than a quarter (23.5%) of Jews fall into this age cohort,
compared to 26.7% of Canada’s total population. The Jewish community also has a
somewhat smaller proportion in the age 45-64 cohort than the overall Canadian
population (28.0% and 29.3% respectively).
Finally, a comparison of the two age distributions shows that the Jewish community
has a significantly larger proportion of persons age 65 and over (16.9%) than the total
Canadian population (13.9%).
10Table 2 Jewish Population Distribution: Provinces & Territories
% of
Province / Territory Jewish Canadian
Population Jewish
Population
Nova Scotia 2,910 0.8%
New Brunswick 860 0.2%
Newfoundland/Labrador 220 0.1%
Prince Edward Island 185 0.0%
(Total Atlantic
(4,175) (1.1%)
Canada)
Quebec 93,625 23.9%
Ontario 226,610 57.9%
Manitoba 14,345 3.7%
Saskatchewan 1,905 0.5%
Alberta 15,795 4.0%
British Columbia 35,005 8.9%
Yukon 145 0.0%
Northwest Territories 40 0.0%
Nunavut 20 0.0%
Total Canada 391,665 100.0%
11Table 3 Twenty Largest Canadian Jewish Communities
% of
Jewish Canadian
Metropolitan Area / Province
Population Jewish
Population
Toronto, ON 188,710 48.2%
Montreal, QC 90,780 23.2%
Vancouver, BC 26,255 6.7%
Ottawa, ON 14,010 3.6%
Winnipeg, MB 13,690 3.5%
Calgary, AB 8,335 2.1%
Edmonton, AB 5,550 1.4%
Hamilton, ON 5,110 1.3%
Victoria, BC 2,740 0.7%
London, ON 2,675 0.7%
Halifax, NS 2,120 0.5%
Kitchener / Waterloo, ON 2,015 0.5%
Oshawa, ON 1,670 0.4%
Windsor, ON 1,515 0.4%
Barrie, ON 1,445 0.4%
St. Catharines-Niagara, ON 1,375 0.4%
Kingston, ON 1,185 0.3%
Guelph, ON 925 0.2%
Regina, SK 900 0.2%
Kelowna, BC 900 0.2%
Total 94.9%
12Number of Jews
! < 1,000
Yukon Territory
!
! 1,000 - 4,999
145
! 5,000 - 9,999
Northwest Territories ! 10,000 - 24,999
40
Nunavut
! 25,000 +
20
British Columbia
35,005 Newfoundland and Labrador
220
Alberta
15,795
Edmonton
Saskatchewan Manitoba
!
Vancouver 1,905 14,345 Quebec
26,255
93,625
!
!
! Kelowna
!
Calgary
!
Ontario Prince Edward Island
Victoria
Regina 226,610 New Brunswick 185
! 860 Halifax
Winnipeg
!
! Montréal
!
Nova Scotia
90,780 2,910
Ottawa !
Toronto !
188,710 ! ! Kingston
Barrie !!
! Oshawa
!
!
Guelph
Kitchener - Waterloo ! ! Saint Catharines - Niagara
!! ! !
London !! Hamilton
Windsor !
!The median age of the national Jewish population is 40.5 years, slightly higher than
that of Canada’s overall population (40.1 years) but a bit lower than the median age of 42
for US Jews, based on the 2000-01 National Jewish Population Survey. Ethnic groups
with the oldest median ages include the British (48.7 years), Americans (45.9 years),
French (44.8 years), Germans (40.7 years), Jews (40.5 years), Greeks (40.4 years), and
Poles (40.3 years). These ethnic groups generally involve older, more established
communities whose peak periods of immigration to Canada have long passed. Since
there has not been a large influx of recent immigrants among these groups, their median
ages remain at fairly high levels.
The youngest median ages were reported by the Pakistani (26.0 years), African (27.9
years), Aboriginal (28.4 years), Arab (29.3 years), Latin American (30.1 years), Caribbean
(31.2 years), and Korean (33.7 years) communities. Most of the latter populations have a
large number of more recent immigrants, many of whom settled in Canada in the past two
decades. This infusion of people, often involving younger families, has revitalized these
communities and has kept their median ages lower than the rest of the population.
Section 4 Focus on Sephardim7
The term "Sephardim" initially referred to Jews living in Spain, who were expelled during
the "Inquisition" in the 1490s. The term now refers to descendants of those Jews, who
ultimately settled in areas such as North Africa, Holland, England, Turkey and the
Balkans, and who originally spoke Judeo-Spanish languages. It also refers to Jews who
were connected to the Judeo-Spanish culture before the Inquisition, and lived in Arab
countries and Iran, where they spoke a variety of Judeo-Arabic and Judeo-Persian
languages.
The Sephardic community of Canada comprises 36,040 individuals. In fact, Canada
has the seventh largest Sephardic community in the world, following those of Israel,
France, United States, Argentina, Brazil and Spain. The rich cultural heritage of
Sephardim has contributed to the intricate fabric of the Jewish community in Canada,
particularly in Montreal.
The Sephardic community in Montreal has a long history. In the late eighteenth
century, Sephardim were among the first Jews to settle in the province of Quebec. The
oldest surviving synagogue in Montreal, the Spanish and Portuguese Congregation, is of
Sephardic origin. It was founded in 1768, and was the first such congregation in Canada.
The most significant period of Sephardic immigration began following the 1967 Six
Day War between Israel and its Arab neighbors. A large influx of Sephardim, mostly from
Morocco, settled in Montreal between 1967 and 1987. More recent Sephardic immigrants
have come mainly from Israel and Western Europe.
Since many speak French as their mother tongue, and this is the dominant language
of the province of Quebec, Sephardim have generally adjusted well to life in Montreal.
Jews of Sephardic origin occupy key positions of leadership and influence in the Jewish
7 Previous foci have appeared in the American Jewish Year Book 2018 (Shahar 2019) on “Seniors”, in the
American Jewish Year Book 2017 (Shahar 2018) on “Poverty”, in the American Jewish Year Book 2016
(Shahar 2017) on “Holocaust Survivors”, and the American Jewish Year Book 2015 (Shahar 2016) on
“Intermarriage.”
14community, have developed thriving businesses, and enjoy political representation in the
general community.
There are 22,225 Sephardim residing in the Montreal metropolitan area. Sephardim
comprise 24.5% of the 90,780 members of the Montreal Jewish community. There are
also 715 individuals of mixed (Sephardic and Ashkenazi) extraction living in Montreal.
The Sephardic community has been on the ascendancy since their arrival in greater
numbers to Montreal in the late 1960s. However, their increases slowed somewhat
between 2001 and 2011, when there was a gain of only 1,000 individuals. On the other
hand, the Ashkenazi population declined by 3,380 individuals in that decade, and
contributed to an overall decline of 3% in the Jewish population of Montreal. An influx of
Jewish immigrants from France in recent years may change the composition of Montreal
Jewry somewhat if it continues.
The largest Sephardic age cohort is middle-aged adults between 45-64 years of age
(5,570 individuals). Many of those between 45-64 years represent the children of
Sephardim who immigrated to Montreal in the late 1960s and throughout the 1970s.
There is also a significant representation of Sephardim in the 25-44-year age group
(5,315 individuals).
About one in five Sephardim (20.4%) are seniors, or 4,540 individuals. As large
numbers of middle-aged Sephardim enter their senior years, the proportion of elderly will
likely increase significantly.
There are 9,735 Canadian-born Sephardim living in Montreal, comprising 43.8% of
the Sephardic community. The rest of the Sephardic population (56.2%) are immigrants.
More than a quarter (28.3%) of Sephardim were born in Morocco, followed by France
(7.6%) and Israel (6.4%).
The percentage of adult Sephardim that have a university degree has increased
significantly from 35.7% in 2001 to 45.7% in 2011.
There are 4,080 Sephardim living below the poverty line in the Montreal metropolitan
area, or 18.4% of the total Sephardic population. 8 The poverty level among Sephardim is
lower than that of the rest of the Jewish community (20.5%).
Those who are particularly vulnerable to poverty include Sephardic seniors living
alone (47.7%); Sephardic adults between 15-64 years living alone (47.3%); and
Sephardim living in female single parent families (32.7%).
Section 5 Focus on a Community: Winnipeg9
Winnipeg has the fifth largest Jewish community in Canada, comprising 3.5% of the
country’s Jewish population. It was recently surpassed by Ottawa in terms of the size of
its Jewish population.
8
The “poverty line” in this report refers to the low-income cutoff (LICO), which is defined by Statistics
Canada as “an income threshold at which families are expected to spend 20 percentage points more than
the average family on food, shelter and clothing.”
9 The corresponding chapter in the previous American Jewish Year Book 2018 (Shahar 2019) focused on
Ottawa, on Greater Vancouver in the American Jewish Year Book 2017 (Shahar 2018), on Toronto in the
American Jewish Year Book 2016 (Shahar 2017) and on Montreal in the American Jewish Year Book 2015
(Shahar 2016).
15The community has faced a number of challenges in the last few decades, including
a steadily declining Jewish population since its peak in 1961 of 19,376 Jews. Other
challenges include a burgeoning elderly cohort; and the fact that the community is more
spread out than ever before, straining the reach of its service delivery.
Despite these challenges, the Winnipeg community has a long history of Jewish
commitment and affiliation. The variety and availability of Jewish services in Winnipeg
are those usually found in considerably larger communities. Several community
initiatives, particularly related to immigration, have been launched in the last two
decades. The result is an increasingly diverse population as evident in the cultural
makeup and orientations of community institutions.
In 2011, the Jewish population of Winnipeg was 13,690. Jews comprised 1.9% of
Winnipeg’s total population of 714,640.
The Jewish population figure for 2011 represented a loss from 2001, when there were
14,820 Jews in this metropolitan area. Between 2001 and 2011 the Jewish population
declined by 1,130 people, or 7.6%
The population loss between 2001 and 2011 was somewhat greater than between
1991 and 2001. In the latter decade, the community declined by 415 people or 2.7%. The
current decline is also a little more significant than the one experienced between 1981
and 1991, when the community decreased by 935 people or 5.8%.
All in all, the demographic trends suggest that the Jewish population is continuing to
decrease. This is perhaps surprising given the level of Jewish immigration to Winnipeg in
the last decade, particularly from individuals originating in the former Soviet Union, Israel
and Argentina. Sources from the organized community suggest that the great majority of
these newcomers have remained in Winnipeg and have planted their roots there.
Regarding the age distribution of the Winnipeg Jewish community, after showing a
very dramatic loss between 1991 and 2001, the 25-44-year age group continued to
decrease in the last decade, from 3,210 to 2,915 individuals.
The 45-64-year cohort remained at about the same level between 2001 and 2011,
after demonstrating dramatic gains in the previous decade. This cohort represents the
Baby Boomer generation.
The number of seniors 65+ years continued to decline in the last decade, from 3,180
to 2,580 individuals. On the other hand, the local Jewish community has a much larger
proportion of elderly (18.8%) than Winnipeg’s total population (13.1%). In fact, Winnipeg
has the second highest percentage of seniors of any major Jewish community in Canada,
behind only Montreal (20.4%).
The median age of the Winnipeg Jewish community actually decreased between 2001
and 2011, from 44.4 years to 43.1 years, but it is still significantly older than that of the
Canadian Jewish population (40.5 years).
There are 2,000 Jews living below the poverty line in the Winnipeg metropolitan area.
The poor comprise 14.6% of a total population of 13,690 Jews residing in the local
community.
The level of poverty among children 0-14 years in the Winnipeg Jewish population is
20.2%, almost double the rate found in 2001. There are 470 children in the local Jewish
community who live in economically disadvantaged circumstances.
Almost one of seven elderly Jews (65+ years) is poor, but senior women are
significantly more likely to be disadvantaged than men (20.8% and 4.7% respectively).
16In terms of the intermarriage rate, 25.4% of Jewish spouses / partners are married to,
or partnered with, non-Jews in the Winnipeg metropolitan area.
The intermarriage rate among Winnipeg’s Jewish population (25.4%) is slightly lower
than that of the Canadian Jewish population (26.3%). Although the intermarriage rates of
Jewish communities across Canada generally increase as one moves westward, the
Winnipeg community is an exception, likely because it has a long history of Jewish
commitment and affiliation.
In cases where both spouses are less than 30 years of age, the level of intermarriage
is a striking 75.6%; although the small number of Jewish couples in this age group
suggests that this figure should be interpreted with caution, as sampling error may
account for this finding. It is 19.4% when both spouses are at least 40 years old.
Regarding the youngest children of intermarried couples, about a quarter (26.7%) are
identified by their parents as Jews; about half (55.3%) are assigned no religious affiliation;
and the rest (17.9%) are identified as having other religions. Whether it is the husband or
the wife who is of the Jewish faith has a significant bearing on the religious orientation of
their children, with the latter being much more inclined to be identified as Jewish if the
mother is identified as such.
Section 6 Summary
The Canadian Jewish population has seen only modest growth in the past twenty years,
following a more significant increase between 1981 and 1991. The latter decade
coincided with the beginning of significant immigration by Jews from the FSU. Jews reside
in every region of Canada, including the Northern Territories, although they are
concentrated heavily in the major urban centers. The metropolitan area of Toronto is
home to 188,710 Jews and includes about half (48.2%) of Canada's Jewish population.
The Montreal community numbers 90,780 Jews. The median age (40.5 years) of
Canadian Jews is slightly older than the national average but much older than ethnic
groups with large numbers of more recent immigrants.
There are 36,040 Sephardim living in Canada with the majority residing in Montreal
(22,225). The Sephardic population in Montreal has been on the ascendancy since a
large influx arrived in the late 1960s. However, this growth has slowed recently, with a
gain of only 1,000 individuals between 2001 and 2011. The percentage of Sephardic
seniors is expected to increase significantly as the Baby Boomers turn elderly. More than
half (56.2%) of Sephardim residing in Montreal are immigrants and more than a quarter
(28.3%) were born in Morocco.
Winnipeg has the fifth largest Jewish community in Canada, comprising 3.5% (13,960)
of the country’s Jewish population. It was recently surpassed by Ottawa in terms of the
size of its Jewish population. The community has faced a number of challenges in the last
few decades, including a steadily declining Jewish population since its peak in 1961 of
19,376 Jews. Other challenges include a burgeoning elderly cohort; and the fact that the
community is more spread out than ever before, straining the reach of its service delivery.
Despite these challenges, the Winnipeg community has a long history of Jewish
commitment and affiliation.
17References
Rosenberg, L. The Jewish population of Canada, A statistical summary from
1851 to 1941 in American Jewish year book 1946, ed. H. Schneiderman
and J. Maller, vol. 48, 19-50. New York: American Jewish Committee.
Shahar, C. 2014a. 2011 National Household Survey analysis: The Jewish
population of Canada. In Part 1: Basic demographics and Part 2: Jewish
populations in geographic areas. Toronto: Jewish Federations of Canada –
UIA. See: www.jewishdatabank.org.
———. 2014b. 2011 National Household Survey analysis: The Jewish
community of Winnipeg. In Part 1: Basic demographics and Part 2: Jewish
populations in geographic areas. Toronto: Jewish Federations of Canada –
UIA. See www.jewishdatabank.org.
———. 2015. 2011 National Household Survey analysis: The Jewish
community of Montreal. In The Sephardic Community. Toronto: Federations
of Canada – UIA. See www.jewishdatabank.org.
———. 2016. Jewish population of Canada, 2015. In American Jewish year book 2015,
ed. A. Dashefsky and I.M. Sheskin, vol. 115, 261–271. Dordrecht: Springer.
———. 2017. Canadian Jewish population, 2016. In American Jewish year book 2016,
ed. A. Dashefsky and I.M. Sheskin, vol. 116, 241–251. Dordrecht: Springer.
———. 2018. Canadian Jewish population, 2017. In American Jewish year book 2017,
ed. A. Dashefsky and I.M. Sheskin, vol. 117, 285–295. Dordrecht: Springer.
———. 2019. Canadian Jewish population, 2018. In American Jewish year book 2018,
ed. A. Dashefsky and I.M. Sheskin, vol. 118, 349–360. Dordrecht: Springer.
Weinfeld, M., and R.F. Schnoor. 2015. The demography of Canadian Jewry, the
“census” of 2011: Challenges and results. In American Jewish year book
2014, ed. A. Dashefsky and I.M. Sheskin, vol. 114, 285–300. Dordrecht:
Springer.
18You can also read