Cancro della mammella - Prof. Fabrizio Stracci Dip. Medicina Sperimentale
←
→
Page content transcription
If your browser does not render page correctly, please read the page content below
Cancro della mammella
Prof. Fabrizio Stracci
Dip. Medicina Sperimentale

Epidemiologia del carcinoma della
          mammella

  Incidenza ↑        Severità ↘   Mortalità ↘

Fattori di rischio   Screening    Trattamento

   Screening                       Screening
Prima causa di morte per tumore
  maligno nel sesso femminile

Primo tumore
per frequenza

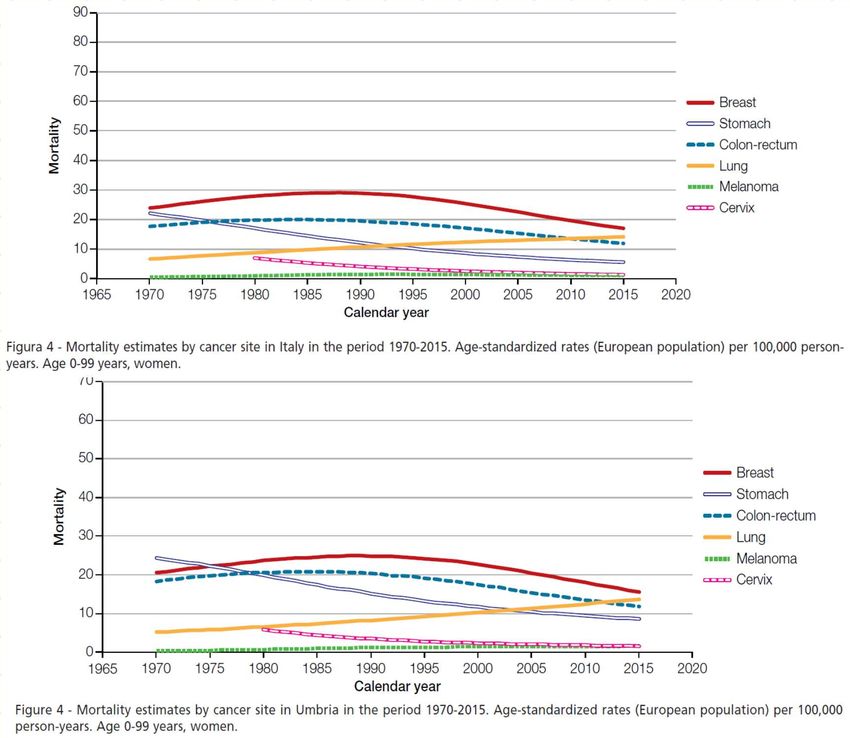
Incidenza del cancro della mammella
         (GLOBOCAN 2012)
                     Breast cancer is the second
                     most common cancer in the
                     world and, by far, the most
                     frequent cancer among
                     women with an estimated
                     1.67 million new cancer
                     cases diagnosed in 2012
                     (25% of all cancers).
                     It is the most common cancer in
                     women both in more and less
                     developed regions with slightly more
                     cases in less developed (883,000
                     cases) than in more developed
                     (794,000) regions
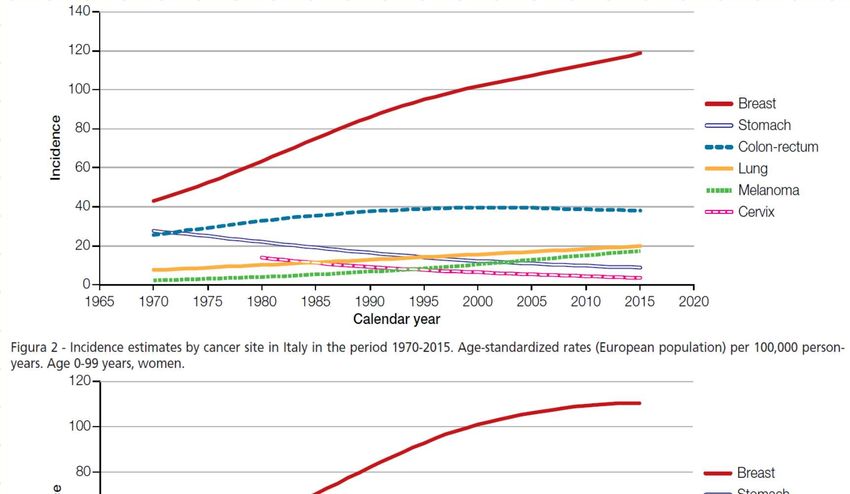
Trend di incidenza in
    alcuni paesi
Mortalità per cancro della mammella
                  Breast cancer ranks as the fifth
                  cause of death from cancer
                  overall (522,000 deaths)
                  Although breast cancer incidence remains
                  highest in more developed countries
                  (500,000 new cases registered in WHO
                  European Region compared with 100,000
                  cases in Africa), mortality is
                                           relatively
                  much higher in low-income
                  countries because of late
                  diagnosis and insufficient
                  effective treatment.
                  While it is the most frequent cause of
                  cancer death in women in less developed
                  regions (324,000 deaths, 14.3% of total), it
                  is now the second cause of cancer death in
                  more developed regions (198,000 deaths,
                  15.4%) after lung cancer.
Incidenza in Italia (in alto) e Umbria (in basso)

Mortalità in Italia (in alto) e Umbria (in basso)
Un problema di dimensioni crescenti
• The current lifetime risk of a woman developing
  breast cancer in the US is estimated to be one in
  eight (12.3%), which is an increase compared to
  the one in eleven (9.09%) lifetime risk in the
  1970s.
• This apparent increase is believed to result from
  – longer life expectancy,
  – increased detection through sensitive screening
    methods,
  – changes in reproductive patterns, and an increasing
    prevalence of obesity
Fattori di rischio Global cancer patterns: causes and prevention. Vineis P, Wild C. Lancet 2014 Reproductive factors … Increases in breast cancer in low-HDI countries will be largely due to changes in reproductive practices, with women choosing to have fewer children, have their first pregnancy later in life, and breastfeed for a shorter period. Diet, obesity, and physical inactivity • Obesity is a risk factor for breast (post-menopausal), colorectal, endometrium, kidney, oesophageal, and pancreatic cancers. • Alcohol is associated with liver, upper aerodigestive tract, breast, and colorectal cancers. • Low physical activity is a major risk factor for colon, breast, and endometrial cancers, both indirectly through its effect on body-mass index (BMI), and directly through other, only partly understood, mechanisms
Strategie di prevenzione
• Risk factors are inherited, histopathologic or
  environmental, each of which is important.
• Strategies to decrease environmental risks generally
  focus on directly addressing the environmental factor,
• whereas genetic and histopathologic risks, which
  cannot so easily be altered directly, are addressed
  indirectly, such as through altering known drivers to
  breast cancer, such as estrogen and its receptor through
  chemoprevention, or by surgical extirpation of the
  organ(s) at risk.
• Mammographic breast density (MBD) also influences
  breast cancer risk. MBD is appears to be influenced by
  genetics (4), age and body mass index (5).
Terapia ormonale sostitutiva

The WHI started HT treatment on women aged
50-79 years in order to ascertain these effects.
The study was ended early, due to findings of
increased risk of coronary heart disease, breast
cancer, stroke, and thromboembolic
complications in women receiving estrogen plus
progestin, compared to placebo.
Solo estrogeni

Anderson et al. found a 23%
reduction in the incidence of
invasive breast cancer with ET
compared with placebo (151 cases,
0.27% per year versus 199 cases,
0.35% per year) during an overall
follow-up period of nearly 12 years.
Conjugated equine oestrogen and breast
cancer incidence and mortality in
postmenopausal women with hysterectomy:
extended follow-up of the Women’s Health
Initiative randomized placebo-controlled trial,
Lancet Oncol 13 (2012) 476–486
Terapia ormonale e incidenza
• There was a sharp decrease in breast cancer incidence
  … in the United States, evident in white women 50
  years of age and for estrogen receptor (ER) positive
  tumors. This has been attributed to the reduced use of
  hormone replacement therapy (HRT) after the July
  2002 publication from the Women’s Health Initiative
• Following the sharp decrease, it was reported that a
  decreasing trend continued into 2005
• The most recent publications observed that the
  decline in cancer incidence ceased and the rate
  stabilized from 2004 to 2008 , with ER-positive breast
  cancer being projected to increase
A trend analysis of breast cancer incidence rates in the United States from
2000 to 2009 shows a recent increase. Hou N1, Huo D. Breast Cancer Res
Treat. 2013;138:633-41.
Chemoprevenzione
• Based on the NSABP-P1, the NNT with daily tamoxifen for
  more than 5 years to prevent one case of breast cancer is 48
  women;
• Recently, a meta-analysis based on individual participant
  data from nine randomized prevention trials using tamoxifen,
  raloxifene, arzoxifene, and lasofoxifene was reported.57
• Overall, a 38% reduction in the incidence of breast cancer
  (including DCIS) was noted (HR =0.62; 95% CI: 0.56 to 0.69),
  with the largest reduction in the first 5 years of follow-up
  compared to years 5 to 10…No effect was noted on ER-
  negative breast cancers

• A recent meta-analysis of seven observational studies
  demonstrated a protective effect of metformin on breast
  cancer risk in postmenopausal women with diabetes
  (combined OR =0.83; 95% CI: 0.71 to 0.97).64
        Advani et al. Current strategies for the prevention of breast cancer 2014
Limited use of chemoprevention Possible explanations for the limited use of chemopreventive agents include: • difficulty in identifying the ideal candidates for chemoprevention strategies; • decreased awareness among high-risk women and health care providers; • concerns about adverse effects of the agents; and their impact on quality of life in the absence of a diagnosed cancer. Identifying the optimal candidates for chemoprevention strategies continues to be challenging, as the existing breast cancer risk-assessment models do not incorporate all known risk factors, such as alcohol intake, use of oral contraceptive pills, density of breast tissue, and history of radiation exposure.
Programmi di screening nel
  carcinoma mammario
Test di screening
• Si basano sulla visualizzazione delle lesioni:

• Mammografia (digitale)

• Ecografia
• RMN

• Test di conferma: biopsia /citologia
Bersaglio del test
• Principali lesioni identificate: cancro in fase
  precoce

• Effetto sulla frequenza di malattia: aumento
  dell’incidenza
   – Transitorio in corrispondenza dell’introduzione
   – Durevole in caso di sovra-diagnosi
Lesioni identificate e conseguenze
• Carcinomi infiltranti in fase precoce (mammella,
  colon retto, melanoma, prostata)
• Carcinomi in situ – lesioni pre-maligne (cervice
  uterina, colon retto, mammella)

• Effetto della individuazione di carcinomi in fase
  precoce è l’aumento della sopravvivenza
• Effetto della individuazione di lesioni premaligne
  evolutive è la riduzione della incidenza
Strategia di screening
• Organizzato:
• Popolazione bersaglio (prevalentemente 50-69
  anni)
• Opportunistico (non ha limiti definiti di età)

• Misto
• presenza di screening opportunistico dove è
  attivo uno screening organizzato
Screening mammografico dati
     studio PASSI 2012
Lo screening di popolazione
Table 6.1 . Defining criteria for organized screenings according to Hakama and colleagues
• a. The target population has been identified; +
• b. individual people are identifiable; +
• c. mechanisms are implemented to guarantee high coverage and attendance (e.g., a
personal letter of invitation); +
• d. there are adequate field facilities for performing the screening tests; +
• e. there is a defined quality control program concerning how the tests are performed
and interpreted; +
• f. adequate facilities exist for diagnosis and for the appropriate treatment of confirmed
abnormalities; +
• g. there is a carefully designed and agreed upon referral system, an agreed link
between the participant, the screening center, and the clinical facility for diagnosis of
an abnormal screening test, for management of any abnormalities found, and for
providing information about normal screening tests; and
• h. evaluation and monitoring of the total program is organized in terms of incidence
and mortality rates among those attending, among those not attending, at the level of
the total target population. Quality control of the epidemiologic data should be
established.
Hakama M, Chamberlain J, Day NE, Miller AB, Prorok PC (1985). Evaluation of screening
26
programmes for gynaecological cancer. Br J Cancer 52,669 – 673.Certezza • Lo screening mammografico è attualmente molto diffuso • In Europa, Italia inclusa, è frequente la strategia di screening organizzato (programmi di screening) – Popolazione bersaglio: donne 50-69 anni • Coesiste screening opportunistico nelle fasce d’età =70 (strategia mista) ma anche nella fascia screening
Indagine PASSI 2010-12
                          Umbria

            SSR
Figura 3. Mammografia eseguita negli ultimi 2 anni (%)
      donne 50-69enni. Passi 2010-12 (n. 19.538)
Controversie • Lo screening è efficace (riduce la mortalità)? – Lo screening mammografico è mai stato efficace? – Lo screening mammografico è attualmente efficace? • Lo screening è responsabile di sovradiagnosi? • [Il bilancio tra danni e benefici giustifica il mantenimento di costosi programmi di screening?]
Efficacia
Relative mortality benefit
• The purpose of screening is to advance the time of diagnosis
  so that prognosis can be improved by earlier intervention.
• A consequence of earlier diagnosis is that it increases the
  apparent incidence of breast cancer in a screened population
  and extends the average time from diagnosis to death, even if
  screening were to confer no benefit.
• The appropriate measure of benefit, therefore, is reduction
  in mortality from breast cancer in women offered screening
  compared with women not offered screening.
• In the panel’s judgement, the best evidence for the relative
  benefit of screening on mortality reduction comes from 11
  randomised controlled trials (RCTs) of breast screening
• Marmot MG, Altman DG, Cameron DA, Dewar JA, Thompson SG,
  Wilcox M. The benefits and harms of breast cancer screening: an
  independent review. Br J Cancer. 2013;108:2205-40
“…ecological studies comparing
                                           areas or periods when screening
                                           programmes were and were not in
                                           place … the Panel did not consider
                                           these studies to be helpful in
                                           estimation of the eff ect of
                                           screening on mortality, both
                                           because of the changes over time
                                           in the use of more effective
                                           treatments and because of the
                                           difficulty in exclusion of imbalances
                                           in other factors that could affect
                                           breast cancer mortality”
                                           Marmot MG BJC 2013

  Riduzione della mortalità per cancro della mammella in
Europa. Malvezzi M, Bertuccio P, Levi F, La Vecchia C, Negri E. European cancer mortality
                  predictions for the year 2014. Ann Oncol. 2014 Apr 23
Nickson C, Mason KE, English DR, Kavanagh AM. Mammographic screening
and breast cancer mortality: a case-control study and meta-analysis. Cancer
Epidemiol Biomarkers Prev. 2012 ;21:1479-88.
Puliti D.Contribution of screening to
decreased breast cancer mortality
• It is widely agreed that screening alone cannot
be the major factor responsible for the decrease
in breast cancer mortality over the last 20 years.
• Improvements in treatment and service delivery
are likely to have made the largest contribution to
decreased mortality (Berry et al, 2005).
The benefits and harms of breast cancer screening: an
independent review. Independent UK Panel on Breast Cancer
Screening. Lancet. 2012;380:1778-86The additional data from the
U.S. and the composite
analysis lends further
support to conclusion that
treatment and not screening
has been the primary
reason for mortality
reduction.
Figure 1: Percent of country's
females participating in
screening mammography
(upper panel) and change in
national breast cancer
mortality rate relative to the
country's mean rate during
1980-1985(lower panel).
U.S. Breast Cancer Mortality Data Consistent with European Report on Lack of Impact of
Screening Mammography . Bleyer A http://www.bmj.com/content/343/bmj.d4411/reply#bmj_el_268797Impact of screening mammography on breast
cancer mortality
Archie Bleyer, Cornelia Baines and Anthony B. Miller. Int. J. Cancer: 138, 2003–
2012UK Panel on Breast Cancer Screening. Lancet. 2012
≈20%Three types of uncertainties Three types of uncertainties surround this estimate of 20% reduction in breast cancer mortality. • The first is statistical: the 95% confidence interval (CI) around the relative risk (RR) reduction of 20% was 11–27%. • The second is bias: there are a number of potential sources of distortion in the trials that have been widely discussed in the literature ranging from suboptimal randomisation to problems in adjudicating cause of death. • The third is the relevance of these old trials to the current screening programmes Marmot MG BJC 2013
Qualità dei trial e inclusione nella
                   meta-analisi
Randomised controlled trials potentially provide the most
  reliable information about the effects of breast screening
• We assessed whether the randomisation was adequate
  and led to comparable groups following standard criteria
  as closely as possible (Higgins 2008).
• We divided the trials into those with adequate
  randomisation and those with suboptimal randomisation
Gøtzsche PC, Jørgensen KJ. Screening for breast cancer with
  mammography (Review). The Cochrane Library 2013; 6
Screening with mammography versus no screening, Deaths ascribed to breast cancer, 13 years follow up.
Screening versus no screening, Deaths ascribed to breast cancer, 13
         years follow up, women at least 50 years of age.
Miller A. et al. Twenty five year follow-up for breast cancer incidence and mortality of the Canadian National Breast Screening Study: randomised screening trial BMJ 2014; 348 Conclusion. Annual mammography in women aged 40-59 does not reduce mortality from breast cancer beyond that of physical examination or usual care when adjuvant therapy for breast cancer is freely available. Overall, 22% (106/484) of screen detected invasive breast cancers were over-diagnosed, representing one over-diagnosed breast cancer for every 424 women who received mammography screening in the trial
Screening per classe d’età
1/0,0005251904
• Maggiore efficacia nella classe d’età 60-69
• Insufficiente evidenza nelle donne ≥70 anni (negli US lo
screening è diffuso anche >80 anni)
• Pace LE, Keating NL. A systematic assessment of benefits and risks to guide
breast cancer screening decisions. JAMA. 2014;311:1327-35
• *ARR = Absolute Risk Reduction NEITHER adjusted risk ratio NOR “We also report absolute
risk ratios calculated by inverting the NNI” Variabili stime del “Number needed to invite/screen” (per prevenire 1 decesso)
Mortalità per tutte le cause

• Lo screening non modifica la mortalità
  complessiva
Overall mortality, 13 years follow up
Screening e trattamento

• La coorte sottoposta a screening è esposta ad
  un significativo aumento del rischio di
  intervento chirurgico
Number of mastectomies and lumpectomies
Screening e intensità di trattamento
Se il principale beneficio dello screening è
  rappresentato dalla guarigione (riduzione della
  mortalità),
• un beneficio secondario dovrebbe essere
  rappresentato dalla minore intensità di cura
  necessaria per trattare la malattia in fase precoce.
• Nonostante l’anticipazione diagnostica, lo
  screening mammografico è associato ad un
  aumento del rischio di ricevere trattamenti come
  la mastectomia
Screening with mammography versus no screening, number of mastectomies
Spiegazione
• Maggiore aggressività verso i casi diagnosticati
  allo screening (modalità di presa in carico)
• Sovra-diagnosi associata a sovra-trattamento

• La sovra-diagnosi è la diagnosi allo screening
  di una lesione che non avrebbe dato luogo a
  malattia clinica e quindi non sarebbe stata
  individuata nel corso della vita
Stime sovra-diagnosi
Trial:The frequency of overdiagnosis was of the order of 11% from a
population perspective, and about 19% from the perspective of a
woman invited to screening
Studi osservazionali: vary across the range of 0–36% of invasive
breast cancers diagnosed during the screening period
Mortalità, incidenza, stadio e
         screening
Autier P, Boniol M, Gavin A, Vatten LJ. Breast cancer mortality in neighbouring
European countries with different levels of screening but similar access to
treatment: trend analysis of WHO mortality database. BMJ. 2011Contesto: Trend di incidenza e mortalità,
tutte le età (tassi st. Umbria 2001)
170
160 Variazione annua % VA% 5.0* (1.8-8.3)
150 3.4* (2.4-4.4)
140
130
120 VA% -2.3* (-3.7- -0.8) Incidenza
110 Incidenza jp2
100
50
40
30
20 VA% -1.5* (-2.3- -0.6)
Mortalità
10
Mortalitàjp0
0Nella classe d’età screening (50-69 anni)
350
VA% 6.0 (-0.2-12.5)
VA% 6.9* (5.0-8.7)
300
250
200
VA% -4.1* (-6.7- -1.4)
Incidenza
150
Incidenza jp2
100
1994 1995 1996 1997 1998 1999 2000 2001 2002 2003 2004 2005 2006 2007 2008 2009 2010
80
70
60
50
40
Mortalità
30 VA% -2.0* (-3.3- -0.7)
Mortalitàjp0
20
10
0
1994 1995 1996 1997 1998 1999 2000 2001 2002 2003 2004 2005 2006 2007 2008 2009 2010
Nella classe d’età 50-74 anni -2.2% *per anno (IC 95% -1.1- -3.3)Dati AIRTum
Vi è evidenza di un impatto diverso tra
     i servizi di screening delle usl?

                  USL 1

               USL 2

                               USL 3

                       USL 4
90
80
70
60
50 Trend di mortalità in
40 USL 1 riduzione
30 USL 2
20 USL 3
10 USL 4
90
80
70
60 Riduzione maggiore
50
USL 1 -1.3 (-4.4 - +2) nella USL 3 ;
40
30
USL 2 -2.1* (-3.1 - -1.1)
non significativa nella
USL 3 -3.2* (-5.4 - -0.8)
20
USL 4 -2.1* (-3.7 - -0.5) USL 1
10
Tassi di mortalità (st Umbria) nella classe d’età 50-74 anni per USL90
USL 1
80
USL 1 jp Riduzione
maggiore nella
70 USL 2
60 USL 2 jp
50 USL 3 ex-USL 3 ;
40 USL 3 jp
non significativa
USL 4
30
USL 4 jp nella ex-USL 1
20
10
Test:
a. per la coincidenza dei livelli
90 di mortalità: ns*
80 b. Per la variazione della
70 mortalità (parallelismo): ns
60
50 USL 1
40 USL 2
USL 3
30
USL 4
20
Umbria jp0
10
Possiamo rappresentare il trend di mortalità con un
solo valore regionale (VA -2.2% IC 95% -1.1- -3.3)Altri indicatori: i carcinomi in situ
anno % in situ 50
40 Umbria
1994 2.65
30 usl 1
1995 3.43
1996 6.95 20 usl 2
1997 7.12 10 usl 3
1998 5.52 0 usl 4
1999 7.21
2000 8.59
50
2001 9.09
2002 5.79 40 Umbria
2003 8.31 30 USL 1
2004 10.42 USL 2
20
2005 6.98 USL 3
2006 9.52 10
USL 4
2007 8.39 0
2008 10.29Effetti surrogati dello screening • A decrease in the incidence of larger tumors suggests that earlier detection is occurring — • a necessary, but not sufficient, condition for screening to result in lower mortality • (with the second condition being that earlier treatment of these tumors must be more effective than treatment after clinical presentation). Breast-Cancer Tumor Size, Overdiagnosis, and Mammography Screening Effectiveness H. Gilbert Welch et al. N Engl J Med 2016; 375;15
Bleyer A, Welch HG. Effect of three decades of screening mammography
                      on breast-cancer incidence.
              N Engl J Med. 2012 Nov 22;367:1998-2005.
Conclusions Despite substantial increases in the number of cases of early-stage breast cancer detected, screening mammography has only marginally reduced the rate at which women present with advanced cancer. Although it is not certain which women have been affected, the imbalance suggests that there is substantial overdiagnosis, accounting for nearly a third of all newly diagnosed breast cancers, and that screening is having, at best, only a small effect on the rate of death from breast cancer.
Tenendo conto dell’aumento di
                                            incidenza (anche di stadi avanzati)
                                                 la riduzione associata alla
                                              mammografia appare rilevante

Helvie, Mark A., et al. "Reduction in
late-stage breast cancer incidence in the
mammography era: Implications for
overdiagnosis of invasive cancer." Cancer
(2014).
The contribution of
mammography
screening to breast
cancer incidence
All: DCIS and invasive Invasive trends in the United
States: an updated
age-period-cohort
DCIS model.
Gangnon RE et al. Cancer
Epidemiol Biomarkers
Prev. 2015; 24:905-12
Localized
Regional DistantThe contribution of mammography screening ...
Gangnon RE et al. Cancer Epidemiol Biomarkers Prev. 2015; 24:905-12
• BACKGROUND: The impact of screening mammography on breast cancer incidence is
difficult to disentangle from cohort- and age-related effects on incidence.
• METHODS: We developed an age-period-cohort model of ductal carcinoma in situ
(DCIS) and invasive breast cancer incidence in U.S. females using cancer registry data.
Five functions were included in the model to estimate stage-specific effects for age,
premenopausal birth cohorts, postmenopausal birth cohorts, period (for all years of
diagnosis), and a mammography period effect limited to women ages ≥ 40 years after
1982. Incidence with and without the mammography period effect was calculated.
• RESULTS: More recent birth cohorts have elevated underlying risk compared with
earlier cohorts for both pre- and postmenopausal women. Comparing models with and
without the mammography period effect showed that overall breast cancer incidence
would have been 23.1% lower in the absence of mammography in 2010 (95%
confidence intervals, 18.8-27.4), including 14.7% (9.5-19.3) lower for invasive breast
cancer and 54.5% (47.4-59.6) lower for DCIS. Incidence of distant-staged breast cancer
in 2010 would have been 29.0% (13.1-48.1) greater in the absence of mammography
screening.
• CONCLUSIONS: Mammography contributes to markedly elevated rates of DCIS and
early-stage invasive cancers, but also contributes to substantial reductions in the
incidence of metastatic breast cancer.
• IMPACT: Mammography is an important tool for reducing the burden of breast cancer,
but future work is needed to identify risk factors accounting for increasing underlying
incidence and to distinguish between indolent and potentially lethal early-stage breast
cancers that are detected via mammography.Tasso di incidenza di carcinomi M+ in Umbria
per classe d’età (periodo 1994-2009)
Screening Età APC IC 95%
No(?)23
Diametro (mm)
18
medio
Umbria 13 mediano
8
1994 1995 1996 1997 1998 1999 2000 2001 2002 2003 2004 2005 2006 2007 2008
23
18
medio
USL 1 13 mediano
8
1994 1995 1996 1997 1998 1999 2000 2001 2002 2003 2004 2005 2006 2007 2008
23
18
medio
USL 2 13 mediano
8
1994 1995 1996 1997 1998 1999 2000 2001 2002 2003 2004 2005 2006 2007 2008
28
23
medio
18
USL 3 13 mediano
8
1994 1995 1996 1997 1998 1999 2000 2001 2002 2003 2004 2005 2006 2007 2008
23
18
medio
USL 4 13 mediano
8
1994 1995 1996 1997 1998 1999 2000 2001 2002 2003 2004 2005 2006 2007 2008Tutte le età
1.1
1
Sopravvivenza
p(Sopravvivenza )
0.9
0.8
relativa 0.7 2004-2008
0.6 1999-2003
1994-1998
0.5
1978-1982
0.4
0 1 2 3 4 5 6 7 8 9 10 11 12 13 14 15
Anni
50-59 60-69
1.1 1.1
1 1
0.9 0.9
0.8 0.8
0.7 0.7
0.6 0.6
0.5 0.5
0.4 0.4
0 1 2 3 4 5 6 7 8 9 10 11 12 13 14 15 0 1 2 3 4 5 6 7 8 9 10 11 12 13 14 15Attualità della discussione • I trial analizzati sono ormai datati • Il trattamento del cancro della mammella si è modificato • L’anticipazione diagnostica ottenuta mediante lo screening è ancora determinante per la guarigione? • Lo screening ha perso in parte o del tutto l’efficacia dimostrata nei trial ? • Rimane un ragionamento plausibile con qualche supporto dagli studi ecologici
The impact of advances in treatment on the
efficacy of mammography screening. Jatoi I. Prev Med.
                       2011 Jun 23.
The author argues that, for screening to be beneficial:
• the treatment of screen-detected cancers must be
  more effective than that of clinically-detected cancers.
• …as breast cancer treatments improve over time, both
  the absolute and relative benefits of screening will
  diminish.
• This is evident in the overview of the nine successive
  mammography screening trials, …
• Additionally, population-based studies seem to suggest
  that the benefit of mammography screening is
  diminishing as treatments continue to improve
U.S. Women's Perceptions of the Effects of
Mammography Screening on Breast-Cancer Mortality
as Compared with the Actual EffectsClinical decisions. Mammography
Screening for Breast Cancer
Smith RA, Kerlikowske K, Miglioretti DL, Kalager M.N Engl J Med. 2012 Nov 22;367
• Option 1. Recommend Screening
Mammography Starting at the Age of 40
• Option 2. Recommend Screening
Mammography Starting at the Age of 50
• Option 3. Do Not Recommend Screening
Mammography• Estimates of overdiagnosis have ranged from 0 to more than 50%, but the rates are small (
Option 2
Another school of thought discourages initiation of
screening until the age of 50, emphasizing that
• the 10-year risk of breast cancer is lower when a
  woman is in her 40s than when she is in her 50s
• that mammography reduces the risk of death from
  breast cancer by only 15%,
• that 1904 women 40 to 49 years of age need to be
  invited to be screened over a period of 11 to 20
  years to save one life, and
• that the harms, principally false positive findings, are
  considerable
• One school of thought asserts that progress in
  therapy has eclipsed the benefit of early
  detection and that harms associated with
  screening are excessive and outweigh the
  benefits
Conclusioni
• Lo screening mammografico contribuisce alla riduzione della
  mortalità
• Tuttavia il contributo al controllo della malattia è moderato
  /modesto
• Il miglioramento del trattamento fornisce il maggiore contributo
  al trend di mortalità
• Elementi di flessibilità potrebbero migliorare l’efficacia dello
  screening organizzato (mammella densa)
• Lo screening al di fuori della classe d’età 50-69 presenta
  elementi di dubbio più marcati
• Lo screening è associato a sovra-diagnosi e sovra-trattamento e
  quindi determina beneficio e danno
• Sostituire lo screening organizzato con l’opportunistico
  comporta un elevato rischio di maggiore inappropriatezza e
  disequità
• La rivalutazione del beneficio in relazione ai progressi
  terapeutici è importante ma richiederà anni
Aggregazione di test
Addizione
• Mammografia + ecografia
• Mammografia + risonanza magnetica

Selezione
• Mammografia
• Ecografia in caso di mammella densa

Preferenza/offerta
• FIT
• Sigmoidoscopia
• Colonscopia
• Esame virtuale
Garcia EM, Storm ES, Atkinson L, Kenny E, Mitchell LS. Current
breast imaging modalities, advances, and impact on breast care.
    Obstet Gynecol Clin North Am. 2013 Sep;40(3):429-57.

• Ultrasound and magnetic resonance
  imaging (MRI) are widely available
  adjunctive studies for women with
  suspicious mammographic or clinical
  findings, and MRI is a screening tool for
  women with specific increased risks for
  breast cancer.
.
Mahoney MC, Newell MS. Screening MR imaging versus
screening ultrasound: pros and cons. Magn Reson Imaging Clin N
Am. 2013 Aug;21:495-508.
• Data support greater sensitivity of MR imaging
compared with mammography and ultrasound in high-
risk populations, in particular BRCA 1 and BRCA 2
carriers.
• Screening ultrasound improves cancer yield versus
mammography alone in high-risk patients and in
patients with dense breasts and is less expensive.
• Drawbacks include low positive predictive value,
operator dependence, and significant physician time
expenditureDonne in età
Trends in incidence of breast cancer among women under
40 in seven European countries: A GRELL cooperative study.
            Leclerc B et al 2013 Cancer epidemiology 2013
LA MALATTIA NELL’ANZIANA
Trend di Incidenza in Umbria per classi d’età
                                            350
Age-adjusted rate per 100,000 inhabitants

                                            330

                                            310

                                            290

                                            270

                                            250

                                            230                                                                            Segment   APC    P-Value

                                                                                                                            50-59     0,7     0,2
                                            210                                                                             60-69    1.4^      0
                                                                                                                            70-79     0,4     0,2
                                                                                                                             >80     1.1^      0
                                            190
                                                  1994 1995 1996 1997 1998 1999 2000 2001 2002 2003 2004 2005 2006 2007 2008 2009 2010 2011 2012 2013

                                                                              50-59      60-69     70-79     >80
Trend di Mortalità in Umbria per classi d’età
180
Age-adjusted rate per 100,000 inhabitants
160
140
Segment APC P-Value
120 50-59 -1,6 0,1
60-69 -2.5^ 0
70-79 -2.0^ 0
100
>80 0,2 0,8
80
60
40
20
0
1994 1995 1996 1997 1998 1999 2000 2001 2002 2003 2004 2005 2006 2007 2008 2009 2010 2011 2012 2013
50-59 60-69 70-79 >80Early Breast Cancer (T1-2 e N0-1)
50-59 60-69 70-79 80-89 totale
EBC
n % n % n % n % n %
si 1084 88,56 1267 88,11 932 84,57 322 77,40 3605 79,95
no 140 11,44 171 11,89 170 15,43 94 22,60 575 20,05
EBC no EBC
100%
11.44 11.89 15.43
90% 22.6
80%
70%
60%
50%
88.56 88.11 84.57
40% 77.40
30%
20%
10%
0%
50-59 60-69 70-79 80-89Percorso terapeutico post-BCS Rec+
per classi d’età
100%
90%
80%
70%
BCS + OT+ RT
60%
BCS + RT
50%
40% BCS + OT
30%
20% BCS
10%
0%
50-59 60-69 70-79 80-89
50-59 60-69 70-79 80-89 Totale
n % column n % column n % column n % column n % column
BCS 14 1,69 21 2,02 48 6,72 87 27,27 170 5,85
BCS + OT 70 8,43 81 7,78 111 15,55 126 39,50 388 13,36
BCS + RT 37 4,46 73 7,01 34 4,76 10 3,13 154 5,30
BCS + OT+ RT 709 85,42 866 83,19 521 72,97 96 30,10 2192 75,49
Totale 830 100,00 1041 100,00 714 100,00 319 100,00 2904 100,00Ormonoterapia per età alla diagnosi e
periodo
2001-2004 2005-2008 2009-2011
100
90
80
70
60
50
40
30
20
10
0
50 55 60 65 70 75 80 85Radioterapia per età alla diagnosi e
periodo
2001-2004 2005-2008 2009-2011
100
90
80
70
60
50
40
30
20
10
0
50 55 60 65 70 75 80 85Chemioterapia per età alla diagnosi e
periodo
2001-2004 2005-2008 2009-2011
100
90
80
70
60
50
40
30
20
10
0
50 55 60 65 70 75 80 85Fine
You can also read