CAR DEPENDENCY SCORECARD 2014 - The top English cities for sustainable transport December 2014
←
→
Page content transcription
If your browser does not render page correctly, please read the page content below
CAR DEPENDENCY
 SCORECARD 2014
 The top English cities for sustainable transport
  www.bettertransport.org.uk
www.bettertransport.org.uk                          December 2014 1
Car Dependency Scorecard 2014

Contents
2	Introduction            “There is significant evidence of the
                            benefits of devolved transport planning,
                            where Combined Authorities can provide
4 City selection
                            an integrated public transport network.”
5
  How each city
                            The point of this report is simple: the way people           This year’s data comes from slightly different
  scored                    travel is affected by what councils and the                  sources, including the 2011 census, which is more
                            Government do, and if it’s made easier to use public         accurate but different from the metrics we used
                            transport and to walk and cycle, at least some               for 2012’s scorecard—so direct comparisons are
8
  Accessibility and         people now stuck in their cars will change. If action        difficult to make. The picture this year should be
  planning                  isn’t taken, people become car dependent – those             taken as a clearer view of car dependency in each
                            with cars use them more, because they feel they              city over the last three years, using indicators that
                            have no choice, and those without cars get isolated          assess provision of transport choices and conditions,
10	Buses and trains        and excluded. So we have been looking at and                 people’s perception of these options and actual take
    quality and uptake      comparing how car dependent different cites are.             up of the transport available to people.
                            One thing we’ve found is that how car dependent a            There is significant evidence here of the benefits
                            city is, and its position on the list, is not fixed. There   of devolved transport planning, where Combined
12	Cycling and walking     is a lot cities can do to improve their transport            Authorities like Manchester can provide an
    as alternatives         and reduce car dependency, and conversely there              integrated public transport network alongside
                            are cities that waste their existing advantages and          street and land development that ensures people
                            become more car dependent than other similar                 have access to shorter and sustainable journeys
14 Driving and car use      cities. So authorities should take note of their place       rather than longer and car-reliant ones. We very
                            in the ranking, but be optimistic and proactive              much hope that Manchester and other cities are
                            about making the changes necessary to move up.               given more control and funding over transport
                            In each section there are recommendations to aid             in their areas, allowing them to meet the needs
16 Also of interest         this progress.                                               of their communities and reduce unsustainable
                                                                                         dependence on cars.
                            www.bettertransport.org.uk
18 Appendices               Telephone: 020 7566 6480
                            info@bettertransport.org.uk
                            Registered charity: 1101929                                                                        Chief Executive

2                                                                                                                     www.bettertransport.org.uk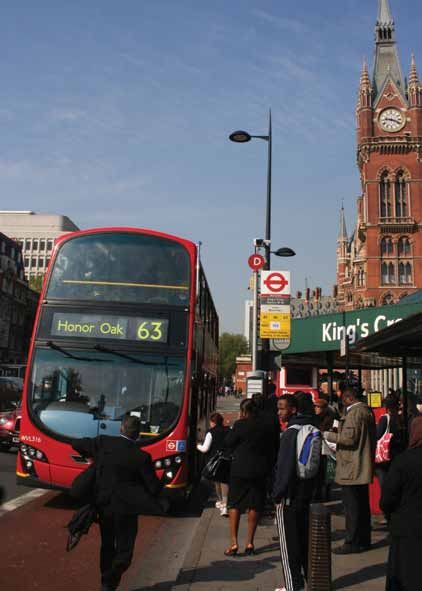
Key findings:
     • T
        he high ranks achieved by Manchester,           • Are other cities catching up with London? The
       Liverpool and Newcastle are aided by ‘city          increased cost of public transport should be of
       centre intensification’ where urban density has     concern across the country, and particularly
       been dramatically increased. Average densities      in London. Bus fares have risen by more than
       have gone up in Manchester by 28 per cent,          50 per cent in the last six years. Meanwhile,
       while many new residential developments             in the last spending review by the Chancellor,
       have been built at very high densities of 300       it was announced that funding for day-to-day
       to 400 residents per hectare                        operations in London will be reduced by 25 per
                                                           cent, meaning fares are likely to keep on rising
     • Population density does not guarantee
                                                           to make up the shortfall
       sustainable transport. Policy is important:
       relatively less densely populated cities such     • There are middling rankings for a number
       as Newcastle, Cambridge and Brighton are            of cities that are considering bypasses, such
       all much higher on the Scorecard than their         as Stockport, Norwich and Northampton.
       density would predict, due to large scale           There is a policy decision to be made here
       investment in car-free options. Newcastle           as to whether to concentrate on building
       has an extensive Metro system, Brighton             new roads and becoming more like the car
       has a local authority with a strong vision for      dependent cities towards the bottom of the
       sustainable transport provision and Cambridge       scorecard or choose another direction as
       is cycle friendly. All outperform Leicester,        cities at the top have done, with investment
       Southampton and Luton despite much higher           and encouragement of alternative modes of
       population densities in these cities                transport
     • London tops every category apart from quality     • The scorecard shows the long-standing
       and uptake of buses and trains, although it         difficulty that New Towns have with car
       still scores highly on this measure too. This       dependency. Milton Keynes, sometimes
       leadership is a result of the city’s long term      heralded as an exemplar town, comes last in
       investment in public transport infrastructure       many of the rankings. The current plans for
       and high population densities. London’s             building new Garden Cities need to ensure that
       unique transport planning structure within the      they are not designed for car dependency as
       UK offers lessons for other cities and policy       the last round of New Towns so clearly were
       makers keen to reduce car dependency

www.bettertransport.org.uk                                                                                    3
Car Dependency Scorecard 2014
City selection 5
20 18
We have selected the three largest urban
areas in each region of England, plus the
addition of Cambridge for continuity with
previous scorecards. We have also added
three further locations because, with major
new road schemes proposed in these areas,
we’re keen to see how car dependent they
already are. These are Norwich, Stockport
and Northampton. 24 17
Data was analysed across 17 indicators in London: least car dependent
four categories, and was collected where 25
possible either from the 2011 census or at
3 2 15
a local authority level (e.g. Manchester, not 12
Greater Manchester).
A full explanation of our methods can be 23 10
found in Appendix 3 13
21
11 29
8
19 21
6
27
Peterborough: most car dependent 14 28
26 1
7
9
4
15
4 www.bettertransport.org.ukHow each Accessibility and planning Cycling and walking as alternatives Larger squares =
better rankings
city scored: Buses and trains quality and uptake Driving and car use in each category
1 LONDON 6 CAMBRIDGE 11 LEICESTER 15 SHEFFIELD 21 NORTHAMPTON 26 SWINDON
2 MANCHESTER 7 BRISTOL 12 STOCKPORT 17 LEEDS 21 DUDLEY 27 milton keynes
3 LIVERPOOL 8 BIRMINGHAM 13 NORWICH 18 SUNDERLAND 23 DERBY 28 colchester
BRIGHTON
4 & HOVE 9 SOUTHAMPTON 14 LUTON 19 COVENTRY 24 BRADFORD 29 peterborough
5 NEWCASTLE 10 NOTTINGHAM 15 PLYMOUTH 20 GATESHEAD 25 WIGAN
www.bettertransport.org.uk 5Car Dependency Scorecard 2014
THE LEAST CAR-DEPENDENT CITIES
1 LONDON 2 MANCHESTER 3 LIVERPOOL
Why did London come top? Why did Manchester do so well? Why did Liverpool do so well?
London remains the least car dependent city. Manchester’s efforts to reduce car Like Manchester, Liverpool’s development
With a devolved transport system and the historic dependency have seen it give London a run has been on brownfield sites in over 90
advantage of a well-developed public transport for its money and prove that all cities can per cent of cases, and correspondingly
infrastructure delivered in a densely populated area, improve transport with the right structures the city ranks highly for accessibility
it’s easy for residents and commuters to get about in place. Manchester’s strong Combined and planning. More focus on cycling and
without a car. Using public transport is much more Authority has been able to encourage walking in Liverpool, in addition to the
convenient than driving and parking in the city, and urban infill as well as coordinating headway made on public transport co-
this has been supported rather than counteracted, transport services, which has reduced the ordination by Merseytravel, would enable
through measures such as the Congestion Charge need for many people to travel by car. the city to make even more progress
and investment in buses. London came top for The repopulation of urban areas has been toward eliminating car dependency.
accessibility and planning and its ranking for the planned in a considered way that links
However, the recent decision to axe
quality and uptake of its public transport is high. people with access to public transport.
most of Liverpool’s bus lanes will have
However, public policy and investment is crucial in Both Liverpool and Manchester have a counteracting effect. Bus priority
maintaining this position. Bus fares have risen by had over 90 per cent of new building measures must be supported and
more than 50 per cent in six years. The Chancellor of on brownfield sites. This has meant that expanded in Liverpool as elsewhere if car
the Exchequer cut funding for day-to-day operations ‘city centre intensification’ has been dependency is to be reduced.
in London by 25 per cent in the last spending review, encouraged, achieving urban densities
meaning fares are likely to rise in coming years as amenable to efficient public transport
well to make up the shortfall in transport funding. provision and encouraging walking
Rising housing costs are causing many workers to and cycling.
be pushed further and further out of the capital’s
central districts and having to commute longer
distances on an overburdened network.
6 www.bettertransport.org.ukTHE MOST CAR-DEPENDENT CITIES 27 Milton Keynes 28 COLCHESTER 29 Peterborough Why did Milton Keynes do badly? Why did Colchester do badly? Why did Peterborough come last? The new towns have generally higher levels Colchester ranked lowest for accessibility Peterborough scores poorly almost right of car dependency. Whilst walking and and planning. Out of all the cities, residents across the board. For access to primary cycling options in Milton Keynes are better in Colchester are least likely to be able to schools by walking and public transport, than a handful of other cities we assessed, get to primary school, work or the town the city scores in the top ten, and many reliance on cars is highest of all the cities. centre by walking or public transport. Whilst people already cycle regularly, showing The spread out, low density planning of the historic centre is densely packed and there is scope for improvement and a will Milton Keynes means longer distances for walkable, more recent development has for active travel. But a lack of use of public people to travel, and the road system is been spread more sparsely around the edges transport and heavy reliance on cars to get much better suited to car use than cost- of the city, meaning longer journey times. around shows that people do not have the effective provision of public transport. Although residents are relatively satisfied options they might need to get around more Driverless electric car technology is being with their railway station and should find sustainably. piloted in Milton Keynes, but the benefits of bus passes affordable, they have the least such schemes are both untested and distant. frequent bus service to a local GP. Just To address car dependency now, public over one per cent of people in Colchester transport provision must be improved and commute by bike at least five times a week, behaviour change encouraged by making the which is in the top half of the rankings, but road space more amenable to sustainable for example only a tenth of the number who transport uses. With the lowest carbon commute by bike in Cambridge. emissions ranking of the set as well, this is certainly something the city should pursue with urgency. www.bettertransport.org.uk 7
Car Dependency Scorecard 2014

                      Accessibility and planning
                      Why is accessibility and planning important?                  To calculate these rankings we looked at accessibility
                                                                                    ratings for schools, town centres, workplaces and
                      The time it takes to get to your destination is a major       hospitals in each area. We also looked at data showing the
                      factor when people are deciding how to make a journey.        proportion of new developments built on brownfield land.
                      If it’s much quicker in the car than walking, cycling or
                      public transport then these won’t seem like sensible          What does our research show?
                      options. The layout of a city and placing of housing,
                                                                                    • London scored highest, with good public transport and
                      schools, shops and services is key to creating an
                                                                                       walking accessibility to all major facilities; it had the
                      accessible place to live where people don’t feel forced
                                                                                       highest public transport accessibility to schools, town
                      into the car to get around.
                                                                                       centres and employment
                      Planning policies which have promoted out-of-town
                                                                                    • Colchester had the lowest score for accessibility
                      development have had a knock-on effect of increasing car
                                                                                       to schools and the town centre. Its low population
                      journeys in many parts of the country. Since the 1980s,
                                                                                       density presents difficulties for moving away from car
                      many retail developments with swathes of free car parking
                                                                                       dependency.
                      have sprung up distant from population centres, without
                      due regard to access by public transport. Separation of       •N
                                                                                      ottingham’s score for new development on brownfield
                      services from housing has added to this problem and            sites has reduced somewhat since we last looked at the
                      hindered accessibility improvements. In recent years we        data in 2012, down from 95 per cent to 68 per cent over
                      have also seen the centralisation of many essential local      the 3-year period.
                      services, for example with large new hospitals being built
                                                                                    • Liverpool comes out on top for proportion of new
                      on greenfield sites, an example of which is the new Norfolk
                                                                                       building on brownfield sites. This has meant that
                      and Norwich University Hospital, built on a greenfield site
                                                                                       ‘city centre intensification’ has been encouraged,
                      outside Norwich, difficult to access by public transport.
                                                                                       achieving urban densities amenable to efficient public
                      Planning policies now in theory encourage a ‘town centre         transport provision.
                      first’ approach with development that is located and
                                                                                    • Dudley’s high score for brownfield development but
                      designed to prioritise sustainable access and discourage
                                                                                       low rank overall shows that ‘city centre intensification’
                      sprawl. Although there are several good examples of cities
                                                                                       must be accompanied with active support for
                      pursuing this kind of development for housing and retail,
                                                                                       sustainable travel modes if the opportunity of reducing
                      poor practice is still commonplace and problems caused
                                                                                       car dependency is to be used. It also suffers from a
                      by previous development remain. In some cases, councils
                                                                                       legacy of out of centre car based development, notably
                      attempting to stop development on a greenfield site have
                                                                                       the Merry Hill Centre.
                      been overruled by central Government.

8                                                                                                                   www.bettertransport.org.uk
Rankings in this category:
1 London Campaign for Better Transport’s recommendations:
2 Manchester To get transport planning right it must be closely integrated with
3 Liverpool land-use planning.
4 Birmingham
5 Bristol Policies and plans should aim to reduce the need to travel and shorten
6 Brighton & Hove journey lengths to make more places accessible by walking and cycling.
7 Southampton Instead of being low density and placed in locations far from existing
8 Newcastle services, new developments should be:
9 Nottingham • Located in and around existing centres and public transport hubs
10 Leicester
11 Plymouth •C
lose to jobs, services and facilities that can be reached on foot,
12 Luton on a bike or by local public transport
13 Cambridge •D
esigned so that walking and cycling are safer, faster and more
14 Stockport convenient than driving
15 Dudley •H
igh density, so that local shops and businesses can spring up with
16 Leeds a catchment area of more customers and workers that find them
17 Norwich easy to reach
18 Northampton
• Built with lower levels of parking provision, which mainly serves to
19 Sunderland
encourage car use and is a poor use of land that also reduces density
20 Milton Keynes
21 Coventry
21 Gateshead
21 Swindon
24 Derby For further details see: http://www.bettertransport.org.uk/sites/
25 Bradford default/files/research-files/Masterplanning_Checklist_2008.pdf,
26 Sheffield and http://www.bettertransport.org.uk/sites/default/files/research-
27 Peterborough files/Masterplanning_Checklist_executive_summary.pdf
28 Wigan
29 Colchester
www.bettertransport.org.uk 9Car Dependency Scorecard 2014
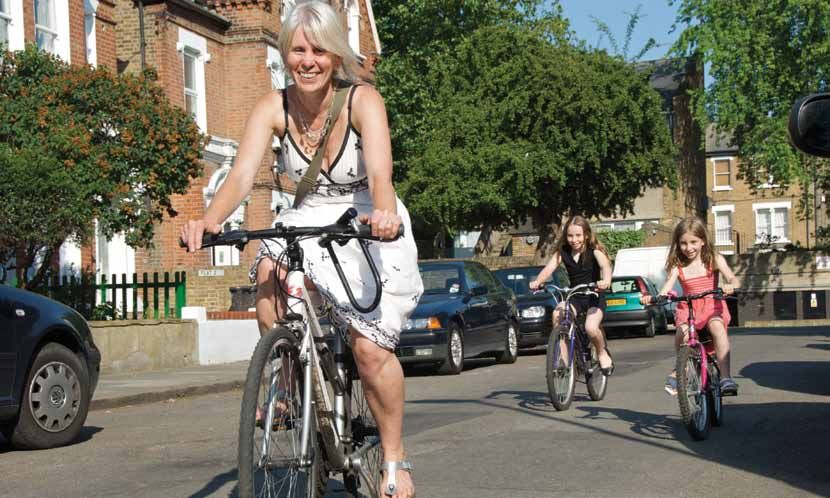
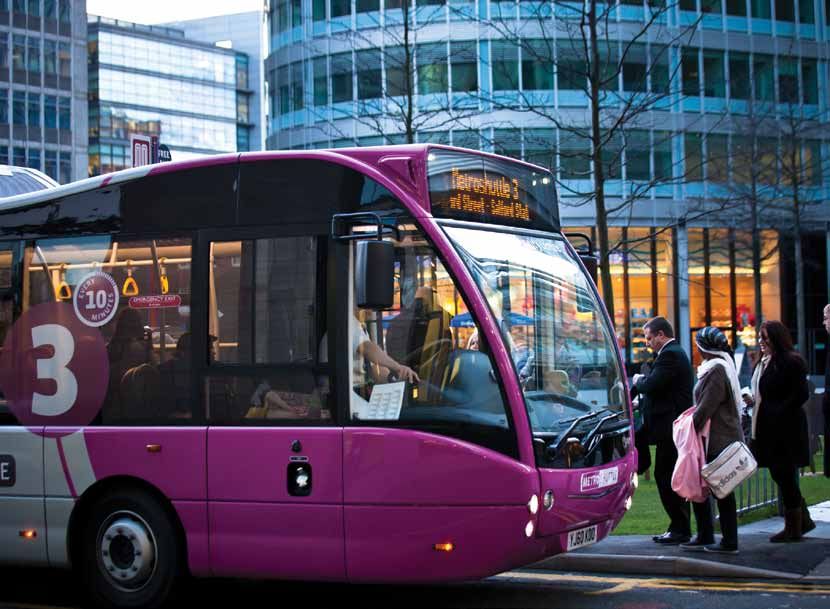
Buses and trains quality and uptake
Why is good public transport important? To calculate these rankings we looked at the quality
and use of public transport services. Our indicators
Commuting to work by public transport makes people include how many buses run on time, the accessibility
happier than those who use their car each day instead, of medical services by public transport, usage and
research from the University of East Anglia’s Norwich affordability of buses in each city, and the level of
Medical School has found. satisfaction with local railway stations.
Driving just isn’t fun if you’re stuck in a traffic jam or
searching for a parking place, and a ride on a convenient What does our research show?
bus or train has now been proven to be much less stressful.
• Nottingham’s score for customer satisfaction for
The UEA research found that the likelihood of reporting
its rail station was much lower than when we last
being constantly under strain or unable to concentrate
looked at this data. However, this comes at a time of
was at least 13 per cent higher for those participants who
major construction of new tram lines, a new road and
used car travel, when compared to active travel. Using
rebuilding of the main rail station, all of which may
public transport takes away the need to focus on the road,
have had its effect.
leaving you free to talk on the phone, read a book or catch
up on work. • While Brighton and London scored tenth and 22nd
for affordability of bus passes, it should be considered
Better public transport provision is the key to reducing
that these cities’ bus passes do include night bus
everyday dependence on the car. Quality services are
transport as well; perhaps a valuable asset for bus
frequent, cover the journeys people want to make and
users in cities with such an important night time
are affordable, with straightforward fares. They are also
economies.
integrated, with real-time information so that buses,
trains and trams connect to each other for a seamless • London comes far ahead of the other cities in travel
door-to-door service. to work by public transport. This reflects the large
variety of modes available, including rail, metro, bus
Provision like this gives more people the option to reduce
and tram in some areas. London has also succeeded
their car use or even cut out car ownership altogether,
in discouraging daily car travel into the centre using
and helps people who don’t own a car to access jobs and
congestion charging.
services from which they would otherwise be excluded.
• A weekly bus pass is much more affordable in
Cambridge than in Norwich, whose pass is the most
expensive city outside London
10 www.bettertransport.org.ukRankings in this category:
1 Manchester Campaign for Better Transport’s recommendations:
2 Brighton & Hove To make things better we need policies that help make public
2 Liverpool transport competitive with the car in terms of cost and convenience.
4 London Local authorities must prioritise support for public transport even
5 Newcastle within a restricted funding environment.
6 Cambridge
• I nvesting in new stations and lines (for example, Cambridge is
7 Birmingham
developing a new rail station at the Science Park)
8 Leeds
9 Sunderland • I mproving stations and interchanges to make them attractive
10 Coventry gateways and hubs for the cities they serve
11 Gateshead • I nvesting in light rail and guided buses where they can make
12 Southampton an impact (such as the Busway in and around Luton)
13 Stockport
•U
sing partnerships and contracts to co-ordinate and improve
14 Nottingham buses and link them to the wider transport network, including
14 Sheffield good information
16 Bristol
17 Bradford • E xpanding the use of smartcards valid on multiple modes and
17 Derby services, like the London Oyster card system
17 Leicester •G
iving buses and trams priority over other traffic
17 Swindon
21 Plymouth
22 Norwich
23 Luton
23 Wigan
25 Dudley
25 Colchester
27 Milton Keynes
28 Peterborough
29 Northampton
www.bettertransport.org.uk 11Car Dependency Scorecard 2014
Cycling and walking as alternatives
Why are cycling and walking important? What does our research show?
There are benefits for everyone when more journeys •C
ambridge has far higher numbers of cyclists than the
are taken on foot or on a bike. Walking and cycling trips other cities, with nearly three times as many residents
are free, healthy, help to cut congestion and are almost using their bike more than five times a week than the
carbon-free. However, they are under-represented in terms next best city, Norwich.
of planning and funding, with the result that a wide range
• Brighton and Norwich’s overall rankings in this
of potential journeys, and portions of longer journeys, are
category are brought down by the relatively high
taken by car instead.
number of pedestrians killed or seriously injured on
More than a fifth of car journeys are under two miles in their roads and Liverpool, from our overall top 3,
length. Many of these journeys could be made by bicycle also suffers in this category. Investigation of these
or on foot if facilities and infrastructure support the problems must be urgent.
comfortable use of these modes.
• While Dudley ranks in the top 10 in the cycling
The Cycling City Ambition programme and the Local metrics, it is in the bottom 3 for the proportion
Sustainable Transport Fund have led to more investment of people walking at least 3 times a week. This
in cycling and walking in a range of towns and cities. The could be coupled with Dudley’s fairly low rank on
Prime Minister has called for a “cycling revolution”, and uptake of public transport, the use of which is often
more attention is being paid to the design of streets and accompanied by walking.
junctions to make walking safer and more pleasant in a
Bristol, with a chequered history of cycling
number of cities. However funding for cycling is projected
infrastructure, seems to be doing well, demonstrating
to fall from 2016 without plans in place to replace or
the value of Mayoral support for cycling and a grant
secure the future of the Local Sustainable Transport Fund.
from the Local Sustainable Transport Fund. Whilst
There are still many problems to solve before we can reach there are further improvements necessary in Bristol,
the levels of cycling seen in cities elsewhere. Our European other cities could emulate the scale of Bristol’s cycle
Scorecard in 2011 found that first-placed Stockholm’s network and its use of cyclist and pedestrian priority
walking and cycling mode share was higher than anywhere at road junctions.
in the UK, despite its harsh winter climate.
London had the highest rank overall in this category.
For these rankings we looked at the accessibility of the city London’s success is influenced both by its density and
centre by bike, levels of ‘useful’ cycling and walking each unprecedented investment in cycling infrastructure.
week (i.e. not simply for leisure) and the rate of pedestrian Large increases in numbers of people cycling over
deaths and injuries in road accidents for each city. recent years should be an example to other cities.
12 www.bettertransport.org.ukRankings in this category:
1 London Campaign for Better Transport’s recommendations:
2 Bristol •C
ities must invest strongly in cycling provision if they are to
3 Cambridge emulate the progress made in London and Cambridge. Examples
4 Stockport such as central London’s bike hire system and Cambridge’s cycleway
5 Newcastle parallel to the busway could be adopted elsewhere. Future
6 Manchester investment through the Cycling Ambition Cities Programme in
7 Norwich Bristol, Birmingham, Cambridge, Leeds, Manchester, Newcastle
8 Luton and Norwich should result in improvements building on headway
8 Northampton already made in many of these cities.
8 Sheffield •C
ycling and walking, along with other sustainable transport, must
11 Plymouth be built in to planning new developments. Tacking on walking
12 Wigan paths and “cycle-proofing” roads might not be sufficient to ensure
13 Brighton & Hove developments are built in a way that minimises car dependency.
14 Dudley •M
any cities need to improve the integration of different sustainable
15 Birmingham transport modes so that people can make door-to-door journeys
15 Liverpool without using a car. Where railway stations are outside the city
17 Leicester centre, for example, bus services and bike stands should help people
18 Sunderland reach the station conveniently and in time for their train. Pedestrian
19 Derby routes between the station or other edge-of-town amenities should
20 Southampton be pleasant, safe and direct. Our report Fixing the Link explains this
21 Milton Keynes in more detail.
21 Nottingham •S
afety for those walking and cycling is more important than ever,
23 Coventry and has been of particular concern in London following several
24 Swindon cyclists’ deaths. Cities should take note of the demands by cycling
25 Leeds campaigns for safe, segregated cycling infrastructure.
26 Gateshead For further details see: http://www.bettertransport.org.uk/sites/
27 Colchester default/files/research-files/13.11.04.fixing-the-link.pdf
28 Peterborough
29 Bradford
www.bettertransport.org.uk 13Car Dependency Scorecard 2014
Driving and car use
Why is car use important? What does our research show?
Lots of cars and traffic results in a low quality of life • London is still the highest ranking city in this category.
for people living in cities. Time spent in traffic jams is This is a legacy of its long term investment in public
unpleasant for drivers, but the knock-on effects can be transport, with the extension of the Tube in the early
deadly for everyone, with at least 29,000 people dying twentieth century and the creation of Transport for
prematurely each year in the UK because of air pollution. London in the 2000s, which was instrumental in the
resuscitation of London’s buses.
Air and noise pollution in UK cities is made much worse
by our high levels of car dependence. Heavy car use in • London and Brighton were the only two cities where
a city can be a result of failings in the other areas we less than half of residents drove to work. Both
have studied, including a lack of alternatives and poor cities have well developed public transport systems
planning. However, it can also be encouraged directly providing alternative modes, and London’s Congestion
by increases in road capacity (‘induced traffic’ is a well- Charge discourages commuting by car.
known consequence of road building and widening) or if
• Milton Keynes is last in all three rankings for this
local authorities allow large amounts of free parking in
category. The town was built for the car, so radical new
their cities.
ideas would be required to change this structure. With
There is also a wide variation in different cities’ levels proposals for a new wave of new towns supported by
of investment in Smarter Choices programmes of all major political parties, the Government would do
personalised, school and workplace travel planning. well to remember the importance of planning that can
These have been shown to be particularly effective in support good public transport.
reducing car use when they accompany improvements
• Liverpool scores strongly in this category, with the
in public transport, walking and cycling facilities, and
smallest amount of cars per household leaving it
can help to promote car sharing schemes. The Local
second only to London here.
Sustainable Transport Fund has enabled Smarter
Choices programmes to be developed, and needs to be •S
tockport and Wigan rank fairly low, indicating a car
continued and expanded. dependent hinterland around Manchester’s city centre
resurgence in public transport. Public transport should
To calculate these rankings we measured the percentage
be strengthened across the Greater Manchester region,
of people using a car to get to work, the miles of traffic
and with the city recently offered an elected mayor
per person and the number of cars per household.
and potential for control of transport decision making
and spending, we anticipate improvements across the
city region.
14 www.bettertransport.org.ukRankings in this category:
1 London Campaign for Better Transport’s recommendations:
2 Liverpool To reduce car dependency and cut congestion, road policies in
3 Brighton & Hove cities should be focused on demand management, not on increasing
3 Manchester capacity for car travel which just creates more traffic and more
5 Nottingham car dependency:
6 Leicester
• Reduce the demand for driving through measures such as London’s
7 Cambridge
Congestion Charge and Nottingham’s Workplace Parking Levy,
8 Newcastle and use funds raised to invest in public transport, as our highest
9 Southampton ranked cities have done.
10 Norwich
11 Sheffield •B
us lanes and bus priority schemes should be used, which support
12 Birmingham the high economic value of buses.
13 Bristol •S
mall-scale infrastructure improvements, such as real-time
14 Bradford public transport information, 20mph speed limits, cycle parking
15 Luton and pedestrian and cycle priority, can significantly reduce car
16 Leeds dependency.
16 Plymouth •R
epair and maintenance of roads and pavements, funding for which
18 Gateshead has been squeezed but presents good value for money.
19 Coventry
• L ocal Enterprise Partnerships should take note of our report,
20 Sunderland ‘Improving local transport helps the economy’, which features case
21 Colchester studies of successful Local Sustainable Transport Fund projects
22 Derby including in Liverpool, Manchester and Nottingham. We urge them
23 Stockport to focus more of the transport investment funds they control onto
23 Wigan these measures, including area-wide sustainable travel and ‘Smarter
25 Northampton Choices’ programmes, which can generate big benefits for both
26 Dudley reducing congestion and the wider economy.
27 Swindon For further details see: http://www.bettertransport.org.uk/sites/
28 Peterborough default/files/pdfs/LTSF%20Report%20June%202014%20-%20
29 Milton Keynes web.pdf
www.bettertransport.org.uk 15Car Dependency Scorecard 2014
Wider benefits of low car dependency
Rankings in this category:
Transport Emissions 1 Cambridge
Reducing car use will reduce air pollution in our cities and is an
2 Luton
important consideration in reducing the carbon footprint of our 3 London
cities. Milton Keynes is bottom of the driving and car use ranking 4 Southampton
and also has some of the highest level of transport emissions of 5 Sheffield
any of the cities. 6 Manchester
7 Leicester
The advantages of zero-carbon forms of transport such as cycling
are made clear by the example of Cambridge. This ‘cycling city’ has
8 Wigan
the lowest transport emissions of any of the cities. 9 Norwich
10 Bristol
London is another top ranking city for low levels of transport 11 Bradford
emissions, which can be credited to its electrified metro system 12 Stockport
and the impact of introducing a Low Emissions Zone – the only UK
13 Birmingham
city to do so despite its proven success in 47 German cities.
14 Birghton & Hove
The Environmental Audit Committee in their report ‘Action on Air 15 Dudley
Quality’, published 8 December 2014, identifies the need for more 16 Liverpool
action to reduce pollution from cars and lorries within towns and 17 Nottingham
cities, calling for urgent action to improve urban air quality in light 18 Coventry
of emerging evidence that pollution can increase mortality rates.
19 Plymouth
Better health
20 Leeds
21 Northampton
The top seven cities on our Scorecard for car dependency were 22 Newcastle
also the top seven cities where people described their health as 23 Sunderland
’very good’ in the 2011 census. It seems that making our cities 24 Milton Keynes
less car dependent may also make them more healthy places to
25 Derby
live and work. While we have not explored this link to identify
any causal relationship, the strong correlation deserves further
26 Swindon
attention in future. Reductions in carbon emissions have a clear 27 Gateshead
relationship to health benefits, and high levels of active travel, 28 Colchester
rather than driving, can be expected to have similar impacts. 29 Peterborough
16 www.bettertransport.org.ukConclusion As we have set out in this document, the history and geography that cities have inherited can help or hinder the reduction of car dependency. But cities have reacted to their inheritance in various ways - Cambridge and Colchester both have densely packed ancient centres but whereas Cambridge has promoted cycling, buses, park and ride and traffic management, Colchester has only recently introduced measures to manage its city centre traffic more sustainably. Similarly, Nottingham and Birmingham have redesigned or even removed some of their 1960s major roads to make their cities easier to walk and cycle around, whereas other cities have yet to do this. However, some factors are beyond the direct control of cities - major roads and railways are managed by central Government and rail and bus services are privately run. Cities can work with the Highways Agency, the Department for Transport and the rail and bus operators, but ultimately we believe that car dependence can best be tackled if the Government devolves transport powers to cities themselves, so that sustainable, integrated transport which responds to the needs of people and the environment can be planned and delivered in partnership with those who use it. www.bettertransport.org.uk 17
Car Dependency Scorecard 2014

     Appendix 1 Indicators used and data references
     A: Accessibility and planning                          B2: Frequency of bus services to General                    C4: Number of pedestrians killed or seriously
     A1: How many 5-10 year olds are dependent              Practitioner – 2013                                         injured – 2013
     on the car for their journey to school – 2013          Available from DfT, table ACS0405.                          Available from DfT, table RAS30043
     Available from DfT, table ACS0402                      https://www.gov.uk/government/statistical-data-sets/        https://www.gov.uk/government/statistical-data-sets/
     https://www.gov.uk/government/statistical-data-sets/   acs04-travel-time-destination-and-origin-indicators-        ras30-reported-casualties-in-road-accidents
     acs04-travel-time-destination-and-origin-indicators-   to-key-sites-and-services-by-local-authority                Data for Norwich, Cambridge, Northampton and
     to-key-sites-and-services-by-local-authority           B3: How many people travel to work by bus,                  Colchester provided directly by DfT. Total resident
     A2: How many households can get to a                   metro, light rail or tram                                   populations from Nomis
     hospital within 30 minutes by walking or               Census 2011 data available from Nomis: mode of              https://www.nomisweb.co.uk/reports/lmp/la/
     public transport – 2013                                transport to work (workplace data) – Bus + metro, light     contents.aspx
     Available from DfT, table ACS0406                      rail, tram                                                  D: Driving and car use
     https://www.gov.uk/government/statistical-data-sets/   https://www.nomisweb.co.uk/census/2011
                                                                                                                        D1: How many people travel to work
     acs04-travel-time-destination-and-origin-indicators-   B4: Level of satisfaction with nearest rail                 by car – 2011
     to-key-sites-and-services-by-local-authority           station – 2014                                              Census 2011 data available from Nomis: mode of
     A3: How many households can get to their               Raw data received from Passenger Focus                      transport to work (workplace data) – Car, van (driving
     town centre within 15 minutes by walking or            www.passengerfocus.org.uk                                   and passenger)
     public transport? – 2013                               B5: Affordability of bus service – 2014                     https://www.nomisweb.co.uk/census/2011
     Available from DfT, table ACS0408                      Bus costs compared to weekly wages. Weekly                  D2: Miles of traffic per person – 2013
     https://www.gov.uk/government/statistical-data-sets/   bus pass prices collected individually for each city from   Available from DfT, table TRA8902
     acs04-travel-time-destination-and-origin-indicators-   transport operators. Total average (median) weekly full     https://www.gov.uk/government/statistical-data-sets/
     to-key-sites-and-services-by-local-authority           time earnings from Nomis.                                   tra89-traffic-by-local-authority
     A4: What proportion of people have access to           https://www.nomisweb.co.uk/reports/lmp/la/
                                                            contents.aspx                                               No city level data available for Cambridge, Colchester,
     their employment by walking cycling or public                                                                      Norwich or Northampton that is collected in a
     transport? – 2013                                      C: Cycling and walking as alternatives                      comparable way. Neutral value given to these cities
     Available from DfT, table ACS0401                      C1: How many people cycle for utility at least              where data aggregated.
     https://www.gov.uk/government/statistical-data-sets/   five times a week – 2013                                    Total resident population from Nomis.
     acs04-travel-time-destination-and-origin-indicators-   Available from DfT                                          https://www.nomisweb.co.uk/reports/lmp/la/
     to-key-sites-and-services-by-local-authority           https://www.gov.uk/government/statistics/local-area-        contents.aspx
     A5: What proportion of the new developments            walking-and-cycling-in-england-2012-to-2013                 D3: Number of cars per household – 2011
     take place on brownfield land? Updated 2013            C2: How many people walk at least three times               Data from Nomis
     Available from Department for Communities and Local    a week – 2013                                               https://www.nomisweb.co.uk/census/2011
     Government, ‘live’ Table 213                           Available from DfT, Table CW0121
     Updated Dec 2013                                                                                                   E: Environmental consequence
                                                            https://www.gov.uk/government/statistics/local-area-
     https://www.gov.uk/government/statistical-data-sets/   walking-and-cycling-in-england-2012-to-2013                 E1: CO2 emissions per capita within the scope
     live-tables-on-land-use-change-statistics                                                                          of influence of Local Authorities – 2012
                                                            C3: How many people live within a 15-minute                 Available from Department for Energy and Climate Change
     B: Buses and trains quality and uptake                 cycle of the city centre – 2013                             https://www.gov.uk/government/statistics/local-
     B1: How many people travel to work                     Available from DfT, table ACS0408                           authority-emissions-estimates
     by train – 2011                                        https://www.gov.uk/government/statistical-data-sets/
     Census 2011 data available from Nomis: mode of         acs04-travel-time-destination-and-origin-indicators-
     transport to work (workplace data) – Train             to-key-sites-and-services-by-local-authority
     https://www.nomisweb.co.uk/census/2011

18                                                                                                                                             www.bettertransport.org.uk
Appendix 2 Methodology
Overview Category A The methodology for Category C Indices for footway conditions
The core cities assessed by the Car accessibility and planning indicators was the and proportion of cycling journeys during
Dependency Scorecard are the three most same as in 2012. The proportion of 5 – 10 year commuter times have been replaced by the
populous cities in each English region. olds dependent on a car for school journeys percentage of people walking at least three
We have expanded this in previous years to was calculated by dividing the number of times a week and numbers of people driving
include more areas where we are interested in 5 – 10 year olds who can travel by car but not to work, using data that is considered much
working with local councils to improve their walk / use public transport to get to primary more accurate. The indicator of numbers of
transport policies, for instance Cambridge, school by the total number of 5 – 10 year olds. people driving to work has been moved to
Wigan and Peterborough. This year’s Category B New indices have replaced ‘non Category D.
Scorecard also includes three cities with frequent bus services running on time’ and Category D Data on car usage for school runs
road-building plans – Norwich, Southampton ‘bus patronage per capita’ as local authorities is no longer collected by the government and
and Stockport – where we wanted to look at have stopped collecting the necessary data. this indicator has been replaced by numbers
how car-dependent these areas already are. They have been replaced by Census data on of people driving to work.
Indicators the numbers of people taking the train, bus, For the indicator ‘vehicle miles of traffic
metro, tram and light rail to work. per capita’, city-level data for Colchester,
The cities were ranked using 17 indicators
under four catergories: The affordability of bus passes in each city Cambridge, Norwich and Northampton that
was calculated in the same way as 2012’s is collected in a comparable way was not
A) Urban accessibility and planning Scorecard, comparing the price of a weekly available. An average score has been given to
B) Quality and uptake of public transport bus pass (valid on a reasonably extensive bus these cities.
service network) with the median wage for the area. The final rankings
Sometimes a composite figure was created
C) Are walking and cycling good options? Each city was ranked on each indicator, and
based on an average between different
D) Local Transport Plan assessment quoted weekly prices weighted toward the these ranks were then summed across each
more extensive service provision. However category to find the category rankings.
Categories A and B had five indicators,
some unfairness may be built in, for example To get an overall ranking, category ranks
Category C had four indicators and Category
Brighton’s pass includes night buses as well. were summed, so each area of interest counts
D had three. Data was gathered from
London’s bus pass is inclusive of tram travel. equally towards the final score. No weighting
local authorities where available and most
was used for any indicator.
accurate, but the 2011 Census has been
used where it provides more accurate data,
or where a local authority has stopped
gathering certain information. This means
a small number of indicators have changed
since the 2012 Car Dependency Scorecard.
www.bettertransport.org.uk 19Car Dependency Scorecard 2014
Photography credits:
Cover – Transport for Greater Manchester
p9 – Chris Jones on Flickr; Sally Cairns
p11 – Mersey Travel
p12 – Transport for Greater Manchester
p16 – Monika Kostera on Flickr
Others by Campaign for Better Transport
Contact Editorial & Research
communications@bettertransport.org.uk Alan Gillingwater
020 7566 6480 Chloë Darlington
20
Campaign for Better Transport, 16 Waterside, 44–48 Wharf Road, London N1 7UX www.bettertransport.org.uk
www.bettertransport.org.ukYou can also read